2016 | Lavras | Editora UFLA | www.editora.ufla.br | www.scielo.br/cagro http://dx.doi.org/10.1590/1413-70542016403042215
Nitrate and potassium concentration in fertigated
soil cultivated with wine vines
Concentração de nitrato e potássio em solo fertirrigado e cultivado com videira de vinho
Alexsandro Oliveira da Silva1*, Davi José Silva2, Luis Henrique Bassoi3
1Universidade Federal Rural de Pernambuco/UFRPE, Engenharia Agrícola, Recife, PE, Brazil 2Empresa Brasileira de Pesquisa Agropecuária/Embrapa Semiárido, Petrolina, PE, Brazil 3Empresa Brasileira de Pesquisa Agropecuária/Embrapa Instrumentação, São Carlos, SP, Brazil *Corresponding author: [email protected]
Received in november 15, 2015 and approved in January 8, 2016
ABSTRACT
In the semiarid region of Brazil the use of irrigation systems for applying fertilizers in horticulture is the primary means for incorporating nutrients in the soil. However, this technique still requires its use in wine vines to be assessed. In view of this, this study aimed to assess nitrate and potassium concentrations in soil fertigated with nitrogen and potassium fertilizers in 3 wine grape growing cycles. A field experiment was conducted with ‘Syrah’ wine grapes, in Petrolina, Pernambuco, Brazil; it assessed five nitrogen doses (0, 15, 30, 60 and 120 kg ha-1) and five K
2O
doses (0, 15, 30, 60 and 120 kg ha-1) applied by drip irrigation system with two emitters per plant, with a flow rate of 4 L h-1. The experimental
design used was the factorial split-plot, making up 13 combinations arranged in 4 randomized blocks. Soil solution samples were collected weekly with the aid of porous cup extractors for all treatments and at depths of 0.4 and 0.6 m by determining nitrate and potassium concentrations and electrical conductivity. Increased levels of both nutrients in the irrigation water increased the availability of nitrate and potassium in the soil solution. The highest nitrate and potassium concentrations were found in the second growing cycle at both depths studied.
Index terms: Vitis vinifera L.; soil solution; fertigation.
RESUMO
No Semiárido do Brasil com o advento da irrigação na fruticultura, o aproveitamento destes sistemas para o uso da fertirrigação é um dos principais meios para a incorporação de nutrientes no solo. Porém, esta técnica ainda requer avaliações sobre seu uso, manejo e sistemas de aplicação. Diante disto, esse trabalho teve como objetivo avaliar a concentração de nitrato e potássio em solo fertirrigado com fertilizantes nitrogenados e potássicos em cultivo de videira de vinho. Foi realizado um experimento de campo com videiras ‘Syrah’, em Petrolina-PE, sendo avaliados cinco doses de nitrogênio (0, 15, 30, 60 e 120 kg ha-1) e cinco doses de K
2O (0, 15, 30, 60 e 120 kg ha -1), em esquema fatorial fracionado, perfazendo 13 combinações, dispostas no delineamento blocos casualizados com quatro repetições, aplicadas via fertirrigação. A irrigação foi realizada por gotejamento com dois emissores por planta com vazão de 4 L h-1. Amostras de
solução do solo foram coletas semanalmente em todos os tratamentos nas profundidades de 0,4 e 0,6 m, determinando-se a concentração de nitrato, de potássio e a condutividade elétrica. Os resultados permitiram concluir que o aumento da concentração de nitrogênio e potássio na água de irrigação aumentou a disponibilidade de nitrato e potássio na solução do solo. As maiores concentrações de nitrato e potássio foram observadas no segundo ciclo de produção da cultura da videira em ambas as profundidades estudadas.
Termos para indexação: Vitis vinifera L.; solução do solo; fertirrigação.
INTRODUCTION
The vine has different nutritional needs depending on weather, rootstock, variety of canopies, conduction
system and soil, as well as specific needs of each nutrient
in its different phenological phases (Sousa et al., 2011). For this reason, knowing the nutritional requirements of this crop is of great importance for increasing productivity and improving the quality of grapes (Rocha; Bassoi; Silva, 2015). In the semiarid region of Brazil, with the advent of irrigation in fruit farming, using these systems in
fertigation is a major means for incorporating nutrients in
the soil, having as advantage reduced workforce, flexibility in application and the efficiency of its use (Cunha et al., 2014). The efficiency of fertigation involves the assessment
of the irrigation system in relation to its water application
efficiency and uniformity (Cunha et al., 2014), and the
monitoring of the application of fertilizers; additionally, one should know the concentration of the latter from the
in the soil (Coelho et al., 2014), which can be done
through the monitoring of the soil solution via porous cup
extractors (Silva et al., 2014).
Among the sources of fertilizers applied via fertigation, urea is one of the most soluble among nitrogen
fertilizers and among potassium fertilizers, potassium
chloride, potassium nitrate and potassium sulfate. Nitrogen
is the nutrient most frequently used in vine fertigation
(Sousa et al., 2011), in which the N available for plants
is dependent on the amount of organic matter in the soil, soil type, soil aeration, temperature and water content in the soil. Potassium is the second nutrient most frequently used in fertigation, mainly in the form of potassium sulfate,
being important in the lignification of branches and in the
ripening of the fruits of this crop (Terra, 2001).
In studies about fertigation, one of the essential
factors for the proper management of the fertilizers applied during the growing season is the movement of soil nutrients,
because the optimization of fertigation depends on the availability of nutrients at the depth of maximum density of the root system, avoiding leaching into the water table
and, therefore, into springs and rivers (Ramos et al., 2011).
Nitrogen is an essential element for the survival of plants, but its behavior is quite dynamic in the soil. In agricultural systems, N sources are: atmospheric deposition, nitrogen fertilization (Rocha; Bassoi; Silva, 2015), biological fixation of atmospheric N2, and mineralization of the organic N of the
soil (Siqueira Neto et al., 2010). Although N can be absorbed by plants as anion (NO3-) and cation (NH4+), its absorption
in the form of NO3- is faster because it travels through the soil solution until reaching the roots of the plants via mass
flow, and its leaching can also occur with greater ease due to excess of water (Araújo et al., 2004). According to Zanini,
Villas Bôas and Feitosa Filho (2002), potassium movement depends on the type of soil and, in most cases, is limited. In
soils with low cation exchange capacity this nutrient may be leached, but when adequate doses of fertilizer are applied, losses by leaching are extremely low for most conditions. Also according to these authors, K can move through the soil profile when there is concentration of the element close
to the emitters of the irrigation system.
The objective of this study was to assess nitrate and
potassium concentrations in soil fertigated with nitrogen and potassium fertilizers in wine vine cultivation in the Brazilian semiarid region.
MATERIAL AND METHODS
The experiment was conducted in the Experimental Field of Bebedouro at Embrapa Tropical Semi-Arid, in
Petrolina, Pernambuco, Brazil, located at latitude S 09° 08’ 08, 09”, longitude W 40° 18’ 33.6” and at an altitude of 373m. The wine vine (Vitis vinifera L.), Syrah cultivar,
was grafted on to the 1103 Paulsen rootstock. The planting was carried out on April 30, 2009, with spacing of 1 m between plants and 3 m between rows in trellis system. The vine training period lasted until the month of April 2010, when the first production pruning occurred. The
three production prunings of this study were held on
June 17, 2013, February 7, 2014 and August 6, 2014. The harvests happened on October 8, 2013, June 9, 2014 and November 25, 2014, totaling 113, 122 and 111 days
after production pruning (dapp), respectively. The soil
was classified as Argissolo Vermelho-Amarelo Eutrófico plintossólico (Typic Plinthustalf) of sandy loam texture, with 741.1 g k g-1 sand, 163.7 g k g-1 silt and 95.1 g k g-1 clay. The
moisture level corresponding to the field capacity and to the
permanent wilting point was 0.18 m3 m-3 and 0.10 m3 m-3,
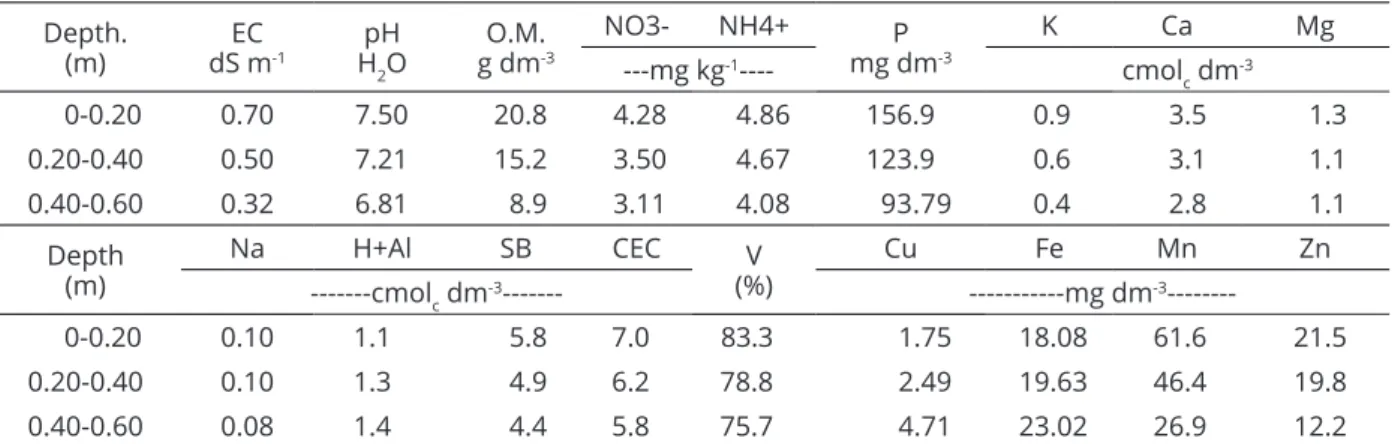
respectively. The chemical properties of the soil, obtained in the beginning of the experiment (Table 1), were assessed at depths of 0.2, 0.4 and 0.6 m.
The treatments consisted of five doses of nitrogen (0, 15, 30, 60 and 120 kg ha-1) and five doses of K
2O
(0, 15, 30, 60 and 120 kg ha-1). These treatments were
combined in a 52 split-plot factorial design (Little; Mott,
1975), totaling 13 combinations. The study was arranged in randomized blocks with four replications. Nitrogen and
potassium was supplied as urea, potassium nitrate, chloride and sulfate, applied via fertigation. The accompanying ions
were balanced by additional fertilization. The experimental unit (EU) was composed of 17 plants. The water depth was applied daily based on the crop evapotranspiration (ETc, mm) determined by the product between the reference evapotranspiration (ETo, mm) determined by the Penman-Monteith (Allen et al., 1998) and with meteorological data measured in automatic station installed 60 m from the experiment and the crop coefficient (kc) obtained in the experimental area for ‘Syrah’ vines (Bassoi et al., 2007).
The drip irrigation system was used; each experimental unit had polyethylene hoses measuring 17 meters, controlled by an in-line valve that was opened at every fertigation event. The suction system consisted of a pipe with 6 meters in length
that reached the water tank, an hydraulic motor pump set with
flow rate of 15 m³ h-1, disk filter, injection pump and a 60 L
tank for use in fertigation. The total flow rate required for the experiment was 8.81 m³ h-1, obtained through the flow rate
test on the emitters in 5-minute intervals, with average flow rate of 3.6 L h-1. In the three growing cycles, tests to assess
the statistical uniformity (Us) and the system application efficiency (Ea) were performed according to methodology
contained in Favetta and Botrel (2001). The fertilizer injection time was estimated through an injection test on
the system itself by means of electrical injection pump and using the highest fertilizer dosage in the tank (17.51 g L-1) corresponding to the joint application of doses of 120 kg ha-1
of N and 120 kg ha-1 K
2O in the respective plots, in accordance
with Zanini, Villas Bôas and Feitosa Filho (2002).
To determine the uniformity of the fertilizers,
a simulation was performed using the treatments to be employed during the experiment regarding the weekly application, assessing the distribution of the fertilizers
in relation to the distance of the emitters along the drip irrigation line, and the time after injection. The fertilizer application in the three growing cycles consisted of fertilizer dilution in the tank for injection whose sources were urea
(46% N) and potassium nitrate (12% N) in 5 concentrations (0; 1.60; 2.04; 4.66 and 8.35 g L-1) and potassium fertilizers
in 5 concentrations (0; 1.60; 2.04; 4.66 and 8.35 g L-1) whose
sources were potassium sulfate (50% K2O), potassium
chloride (60% K2O) and potassium nitrate (45% K2O),
making up the 13 combinations described above. The distance of the emitters from the beginning of the drip irrigation line was 0, 6, 12 and 18 m and the time after injection was 5, 20 and 30 minutes. After the injections of
each fertilizer were fully introduced into the system, 50 ml aliquots of fertigated solution were collected from plastic
containers installed along the drip irrigation lines and below the emitters at the different times assessed. After collection,
the electrical conductivity of these solutions was determined
with a benchtop conductivity meter in the Soil, Water and Plant Analysis Laboratory of Embrapa Tropical Semi-Arid.
The movement of nitrate and potassium ions in the soil was monitored weekly with the aid of porous
cup solution extractors (Souza et al., 2013; Silva et al., 2003) installed 0.4 and 0.6 m deep in the plant row in all treatments and in three blocks (49 batteries with 78 porous cup extractors). A vacuum of -80 kPa was applied one day after fertigation. The soil solution was extracted 24 hours
after each fertigation event. The nitrate concentration
in the soil solution was determined by means of a card specific for determining nitrate concentration, according to Silva et al. (2003), whereas potassium concentration was determined by flame photometry. Alongside the extractors, tensiometers were installed 0.40, 0.60 m deep to determine the soil moisture at the moment of the extraction of the
soil solution for correcting the latter in relation to the
moisture of the saturated paste. Prior to the experiment, soil
samples were collected to determine the moisture of the
saturated paste (Souza et al., 2013) in each experimental
unit; such value was taken as reference and used to correct
the values of nitrate (NO3-), potassium (K+) and electrical
conductivity (EC) in the soil solution, obtained by the porous cup extractors, as performed by Silva et al. (2003).
The data obtained was subjected to analysis of variance (F test) at 1% (0.01 <p) and 5% (0.05 <p) probability level. The variables with significant results were subjected to regression analysis at 1% and 5% level, using the software R®
2.8.0 version (R Development Core Team, 2012).
Table 1: Chemical characteristics of the soil of the experimental area before the application of the treatments.
EC - electrical conductivity of the saturation extract, O.M. = organic matter; = NO3- nitrate, NH4+ = ammonium, P = phosphorus; K = potassium; Ca = calcium; Mg = magnesium; Na = sodium, H+Al = potential acidity; SB = sum of bases; CEC = cation exchange capacity; V (%) = base saturation, Cu = copper, Fe = iron, Mn = manganese, Zn = zinc.
Depth.
(m) dS mEC-1
pH H2O
O.M. g dm-3
NO3- NH4+ P
mg dm-3
K Ca Mg
---mg kg-1---- cmol
c dm -3
0-0.20 0.70 7.50 20.8 4.28 4.86 156.9 0.9 3.5 1.3
0.20-0.40 0.50 7.21 15.2 3.50 4.67 123.9 0.6 3.1 1.1
0.40-0.60 0.32 6.81 8.9 3.11 4.08 93.79 0.4 2.8 1.1
Depth (m)
Na H+Al SB CEC V
(%)
Cu Fe Mn Zn
---cmolc dm-3--- ---mg dm-3
0-0.20 0.10 1.1 5.8 7.0 83.3 1.75 18.08 61.6 21.5
0.20-0.40 0.10 1.3 4.9 6.2 78.8 2.49 19.63 46.4 19.8
RESULTS AND DISCUSSION
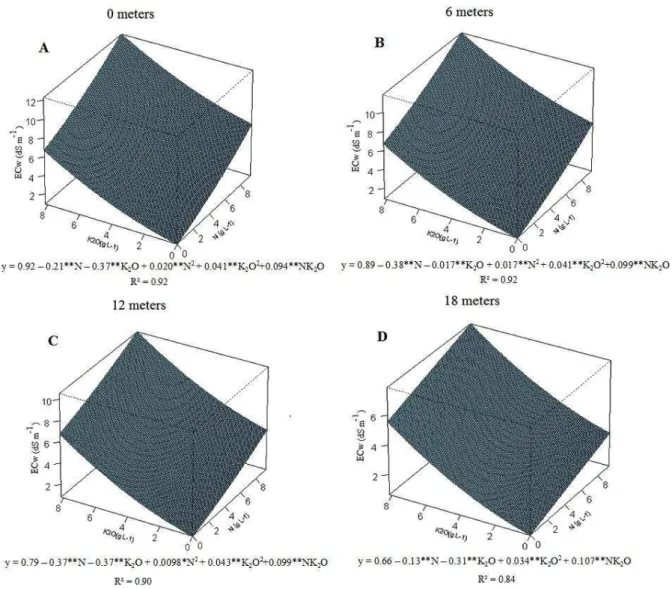
The dispersion analysis of the data showed an increase
in electrical conductivity values in the irrigation water (ECw) as N and K2O doses increased (Figure 1) in each application
of the injection solution. For the emitter at the distance of 0 m
(Figure 1A) from the beginning of drip irrigation line, it was observed that for the combination of potassium and nitrogen concentrations of 8.35 g L-1 the ECw showed a value of 6.64 dS m-1, while in the lower concentrations in the injected
solution of K2O and N (1g L-1) analyzed separately, the
values were 0.33 dS m-1 and 0.37 dS m-1. In the emitters
located at 6 m (Figure 1B) the smallest ECw values were observed in levels of 0 g L-1 N and 2 g L-1 K
2O with 0.11
dS m-1 and 7.58 dS m-1 for the concentrations of 8 g L-1 for
K2O and N. For the emitter located at the distance of 12 m
(Figure 1C), the increase in the ECw with the increase in the fertilizers in the injected solution showed maximum values of 6.91 dS m-1 for the concentrations of 8 g L-1 N
and K2O, while for emitters located at 18 m (Figure 1D)
the maximum ECw values were 7.33 dS m-1.
According to Coelho, Andrade Neto and Barros (2014) and Coelho et al. (2014), the increased fertilizer doses in the injected solution, besides increasing ECw, contributes significantly to increasing the concentrations of
the fertilizers applied to the soil, as nitrate and potassium.
These results are similar to those observed by Cunha et al.
Figure 1: Analysis of dispersion of electrical conductivity in the irrigation water (ECw) subjected to different
fertilizer doses along the drip irrigation line at distances of 0 m (A), 6 m (B), 12 m (C) and 18 m (D).
(2014) in studies about the uniformity of fertilizers under a subsurface drip irrigation system.
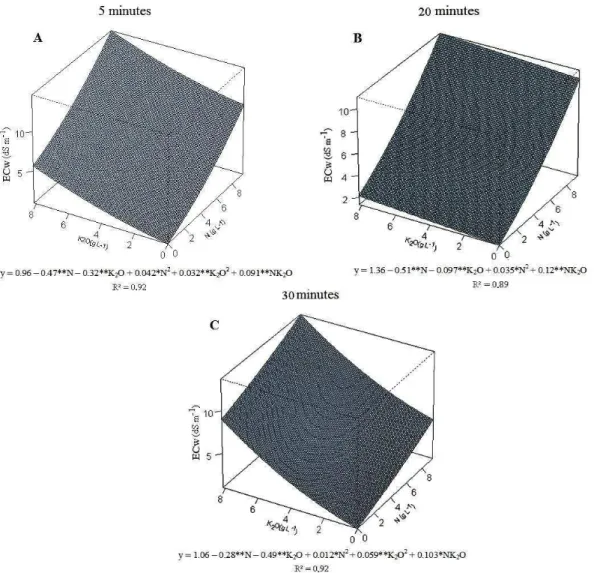
Regarding ECw in the different times of fertilizer
application into the irrigation system after complete
injection of fertilizer solution, the highest ECw values were observed for the highest fertilizer concentrations in all times studied. For data obtained at the time of 5 minutes after injection (Figure 2A), there were ECw values between 0.13
dS m-1 and 6.68 dS m-1 for lower (1 g L-1 N and K2O) and
higher (8.35 g L-1 N and K
2O) fertilizer concentrations in the
injector solution, respectively. For the time of 20 minutes after injection (Figure 2B), the fertilizer concentrations in
the injector solution mentioned above showed ECw values
between 0.24 and 7.99 dS m-1; but a smaller influence of
potassium fertilizers on the ECw were observed in that period. For the time of 30 minutes after injection the ECw showed progressive increase in its values to the maximum of 7.26 dS m-1 (8.35 g L-1 K
2O and N), this value being lower
than that observed at the time of 20 minutes, showing a possible reduction of the ECw from the time of 30 minutes (Figure 2C).
According to Zanini, Villas Bôas and Feitosa Filho
(2002), the fertilizer application time or fertigation time
should be sufficient so that the whole dose required is correctly applied, in addition to extra time to allow the
cleaning of the irrigation instruments, which may vary
Figure 2: Analysis of dispersion of electrical conductivity in the irrigation water (ECw) subjected to different
fertilizer doses measured at different times: 5 min (A), 20 min (B), 30 min (C) on the drip irrigation line.
from an hour or two. Sousa et al. (2011) stated that the
fertigation time should not be less than 30 minutes because there might be a risk of low uniformity of distribution of
the fertilizers over the area, affecting the development and productivity of the crop.
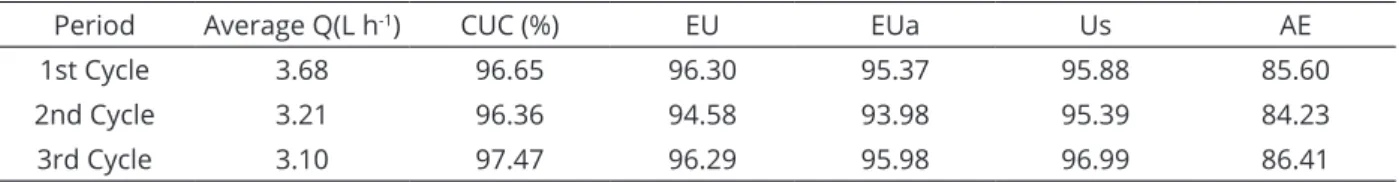
By assessing the uniformity of the irrigation system
application (Table 2) in the different cycles studied, it was possible to see a reduction in the initial flow of the system in later growing cycles, but there was no reduction in water application efficiency. According to Favetta and Botrel (2001), the use of these equations proves to be potentially viable in post-implementation assessments of irrigation systems, because the choices of collection points for flow measurements are completely different between the concepts of emission uniformity and statistical
uniformity. Regarding the application of fertilizers through
the irrigation system studied, its efficiency was considered
satisfactory, thus not compromising the use of fertigation
during the experimental cycles.
In the monitoring of the nitrate concentration
(NO3-) in the soil solution during the first growing cycle
at the depths of 0.4 m (Figure 3A) and 0.6 m (Figure 3B), the nitrate concentrations were virtually constant until 73 days after production pruning (dapp). As of the 73 dapp there was an increase in NO3-concentration at both depths, with values greater than 400 mg L-1 possibly due to low
water demand by plants in this period, which contributed to increasing NO3- concentration in the soil solution.
In the second growing cycle there was a greater
variability between the NO3- concentrations in comparison
with the first cycle. At a depth of 0.4 m there were NO 3-concentrations greater than 1,000 mg L-1 throughout the
growing cycle (Figure 3C), reaching values greater than 3,000 mg L-1 at a depth of 0.6 m (Figure 3D), especially
in the treatments with the highest N doses. However, the concentrations found in both depths at the end of the cycle
were low, less than 100 mg L-1. Thus, part of the nitrate
present in the soil solution was absorbed by the plants, and the other part was possibly lost by leaching. Hannam et al. (2013) in studies about nitrogen fertilization and
controlled irrigation in cv. Merlot vines observed that in
sandy soils with low organic matter the time for applying
N should be chosen carefully to enhance the efficiency of absorption of this nutrient for plants.
The third growing cycle started with only 57 days
of rest after the harvest of the second cycle, with the nitrate concentration in the soil solution relatively low.
The NO3- concentration in the soil solution at a depth of
0.4 m (Figure 3E) stood relatively constant throughout
the cycle studied, with the highest concentration,
of 677 mg L-1, being reached 64 dapp. At a depth of
0.6 m (Figure 3F) there was an increase in nitrate concentrations, reaching values above 1,000 mg L-1 for the treatment with application of 120 kg ha-1 N. These results indicate that there was a greater nitrate concentration in the deeper layers of the soil, which
reflects the effect of applying nitrogen fertilizers at high concentrations in the soil. Considering the effective depth of the wine vine root system of 0.6 m (Bassoi et al., 2007), it is possible that high nitrate concentrations have been lost by leaching, causing the contamination of the water table. However, Alcântara and Camargo (2010) in studies about nitrate movement in columns of
horizontal soils claim that the movement of this ion is delayed in relation to the advancing of the wetting front.
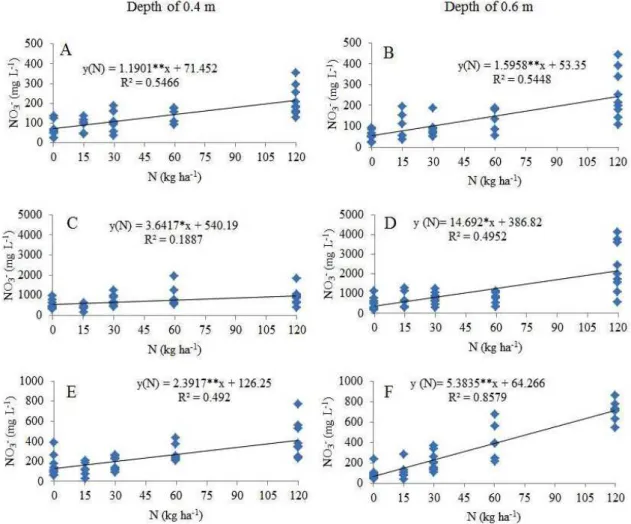
In the analysis of variance for the nitrate in the soil
solution response variable, it was possible to observe only the influence of the nitrogen dose factor at 1% probability by the F test at all depths studied (0.4 to 0.6 m). The K2O dose factor
and the N/K2O interaction showed no effect on the variable
studied. These results are similar to those obtained by Coelho et al. (2014), showing the high influence of nitrogen fertilizers on NO3- concentration in the soil solution.
The regression analysis of the data shows a linear effect on the nitrate concentration in the soil solution in
response to the nitrogen doses applied (Figure 4). In the first
growing cycle at the depth of 0.4 m there was an increase of
1.19 mg L-1 in the NO
3- concentration for each unit increase in
the nitrogen dose applied to the soil (Figure 4A), while for the depth of 0 6 m the increase stood at 1.59 mg L-1 (Figure 4B).
Period Average Q(L h-1) CUC (%) EU EUa Us AE
1st Cycle 3.68 96.65 96.30 95.37 95.88 85.60
2nd Cycle 3.21 96.36 94.58 93.98 95.39 84.23
3rd Cycle 3.10 97.47 96.29 95.98 96.99 86.41
Table 2: Assessment of the irrigation system during the 3 growing cycles for average flow rate (Q), Christiansen’s
In the second growing cycle the NO3-concentration
at the depth of 0.4 m showed an increase of 3.64 mg L-1
(Figure 4C), while at the depth of 0.6 m (Figure 4D) the value was 14.69 mg L-1 at each unit increase in the nitrogen doses applied. In the third growing cycle there is once
again a linear fit for the data obtained with increases of 2.39 and 5.38 mg L-1 for each unit increase in the nitrogen
doses applied for the depths of 0.4 m (Figure 4E) and 0.6 m (Figure 4F), respectively. The results obtained corroborate those of Coelho, Andrade Neto and Barros (2014), who observed an increasing NO3-concentration in the soil solution with the increase in the nitrogen fertilizer dose
applied via fertigation in the banana crop.
The monitoring of ion potassium concentration in
the soil solution in the first growing cycle showed, at a depth of 0.4 m (Figure 5A), low concentrations in K values, from 32 to 52 dapp; at 60 dapp there was an increase in K
values for doses of 30 (101.5 mg L-1), 60 (89.48 mg L-1)
and 120 (195 mg L-1) kg ha-1of K
2O, and after this period
concentration values stabilized, except for the dose of 60
kg ha-1, at 87 dapp, which showed K concentration of 191.8 mg L-1. At the depth of 0.6 m (Figure 5B) K concentrations
were lower than those obtained at the depth of 0.4 m, increasing only at 52 dapp (272.8 mg L-1) In general, the
potassium concentration did not exceed 200 mg L-1. In the second growing cycle, at the depth of 0.4 m
(Figure 5C), the K concentration showed high values in the period between 39 and 46 dapp; after this period there was a reduction in the concentration of the ion, possibly
due to the consumption of the plant associated with the crop evapotranspiration rates (kc equal to 1,0) with greater
absorption of the soil solution. At the depth of 0.6 m (Figure 5D) there was an increase in K concentration at 19 dapp in the treatment with higher dosage; thus, it was
Figure 3: Nitrate concentration at soil depths of 0.4 and 0.6 m, respectively, in the first (A and B), second (C and
possible to observe the movement of this ion between the
layers studied; however, over the cycle few oscillations
were observed in the treatments. In general, the potassium concentration did not exceed 200 mg L-1 (Figure 5E and
F). According to Zanini, Villas Bôas and Feitosa Filho
(2002), potassium moves with limitation through the soil
profile, where losses by leaching are low even in sandy soils with low CEC.
In the third growing cycle, K concentrations barely exceeded 120 mg L-1, being significantly reduced
in the treatments with higher doses (60 and 120 kg ha-1
of K2O). According to Duarte, Pereira and Korndofer
(2013) when studying the leaching of potassium in
soils under different sources of fertilizers, the highest
leaching levels occurred with sources of KCl, but
Laurindo et al. (2010) in studies about the distribution of this nutrient in the soil via fertigation observed that the K concentration in the soil is reduced when outside the range of the wet bulb.
In the analysis of variance for the K variable, a significant effect of the potassium dose factor was observed for all growing cycles and soil depths studied at 1% probability, except in the second growing cycle and at the depth of 0.6 m. In studies about the dynamics of
nutrients in fertigated citrus orchard, Souza et al. (2012)
also observed an increase in K concentration in the soil solution as NPK doses applied through fertigation increased, but the availability of this nutrient may vary significantly depending on the phenological phase of the
vine crop (Silva et al., 2014).
Figure 4: Regression equations for the average nitrate concentration in the soil solution at the depths of 0.4 and
0.6 m, respectively, in the first (A and B), second (C and D) and third (E and F) wine vine growing cycles.
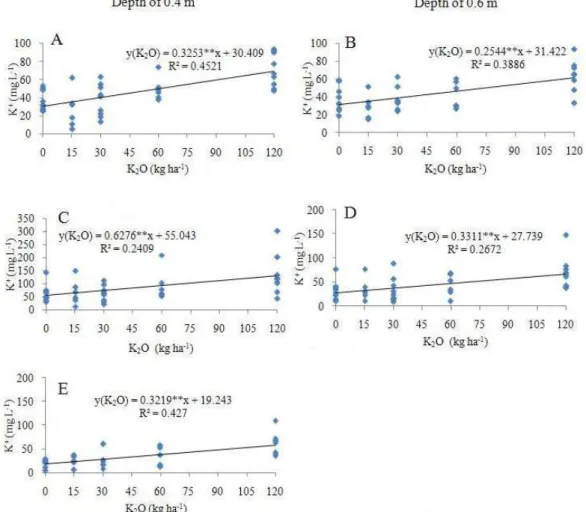
The regression analysis of the concentration of the
potassium ion had a linear fit according to the potassium doses applied (Figure 6). In the first growing cycle there was an increase of 0.3253 mg L-1 and 0.2544 mg L-1 for
each unit increase in the K2O doses used, at the depths of
0.4 m (Figure 6A) and 0.6 m (Figure 6B), respectively. In the second cycle, at the depth of 0.4 m (Figure 6C) there was an increase of 0.6276 mg L-1 for each unit increase
in the K2O doses studied. In the third growing cycle the
increase in K concentration was 0.3219 mg L-1 at the depth
of 0.4 m (Figure 6E), and 0.3311 mg L-1 at the depth of
0.6 m (Figure 6D). The linear effect presented in this study corroborate with those of Silva et al. (2014), in studies about K2O doses (0, 20, 40, 80 and 160 kg ha
-1) applied via
fertigation to Syrah vines, in which these authors observed higher values of K ion in the highest K2O doses applied.
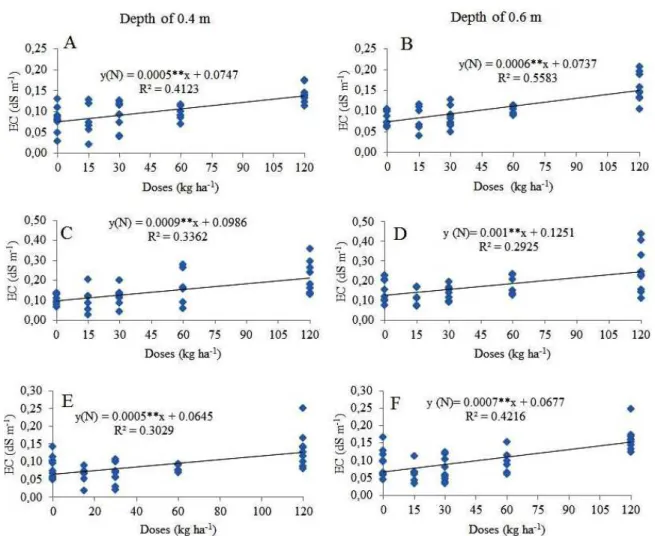
The electrical conductivity of the soil solution
increased with the N doses; there was interaction with K2O
only at the depth of 0.4 m in the second growing cycle.
These results reinforce the influence of nitrogen fertilizers on the soil solution, as observed by Coelho, Andrade Neto and Barros (2014) and Souza et al. (2012). According to
the analysis of dispersion of data on electrical conductivity
in the soil solution (Figure 7), the best fit model was the
linear one for all growing cycles and depths studied.
For the first growing cycle there was an increase in EC with the unit increase in the nitrogen doses studied, with values of 0.0005 and 0.0006 dS m-1 at the
depths of 0.4 m (Figure 7A) and 0.6 m (Figure 7B),
respectively. In the second growing cycle the increase
in electrical conductivity was respectively 0.0009 dS
m-1 and 0.001 dS m-1for the depth of 0.4 m (Figure 7C)
and 0.6 m (Figure 7D). For the third growing cycle,
Figure 5: Potassium concentration at the soil depths of 0.4 and 0.6 m, respectively, in the first (A and B), second
increases of 0.0005 and 0.0007 dS m-1 were observed
at the depths of 0.4 m (Figure 7E) and 0.6 m (Figure 7F), respectively, for each unit increase in the nitrogen
doses applied via fertigation.
The elevation in EC in the soil solution with
the increase in the application of fertilizers should
be monitored carefully, since applying nutrients in successive growing cycles may raise EC undesirably, affecting the yield of crops (Silva; Klar; Silva, 2015); for this reason, the use of porous cup extractors assist in the
management of fertigation and can prevent soil salinity
problems (Silva, 2014).
Figure 6: Regression equations for potassium concentration in the soil solution at the depths of 0.4 and 0.6 m,
respectively, in the first (A and B), second (C) and third (D and E) wine vine growing cycles.
CONCLUSIONS
The distribution of fertilizers was influenced only by their concentrations in irrigation water. Neither the injection time or distance of the emitter from the beginning of drip irrigation line influenced the electrical conductivity
in the water.
The increase in nitrogen and potassium concentrations
in the irrigation water increased the availability of nitrate
and potassium in the soil solution. The nitrogen fertilizer
increasingly influenced the electrical conductivity in the soil
solution. The highest nitrate and potassium concentrations
were observed in the second wine vine growing cycle at both depths studied, with a significant potential for leaching
losses of nitrate.
REFERENCES
ALCÂNTARA, M. A. K.; CAMARGO, O. A. Movimentação de nitrato em horizonte superficial e subsuperficial de Latossolo e Nitossolo com cargas variáveis. Pesquisa Agropecuária Brasileira, 45(1):81-88, 2010.
ALLEN, R. G. et al. Crop evapotranspiration: guidelines for computing crop water requirements. Rome: FAO, (Irrigation and Drainage Paper, 56), 1998. 300p
ARAÚJO, A. R. et al. Movimentação de nitrato e amônio em colunas de solo. Ciência e Agrotecnologia, 28(3):537-541, 2004.
BASSOI, L.H. et al. Preliminary results of a long-term experiment about RDI and PRD irrigation strategies in winegrapes in São Francisco Valley, Brazil. Acta Horticulturae, 754(1):275-282, 2007. Figure 7: Regression equations for electrical conductivity in the soil solution at the depths of 0.4 and 0.6 m,
respectively, in the first (A and B), second (C and D) and third (E and F) wine vine growing cycles.
COELHO, E. F.; ANDRADE NETO, T. M.; BARROS, D. Concentration of injetion solution and its effects on soil and on yield of fertirrigated banana cv. Terra Maranhão. Engenharia Agrícola, 34(6):1104-1113, 2014.
COELHO, E. F. et al. Concentração de nitrato no perfil do solo fertigado com diferentes concentrações de fontes nitrogenadas. Revista Brasileira de Engenharia Agrícola e Ambiental, 18(3):263-269, 2014.
CUNHA, F. N. et al. Uniformidade de aplicação de fertilizantes sob um sistema de gotejamento subsuperficial. Revista Brasileira de Agricultura Irrigada, 8(5):391-402, 2014.
DUARTE, I. N.; PEREIRA, H. S.; KORNDOFER, G. H. Lixiviação de potássio proveniente do termopotássio. Pesquisa Agropecuária Tropical, 43(2):195-200, 2013.
FAVETTA, G. M.; BOTREL, T. A. Uniformidade de sistemas de irrigação localizada: validação de equações. Scientia Agricola, 58(2):427-430, 2001.
HANNAM, K. D. et al. The concentration of yeast assimilable nitrogen in Merlot grape juice is increased by N fertilization and reduced irrigation. Canadian Journal Plant Science, 93(1):37-45, 2013.
LAURINDO, V. T. et al. Padrão de distribuição de K+, Ca++,
Mg++ e P no solo de um pomar de citros em função
da fertirrigação. Engenharia Agrícola, 30(5):909-921, 2010.
LITTEL, R.C.; MOTT, G.O. Computer assisted design and analysis of response surface experiments in agronomy. Soil and Crop Society of Florida Proceedings, 34(1):94-97, 1975.
NESTHED, N. et al. Evaluation of different fertigation equipments and the hydraulic performance of the drip fertigation system. Journal of Agriculture Science, 1(1):12-17, 2013.
RAMOS, M. R. et al. Evaluation of nitrate leaching in a vulnerable zone: effect of irrigation water and organic manure application. Spanish Journal of Agricultural Research, 9(3):924-937, 2011.
R Development Core Team. R: A language and environment for statistical computing: reference index version 2.8.0. Vienna foundation for statistical computing. Available in: <http://www.r-project.org/>. Access in: 2012.
ROCHA, M. G.; BASSOI, L. H.; SILVA, D. J. Atributos do solo, produção da videira ‘Syrah’ irrigada e composição do mosto
em função da adubação orgânica e nitrogenada. Revista
Brasileira de Fruticultura, 37(1):198-207, 2015.
SILVA, A. O. A fertirrigação e o processo de salinização de solos em ambiente protegido. Nativa, 2(3):180-186, 2014.
SILVA, A. O.; KLAR, A. E.; SILVA, E. F. F. Manejo da fertirrigação e salinidade do solo no crescimento da cultura da beterraba.
Engenharia Agrícola, 35(2):230-241, 2015.
SILVA, D. J. et al. Adubação orgânica e fertirrigação potássica em videira ‘Syrah’ no Semiárido. Irriga, 1(1):168-178, 2014.
SILVA, E. F. F. et al. Utilização de testes rápidos e extratores de solução do solo na determinação de nitrato e potássio.
Engenharia Agrícola, 23(3): 460-467 2003.
SIQUEIRA NETO, M. et al. Mineralização e desnitrificação
do nitrogênio do solo sob sistema de plantio direto.
Bragantia, 69 (4): 923-936, 2010.
SOUSA, V. F. et al. Manejo da fertirrigação em fruteiras e hortaliças. In: SOUSA, V. F. et al. (Coord). Irrigação e fertirrigação em fruteiras e hortaliças. Brasília: Embrapa
Informação Tecnológica, 2011. v.1, p.317-337.
SOUZA, E. R. et al. Comparação de métodos de extração da solução do solo. Revista Brasileira de Engenharia
Agrícola e Ambiental, 17(5):510-517, 2013.
SOUZA, T. R. et al. Dinâmica de nutrientes na solução do solo em pomar fertirrigado de citros. Pesquisa Agropecuária
Brasileira, 47(6):846-854, 2012.
TERRA, M. M. Nutrição e adubação da videira. In: BOLIANI, A. C.; CORRÊA, L. de S. (Ed.). Cultura de uvas de mesa: do plantio à comercialização. Ilha Solteira: Unesp-Fapesp, 2001, v.1, 149-176p.