An Acad Bras Cienc (2018) 90 (1) Anais da Academia Brasileira de Ciências (2018) 90(1): 541-555
(Annals of the Brazilian Academy of Sciences)
Printed version ISSN 0001-3765 / Online version ISSN 1678-2690 http://dx.doi.org/10.1590/0001-3765201720160910
www.scielo.br/aabc | www.fb.com/aabcjournal
Potassium adsorption in soil cultivated with sugarcane
JOYCYELY M.A.S. FREITAS1
, ANDRÉ M. NETTO2
, MARCUS M. CORRÊA1 , BRUNO T.L. XAVIER3
and FERNANDO X. DE ASSIS2
1
Programa de Pós-Graduação em Engenharia Ambiental, DTR-UFRPE, Rua Dom Manoel de Medeiros, s/n, Dois Irmãos, 52171-900 Recife, PE, Brazil 2
Programa de Pós-Graduação em Tecnologias Energéticas e Nucleares, DEN-UFPE, Av. Prof. Luiz Freire, 1000, 50740-545 Recife, PE, Brazil 3
Faculdade Mater Dei, Departamento de Agronomia, Rua Mato Grosso, 200, Centro, 85501-030 Pato Branco, PR, Brazil
Manuscript received on January 3, 2017; accepted for publication on June 20, 2017
ABSTRACT
Vinasse is a byproduct of the process of distillation of sugarcane juice for the manufacture of sugar and alcohol. Because it is rich in nutrients, mainly potassium (K), is used as fertilizer and applied via fertigation, without concerning for the fate of this compound in the soil. Thus, the objective of the study was to evaluate the interactions of the potassium ion (K+
), applied via vinasse in a soil representative of the sugarcane zone of the State of Pernambuco using adsorption isotherms. The methodology was based on physical, chemical and soil mineralogical characterization, as well as equilibrium batch tests, where the experimental curves were fitted by Langmuir and Freundlich isotherm models. The results allowed to infer that the Freundlich model showed better fit of the curve in both forms: linear and non-linear (direct fit); the non-linear model was selected due to the values of coefficient of determination (R²). The interaction between potassium and soil occurred mainly with organic matter and the presence of soil kaolinite, because they showed negative ions on the external surface, thereby promoting potassium adsorption. Soil potassium adsorption capacity was higher for the first layer (0-20 cm) and decreased along the depth profile.
Key words: Sugarcane, vinasse, Langmuir and Freundlich isotherms, sorption.
Correspondence to: André Maciel Netto E-mail: [email protected]
INTRODUCTION
Vinasse is a by-product originated from the
distillation of sugarcane juice during the
industrialization process to form sugar or alcohol. For many years, this effluent has not had a correct disposal or legislation guiding and supervising
the producers. Initially, it was disposed “fresh”,
with very high temperature, on river beds, thus
damaging the entire biota. Today, due to the low implantation investment, fertigation of sugarcane with vinasse is a regular agricultural practice in the Brazilian sugar-alcohol industry.
doses one can expect increase in the profits, for both the saving with fertilization and the increase in agricultural yield, has systematically applied vinasse in soil, thus contaminating the surface and underground water sources. In addition, K favors sugarcane vegetation and tillering, because it acts in various physiological aspects, but the excess of this nutrient may deregulate various structural and metabolic functions of the plant.
It is known that the contamination depends on a series of factors related to the amount of wastes deposited on the soil, their concentration, local climate (rainfall) and on soil retention capacity (Brito et al. 2009). However, the environmental implications of reusing vinasse in the soil have not yet been fully understood. The recommendations for vinasse disposal in soils should be preceded by detailed studies of the factors that affect the adsorption and transport of their constituents in the different classes of Brazilian soils.
Adsorption can be taken as a key process to understand the fate of pollutants in the soil. One of the most used approaches to investigate the adsorption of pollutants in the soil is the determination of the adsorption isotherms, in which the concentration of the adsorbed pollutant is investigated under conditions of chemical equilibrium as a function of the remaining concentration in the soil solution. The Langmuir and Freundlich equations have been used frequently to describe the adsorption of different chemical elements by the colloidal phase of the soil.
In many applications, some researchers linearize the non-linear isotherms to fit a line in order to facilitate the estimation of the parameters. However, according to Osmari et al. (2013), the process of linearization may generate less precise estimators and therefore without physical representation of the studied phenomenon. Gonçalves and Beijo (2011) evaluated the relative mean bias of the parameters of the Langmuir isotherms in non-linear and linear forms and
concluded that the linear models led to values less precise and with low accuracy for the parameters, compared with the non-linear model.
Therefore, this study aimed to evaluate the interactions using adsorption isotherms of the potassium ion (K+), applied through vinasse, in a soil representative of the sugarcane zone (coastal plains with sandy texture).
MATERIALS AND METHODS
The study was carried out at the São José Sugar Mill, which has an area with 28 thousand hectares, of which 17 thousand hectares are established for sugarcane cultivation (Usina São José 2013). The studied area has history of six years under the use of vinasse, from the fermentation of sugarcane juice, through fertigation, where once a year was applied rates of 20 mm.ha-1 (the first 5 years); in the last year, the rate was changed to 30 mm.ha-1 of diluted vinasse, at the proportion of 1:1 (vinasse:water).
The soils of the studied area are generally deep, abundantly drained and with low natural fertility. The climate is tropical rainy with dry summer and mean annual rainfall of 1,867 mm. Its vegetation is composed of Sub-evergreen Restinga Forest (CPRM 2005).
Soil classification was used up to 2 m deep, where the depth, texture (in touching), coloring, and other characteristics were observed and recorded. Then, the final classification was based on the Brazilian Soil Classification System (SBCS), being classified as psamitic dystrophic YELLOW LATOSOL, Sub-evergreen Forest phase with glidingly undulating relief. (EMBRAPA 2013). The soil is situated at altitude of 15 m above the sea level, at the geographic coordinates of 7º 42’ 33’’ S and 34º 54’ 22’’ W (CPRM 2005).
An Acad Bras Cienc (2018) 90 (1)
POTASSIUM ADSORPTION IN SOIL CULTIVATED WITH SUGARCANE 543
sample of soil per layer. These soil samples were used for the physical, chemical and mineralogical determinations, as well as in sorption kinetics and batch equilibrium tests. Samples of non-deformed soils were also carried out at six points in the area for the determination of soil densities for each layer.
The physical, chemical and mineralogical characterizations of the samples were performed in the layers of 0-20, 20-40 and 40-60 cm, with three replicates per sample, at the Laboratories of Soil Contamination Evaluation, Soil Fertility and Soil Physics of the Department of Nuclear Engineering of the Federal University of Pernambuco (UFPE). In addition, the Laboratories of Soil Physics, Soil Chemistry and Soil Mineralogy of the Federal Rural University of Pernambuco (UFRPE) were also used, following the methodologies described in the Manual of Methods and Analyses of Soils (EMBRAPA 2011) and in the Manual of Chemical Analyses of Soil, Plants and Fertilizers (EMBRAPA 2009).
PHYSICAL CHARACTERIZATION
Soil density was determined using an Uhland-type soil sampler, whose volumetric ring had diameter of 0.051 and height of 0.05 m (volume of 1.02 x 10⁻⁴ m³), maintaining soil structures undisturbed. After removing the ring from the sampler, it was cleaned, covered and involved in insulating tape (EMBRAPA 2011). Soil bulk density was determined in sextuplicates representative of the soil layers of 0-20, 20-40 and 40-60 cm.
Granulometric analysis was performed through the hydrometer method suggested by Almeida et al. (2012), in which the sand fraction is sieved and there are mechanical and chemical dispersions (increment of dispersant), which promote sedimentation of the silt fraction, evidencing the clay in suspension.
Particle density determination required a pre-treatment in the soil, using hydrogen peroxide to
reduce the content of organic matter. This pre-treatment was necessary because the soil was fertigated with vinasse and received filter cake, both rich in organic matter, which alters the amount of particles of solids of the soil.
CHEMICAL CHARACTERIZATION
The soil chemical properties were quantified using Mehlich-1 to determine P and K; extractor 1 mol L-1 KCl for Ca2+, Mg2+ and Al3+; calcium acetate extractor 0.5 mol L-1 pH 7.0 for H+Al; and soil pH in water at a soil:water ratio of 1:2.5 and 1 mol L-1 KCl. Remaining P was estimated as proposed by Alvarez et al. (2000). The organic carbon content was determined by the Walkley-Black method; P by colorimetry, K by flame photometry; and Ca and Mg by atomic absorption spectrophotometry (EMBRAPA 2011). The attributes of Organic Matter (OM), extractable Hydrogen (H+), effective Cation Exchange Capability (CECef) and potential Cation Exchange Capability at pH 7.0, Sum of Base, Base Saturation, and Aluminum Saturation were estimated by calculations (EMBRAPA 2011).
SOIL MINERALOGY CHARACTERIZATION
Mineralogical analysis was performed for the clay fraction in the three layers defined in the study. Organic matter was removed from the air-dried fine earth (ADFE) samples using hydrogen peroxide, to avoid interferences in the results, while mechanical and chemical dispersions were performed with Sodium Hexametaphosphate in the Wagner-type agitator for 16 hours. The clay fraction was collected through siphoning and the volume of the cylinder was replenished with more dispersant until the total removal of the sample.
oxides, and arranged on glass slides to obtain the oriented sample by smearing (Jackson 1975).
The diffractograms were determined in an X-ray diffractometer (Shimadzu XRD 6000), operating at tension of 40 kV, with current of 30 mA and CuKα radiation, connected to the graphite crystal monochromator. The test was carried out at the Laboratory of Crystalchemistry and Micromorphology of Soils of the UFRPE Agronomic Unit of Garanhuns. The diffractograms of the clay fraction were interpreted considering the interplanar spacing (d), shape, width and intensity of the diffraction peaks (Jackson 1975, Prandel et al. 2014).
VINASSE PHYSICAL-CHEMICAL CHARACTERIZATION
Vinasse was collected in a tank of vinasse diluted at the proportion of 1:1 (water:vinasse). The sample was subjected to physicochemical characterization in pH meter, conductivity meter and flame photometer, with three replicates for each procedure, according to the Brazilian Norm 13809 (ABNT 1997).
The characterization of Potassium (K+) and Sodium (Na+) required pre-treatments of the samples. This norm delimits the method of preliminary treatment for samples of industrial effluent (vinasse) for the determination of metals through flame emission, under established conditions (ABNT 1997).
SORPTION KINETICS AND EQUILIBRIUM BATCH TESTS
Before the equilibrium batch tests, the test of K sorption kinetics was performed according to Nicochelli et al. (2012). For this study, the established times were 0, 2, 6, 12, 18, 24, 36 and 48 h. The samples of the kinetic test remained at ambient temperature, with the same proportion of equilibrium batch tests (1:4 ratio) and concentration, only and intermediate, of 213.87 mg.L-1 of K from
the diluted vinasse solution, to identify the ideal stabilization time for the adsorption of the solute in the soil.
The equilibrium batch test was based on the association of the adsorbed mass of solute and the previously established equilibrium concentrations. The equilibrium solutions were prepared using pure vinasse, with different dilutions (Nicochelli et al. 2012), resulting in solutions with respective K contents of 24.4, 44.13, 111.8, 213.87, 453.05, 694.2, 1192.1 and 1582.4 g.mL-1, where the last concentration was the content of pure vinasse sampled. All solutions were pre-treated according to NBR 13809 (ABNT 1997) and the K content indicated in the deionized water for the preparation of the equilibrium concentrations corresponded to 0.04% of the pure vinasse.
The adsorbed solution was calculated using the expression:
(
0 eq)
s
C
C
V
S
M
−
=
where S is the adsorbed concentration (g.g-1); C0 is each concentration established for the equilibrium batch tests (g.m-3); Ceq is the equilibrium concentration (g.m-3); V is the volume of the solute (mL); Ms is the mass of dry soil (g).
Thus, it was possible to drawn a plot with values of equilibrium concentration versus adsorbed concentration, which were fitted to the Langmuir and Freundlich isotherm models.
For the statistical analysis of the data, simple means and standard deviations of the three replicates were calculated and, with the program SigmaPlot, version 11 (Sigma Plot 2008), the best fit of the experimental data was estimated using the Freundlich and Langmuir isotherm models in their direct forms.
An Acad Bras Cienc (2018) 90 (1)
POTASSIUM ADSORPTION IN SOIL CULTIVATED WITH SUGARCANE 545
which describes the equilibrium relationship between the concentration in the liquid phase and the concentration adsorbed by the soil solid phase.
The parameters of the adsorption isotherms were obtained from the experimental data using the models in linear and non-linear forms, as presented in Table I (Wu et al. 2014).
The parameters of the Freundlich and Langmuir models in the linear forms were determined in the data analysis through regression using Excel (Microsoft Professional Plus 2013).
RESULTS AND DISCUSSION
The analytical numerical values (Tables II, III, IV and V), obtained with the adopted methodological procedures, specify the delimitation of the parameters for the studied soil, classified as psamitic dystrophic YELLOW LATOSOL, Sub-evergreen Forest phase with gently undulating relief. The soil samples showed sandy texture with high contents of sand, equivalent to Regosols, low fertility and
low moisture retention capacity (Araújo Filho et al. 2000).
SOIL PHYSICS CHARACTERIZATION
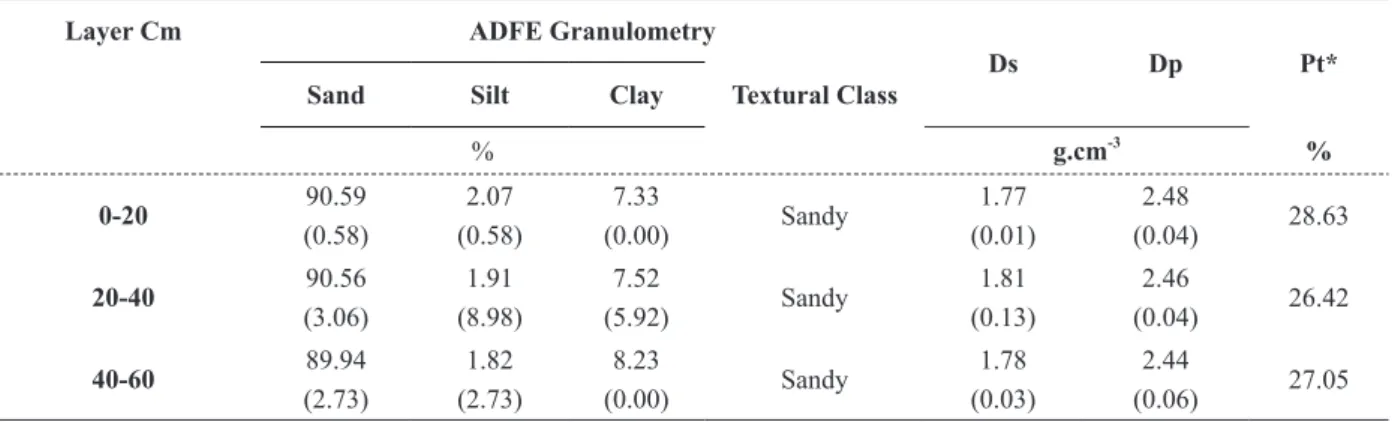
Soil physical attributes are presented in Table II. The values of soil granulometry showed an increase in clay content in the layers, from 7.33 to 8.23%, consecutively. Soil density variations from 1.77 to 1.81 g.cm-3 revealed the influence of soil preparation, due to the harrowing and chiseling performed 10 months before soil sampling. Therefore, the disturbance of the soil promoted destabilization of soil aggregates. The superficial soil layer (0-20 cm) showed the highest value of particle density (2.48 g.cm-3) after treatment to remove organic matter using hydrogen peroxide. However, the hydrogen peroxide used in the procedure does not destroy the organic matter completely, because residues will always remain.
SOIL CHEMICAL CHARACTERIZATION
Soil chemical attributes are presented in Table III. The result of pH extracted in water and KCl indicated acidity, with values between 4.93 and 6.40, confirming the study of Silva et al. (2014), who mentioned that the application of vinasse in the soil contributes to the increase in soil pH. The
TABLE I
Linear and non-linear Freundlich and Langmuir isotherm models and equations used in the SigmaPlot
for the direct fits of the models.
Model Freundlich Langmuir
Non-linear
S
=
K C
F eqn1
M L eq
L eq
S K C S
K C =
+
Model 1 Model 2
Linear lnS=lnKF +nlnCeq 1 1 1
M L M eq
S =S +K S C
1 eq
eq L M M
C S
C =K S +S
Direct fit with
SigmaPlot
y
=
ax
b1
cz q
dz =
+
S – quantity of adsorption in equilibrium (g.kg-1); KF – Freundlich constant related to the adsorption capacity (g.kg-1)(m3.g-1); Ceq
– Concentrations of liquids in equilibrium (g.m-3);
∆pH (pH KCl – pH water) of the layers were above the point of zero charge and the colloids indicated negative net electric charge. The acidic range is in agreement with the low contents of exchangeable bases, characteristic of highly weathered and leached soils (Araújo and Salcedo 1997). Latosols generally contain high indices of acidity in both surface and subsurface layers, which is evidenced by the obtained values (Araújo Filho et al. 2000).
The organic carbon (OC) decreased as depth increased and its highest value (13.56 g.kg-1) was observed in the superficial soil layer, decreasing to 12.30 and 10.52 g.kg-1 in the other layers. According to Vasconcelos et al. (2010a), OC values are considered as intermediate when they are between 6 and 12 g.kg-1. Vasconcelos et al. (2010a) comment that, in tropical areas, some factors contribute to the increase of OC in agricultural soils: high temperatures and relative air humidity, and soil preparation (especially characterized by the disturbance of the soil, which causes faster decomposition through the microbial action).
The content of organic matter (OM) decreased as depth increased, varying from 23.38 to 18.14 g.kg-1; it should be pointed out that filter cake was added to the studied soil before sampling.
Vasconcelos et al. (2010b) observed that vinasse and filter cake applied in the soil contribute to the supply of organic matter and, therefore, are beneficial to soil characteristics, because they act as a cementing agent in the process of formation of aggregates, promoting water retention, aggregate stability, soil aeration and water movement in the soil.
According to EMBRAPA (2013), Brazilian soils are well weathered and with little reactive clays. Consequently, they have lower capacity to retain ions and depend on the contents of soil organic matter to supply nutrients to the plants.
Among the exchangeable cations Ca2+, K+, Mg2+ and Na+ present in the soil, the highest values occurred for exchangeable calcium, varying from 1.50 to 1.97 cmolc.dm-3, which are probably due to the liming performed for the planting of plant cane.
Innumerous studies attribute the high content of K in the soil to the successive applications of vinasse and chemical fertilization (Vasconcelos et al. 2010a, Uyeda et al. 2013). In regard to K, the values decreased as soil depth increased, ranging from 0.31 to 0.11 cmolc.dm-3. Despite the large amounts of K in the soil, it is not able to avoid the effect of attraction between the divalent cations
TABLE II
Characterization of the physical attributes of the psamitic dystrophic YELLOW LATOSOL, Sub-evergreen Forest phase with gently undulating relief.
Layer Cm ADFE Granulometry
Ds Dp Pt*
Sand Silt Clay Textural Class
% g.cm-3
%
0-20 90.59
(0.58)
2.07 (0.58)
7.33
(0.00) Sandy
1.77 (0.01)
2.48
(0.04) 28.63
20-40 90.56
(3.06)
1.91 (8.98)
7.52
(5.92) Sandy
1.81 (0.13)
2.46
(0.04) 26.42
40-60 89.94
(2.73)
1.82 (2.73)
8.23
(0.00) Sandy
1.78 (0.03)
2.44
(0.06) 27.05 Mean values and standard deviations (between parentheses).
ADFE: Air-dried fine earth; Ds: Soil bulk density; Dp: Soil particle density; Pt: Total porosity.
* Observation: Total porosity, in the present study, was estimated through the mean of the values of soil particle and bulk densities;
An
Acad Bras Cienc
(2018)
90
(1)
POT
ASSIUM
ADSORPTION
IN
SOIL
CUL
TIV
ATED
WITH
SUGARCANE
547
TABLE III
Characterization of chemical attributes of the psamitic dystrophic YELLOW LATOSOL, Sub-evergreen Forest phase with gently undulating relief.
Layer
pH
ΔpH OC OM
P
K+
Ca2+
Mg2+
Na+
*S
2-Al3+ Potential
acidity H
+
H2O* KCl Mehlich Rem
cm g.kg-1
mg.dm-3
mg.L-1
cmolc.dm-3
mg.dm-3
cmolc.dm-3
0-20 6.4 5.4 -1.00 13.56 23.38 19.56 2.95 0.31 1.64 0.21 0.03 9.00 0.3 4.57 4.23 (0.02) (0.32) (0.55) (0.53) (0.12) (0.007) (0.12) (0.006) (0.003) (0.00) (0.10) (0.08)
20-40 6.3 5.4 -0.90 12.3 21.21 30.74 2.20 0.20 1.97 0.20 0.03 11.00 0.9 5.06 4.16 (0.02) (0.79) (1.37) (2.16) (0.18) (0.004) (0.12) (0.005) (0.003) (0.00) (0.19) (0.19)
40-60 6.1 4.93 -1.17 10.52 18.14 17.01 3.63 0.11 1.50 0.18 0.02 6.00 2.23 6.11 3.87 (0.01) (0.39) (0.67) (0.69) (0.06) (0.003) (0.18) (0.007) (0.003) (0.15) (0.29) (0.30)
N-NO3 SB t T V m Sodium saturation EC
mg.kg-1
cmolc.dm-3
% dS.cm-1
0.19 2.19 2.49 6.76 32.44 12.05 0.49 0.347
(0.01) (0.12) (0.12) (0.10) (1.44) (0.57) (0.04) (0.002)
0.18 2.4 3.3 7.46 32.21 27.27 0.37 0.292
(0.00) (0.12) (0.12) (0.15) (1.69) (0.97) (0.04) (0.006)
0.18 1.81 4.04 7.91 22.84 55.3 0.31 0.229
(0.01) (0.18) (0.06) (0.25) (2.3) (4.11) (0.02) (0.005)
Mean values and standard deviations (between parentheses).
pH: Hydrogenionic potential; ΔpH: variation in the hydrogenionic potential; OC: Organic carbon; OM: Organic matter; P: Phosphorus; K+: Exchangeable potassium; Ca2+
:
Exchangeable calcium; Mg2+: Exchangeable magnesium; Na+: Exchangeable sodium; S2-: Sulfur; Al3+: Exchangeable aluminum; H+
: Extractable hydrogen.
N-NO3: Soil nitrate; SB: Sum of bases; t: Effective cation exchange capacity; T: Cation exchange capacity at pH 7.0; V: Base saturation; m: Aluminum saturation; EC: Electrical conductivity.
*Observation: The results were provided by the Fullin Laboratory of Agronomic and Environmental Analyses and Preparation of Chemical Solutions, which provided only the
(Ca2+ and Mg2+) and the organic matter (Vasconcelos et al. 2010a). According to Cavalcanti (2008), K contents above 0.15 cmolc.dm-3 are classified as high, for agricultural soils with plant cane. Thus, the first two layers have high K content and the layer of 40-60 cm shows an intermediate K content in the soil for the sugarcane crop.
The reduced values of base saturation (V), varying from 32.44 to 22.84%, confer the dystrophic classification to the soil (< 50%). This aspect is associated with the natural fertility of the soil, due to the Fe-poor parent material or because the Fe was removed from the soil by the percolating water; thus, fertilization corrections are indicated for the agricultural use (Araújo Filho et al. 2000).
As depth increased, soil electrical conductivity decreased from 0.347 to 0.229 dS.cm-1. Uyeda et al. (2013) explains that this characteristic does not consider the ions present in the sample, but contributes to the recognition of the environmental
impacts, because the higher the amount of dissolved ions, the higher the electrical conductivity of the sample.
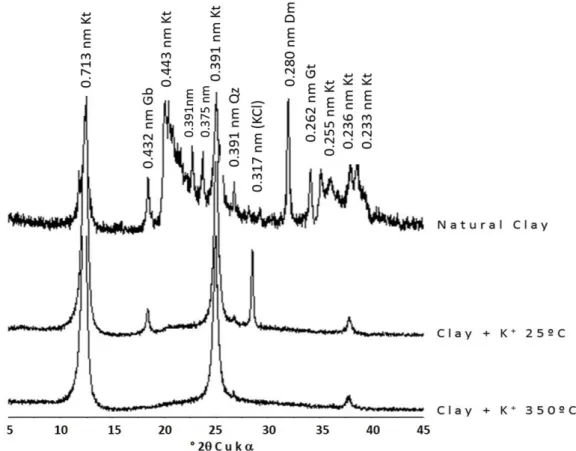
SOIL MINERALOGY
The spectra of the diffractograms of the natural clay fraction demonstrate homogeneous mineralogical constitution and distribution between the layers (Figure 1), characterized by the predominance of 1:1 minerals of the kaolinite group. The order of the main minerals indicates the presence of kaolinite (Kt) Al2Si2O5(OH)4, gibbsite (Gb) Al(OH)3 and goethite (Gt) FeO(OH) in the soil samples. Kaolinite, as the main mineral present in the clay, originates from the direct weathering of feldspars and micas.
Other peaks were observed (interplanar spacings of 0.39, 0.37 and 0.28 nm) and it was not possible to establish a relationship with minerals that are common in soils. The zone of occurrence of
An Acad Bras Cienc (2018) 90 (1)
POTASSIUM ADSORPTION IN SOIL CULTIVATED WITH SUGARCANE 549
these peaks is mainly related to feldspars; however, their absence after treatment of deferrification
and saturation with K rules out the possibility of these minerals in the studied samples. Hence, it is
believed that they are associated with detritus of fertilizers and/or correctives used intensively in the sugarcane cultivation. The peak referring to
0.28 nm was attributed to the presence of dolomite (Dm).
For Melo and Wypych (2009), the soils in which the mineral kaolinite prevails have small amount of K. The effective superficial area of kaolinite is limited to the external layers that can absorb K ions, but does not fix them to its crystalline units.
The results of the analysis of vinasse are presented in Table IV and corroborate the claim of
Nicochelli et al. (2012), according to which vinasse has an acidic character (pH < 4.0) and high levels of K.
The low electrical conductivity of the vinasse (4.63 dS.cm-1) confirms the explanation of Lyra et al. (2003), according to which the indication of low electrical conductivity suggests an increase
in the concentration of salts in the soil solution, besides greater potential to salinize the area, with the indiscriminate use of vinasse over the years.
Bebé et al. (2009) mention that inadequate vinasse application can favor the increase in the
amount of chemical elements in the soil, such as K and Na, which contribute to the increase in the
electrical conductivity of the soil saturation extract.
ADSORPTION ISOTHERMS FOR POTASSIUM IN THE SOIL
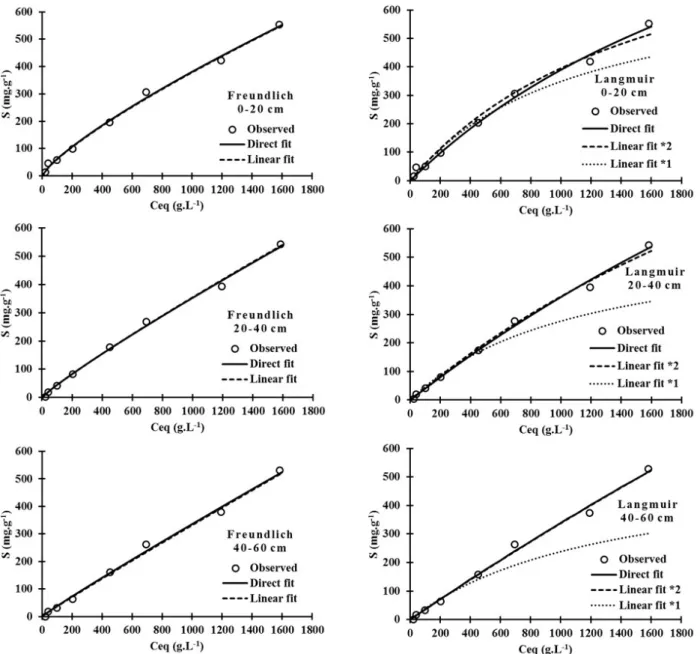
Figure 2 shows the curves of the experimental isotherms, mean of three replicates, fitted by the Freundlich and Langmuir models in non-linear and linear forms, according to the equations defined in Table I for each soil layer.
According to Figure 2, for the curves fitted with the Freundlich model, there is no difference between the curves fitted by the two methods (direct and linear), because the curves almost overlap. In addition, the values of the parameters are similar for both the Freundlich constants, related to the adsorption capacity (KF), and the constants established with the adsorption intensity (n) and also the coefficients of determination (R²) (Table V).
The comparison between Langmuir isotherms (experimentally observed, direct fit and linear fits by the models 1 and 2) shows clearly unequal data, especially for the curve of the linear fit of model 1 (Table I). Ho (2006) clarifies that, when the various types of Langmuir isotherms are used, non-linear or linear, besides the coefficient of determination to be analyzed, one must investigate mainly the parameters of the Langmuir constant (KL) and the amount of maximum adsorption (SM).
According to the graphs of Figure 2, for the Langmuir isotherm using the linear model 2, the curves were close to those fitted through the direct method of the Langmuir equation; however, the values of both KL and SM, as well as the coefficients
of determination, are different (Table V).
Figure 3 shows the graphs of the experimental isotherms (mean of three replicates and standard deviations), fitted by the Freundlich and Langmuir models (direct models) for the soil layers of 0-20, 20-40 and 40-60 cm.
For the Langmuir isotherm model, the best fits were obtained using the direct form. Similar results were reported in the study of Gonçalves and
TABLE IV Vinasse characterization.
pH EC
dS.cm-1
K Na
mg.L-1
Tank 3 3.78
(0.004)
4.63 (0.025)
1,582.4 (0.000)
17.67 (0.416) Mean values and standard deviations (between parentheses).
Figure 2 - Experimental isotherms (mean value of three replicates) fitted by the models of Freundlich (direct fit and linear fit) and
Langmuir (direct fit and fit through two linear models), for the layers of 0-20, 20-40 and 40-60 cm.
Beijo (2011), in which the linear models indicated lower values for the precision and accuracy of the parameters, compared with the non-linear model.
For the Freundlich isotherm, the coefficients of determination demonstrated that both direct and linear fits (Table V) are very close, except in the case of linear fit in the layer of 0-20 cm, where the coefficient of determination R² was equal to 0.974.
Based on the assumption presented in the study of Gonçalves and Beijo (2011), that the mean bias
An
Acad Bras Cienc
(2018)
90
(1)
POT
ASSIUM
ADSORPTION
IN
SOIL
CUL
TIV
ATED
WITH
SUGARCANE
551
TABLE V
Values of the parameters of Freundlich and Langmuir models estimated through direct fit and linear fits (for the Langmuir model, two linear models were used). Freundlich
Linear fit Direct fit
Layer K
F n R
2 K
F n R
2
cm mg.kg-1.(L.mg-1)n
--- --- mg.kg-1.(L.mg-1)n
---
---0-20 1.562 0.795 0.974 1.622 0.790 0.994
20-40 0.703 0.901 0.998 0.747 0.893 0.996
40-60 0.428 0.963 0.995 0.470 0.952 0.994
Langmuir
Linear Model 1 Linear Model 2
Layer K
L SM R
2 K
L SM R
2
cm L.mg-1
mg.kg-1
--- L.mg-1
mg.kg-1
---0-20 0.00088 746.3 0.931 0.00046 1,250.0 0.759
20-40 0.00088 591.7 0.991 0.00023 1,960.1 0.711
40-60 0.00075 555.6 0.984 0.00006 6,109.3 0.104
Direct fit
Layer K
L SM R
2
cm L.mg-1
mg.kg-1
---0-20
0.00034 0.00014 0.00006
1,553.2 2,876.8 5,770.7
0.994 0.996 0.995
20-40
40-60
KF - Freundlich constant related to the adsorption capacity (g.kg-1
)(m3
.g-1);
n - Constant established with the adsorption intensity; KL – Langmuir constant (m3
.g-1);
According to Wu et al. (2014), the Freundlich equation fits best to low concentrations, while the Langmuir equation is more adequate to higher concentrations.
The values obtained for the parameter n of the Freundlich model were 0.790, 0.893 and 0.952, respectively, for the layers of 0-20, 20-40 and 40-60 cm, evidencing that the binding sites are more homogeneous, because, according to Sposito (1980), the closer the n exponent is to one, the more homogeneous the binding sites will be. Still according to Gonçalves et al. (2013), the n value close to one indicates high adsorptive capacity (S) of the soil at high equilibrium concentrations (Ceq).
The values of ∆pH in the layers of 0-20, 20-40 and 40-60 cm were all negative, indicating the acidic character of the soil. Hence, there is a competition between the cations from the vinasse and the H+ ions for the sorption sites (Table III), corroborating the pH values found by Nicochelli et al. (2012). Consequently, the cationic exchanges promoted by soil CEC are deficient, as demonstrated in the sum of bases for this soil (Table III).
The clay fraction represents an important soil attribute in the sorption process. Despite being present in lower amount in the three soil layers, the adsorption of K was decreasing for each layer, according to the Freundlich adsorption coefficients through the direct fit (Table V). This behavior is due to the competition between Al3+, H+ and K+ for the adsorption sites, since potential acidity (H++Al3+) increases as depth increases, compared with other soils of the same category (Freitas et al. 2014).
Mitra and Prakash (1956), studying K adsorption in mineral clays of kaolinite, montmorillonite, halloysite and natrolite, deduced that the K adsorption process occurs more in alkaline medium than in acidic medium, but the characteristics that prevail in the cation of the mineral complex influence the absorption of the elements.
Still regarding soil mineralogy, evidencing the intensive presence of kaolinite in the clay fraction
diffractograms, there is a positive aspect for K sorption in the layers of 0-20, 20-40 and 40-60 cm, because this mineral helps the process, due to its negative charge. Santos et al. (2006) investigated K adsorption in tropical soils and laterite, and concluded that kaolinite adsorbs large content of K, due to the high CEC, which interacts with negative charges existing on the surface of the mineral.
K interaction occurs in competition with other cations present in the system. The presence of calcium and magnesium (Table III) in the soil from the fertilization influences the competition in the absorption of K for the adsorption sites. This result corroborates the study of Mitra and Prakash (1956), who claimed that the adsorption capacity increased due to the high contents of Ca and Mg in the soil.
An Acad Bras Cienc (2018) 90 (1)
POTASSIUM ADSORPTION IN SOIL CULTIVATED WITH SUGARCANE 553
CONCLUSIONS
Langmuir and Freundlich models were able to fit the isotherm data obtained experimentally, obtaining the adsorption parameters through the fits. Among the models, the Freundlich model in its direct form showed greater proximity to the experimental data.
The potassium from vinasse interacted mainly with the organic matter and the mineral kaolinite of the soil, because they have negative ions on the external surface, which favored higher adsorption.
Potassium adsorption capacity was higher in the first soil layer (0-20 cm), decreasing as
depth increased. Therefore, agricultural practices such as liming and addition of organic matter are recommended to help to improve soil physical and chemical quality, as well as potassium adsorption, under these edaphoclimatic conditions.
REFERENCES
ABNT - ASSOCIAÇÃO BRASILEIRA DE NORMAS TÉCNICAS. 1997. NBR 13809. Água - Tratamento preliminar de amostras para determinação de metais: Método da espectrometria de absorção atômica/emissão em chama. Rio de Janeiro.
ALMEIDA BG ET AL. 2012. Padronização de métodos para análise granulométrica no Brasil. Rio de Janeiro: Embrapa Solos, 11 p. (Embrapa Solos. Comunicado Técnico n. 66).
ALVAREZ VVH, NOVAIS RF, DIAS LE AND OLIVEIRA JA. 2000. Determinação e uso do fósforo remanescente. B Inf SBCS 25: 27-32.
ARAÚJO FILHO JC ET AL. 2000. Levantamento de reconhecimento de baixa e média intensidade dos solos do Estado de Pernambuco. Rio de Janeiro, Embrapa Solos, 378 p. (Embrapa Solos, Boletim de Pesquisa, 11)
ARAÚJO MSB AND SALCEDO IH. 1997. Formas preferenciais de acumulação de fósforo em solos cultivados com cana-de-açúcar na região nordeste. Rev Bras Cienc Solo 21: 643-650.
BEBÉ FV, ROLIM MM, PEDROSA EMR, SILVA GB AND OLIVEIRA VS. 2009. Avaliação de solos sob diferentes períodos de aplicação com vinhaça. Rev Bras Eng Agric Amb 13: 781-787.
BRITO FL, ROLIM MM AND PEDROSA EMR. 2009. Efeito da aplicação de vinhaça nas características químicas de solos da zona da mata de Pernambuco. Rev Bras Cienc Agrar Recife 4: 456-462.
CAVALCANTI FJA. 2008. Recomendações de adubação para o Estado de Pernambuco: 2ª aproximação. 3ª ed., (Coord), Recife, IPA, 212 p.
CPRM. 2005. Serviço Geológico do Brasil. Projeto cadastro de fontes de abastecimento por água subterrânea. Diagnóstico do município de Igarassu, estado de Pernambuco. Mascarenhas JC et al. (Org), Recife: CPRM/ PRODEEM.
EMBRAPA - EMPRESA BRASILEIRA DE PESQUISA AGROPECUÁRIA. 2009. Centro Nacional de Pesquisa de Solos. Análises laboratoriais. In: Silva FC (Ed), Manual de análises químicas de solos, plantas e fertilizantes, 2ª ed., rev. ampl., Brasília - DF: Embrapa Informação Tecnológica, 627 p.
EMBRAPA - EMPRESA BRASILEIRA DE PESQUISA AGROPECUÁRIA. 2011. Centro Nacional de Pesquisa
Figure 3 - Experimental isotherms (mean of three replicates
and standard deviations), fitted by the Freundlich and Langmuir
de Solos. Manual de métodos de análise de solos. In: Donagema GK et al. (Org), Manual de métodos de análise de solos, 2ª ed., Rio de Janeiro: Embrapa Solos, 230 p.
EMBRAPA - EMPRESA BRASILEIRA DE PESQUISA AGROPECUÁRIA. 2013. Centro Nacional de Pesquisa de Solos. Sistema brasileiro de classificação de solos. 3ª ed., Rio de Janeiro: EMBRAPA-SPI, 353 p.
FREITAS PL, POLIDORO JC, SANTOS HG, PRADO RB, CALDERANO SB, GREGORIS G, MANZATTO CV,
DOWICH I AND BERNARDI ACC. 2014. Identificação
e caracterização físico-química de Latossolos de textura arenosa e média da região oeste da Bahia. Cad Geocienc 11: 82-92.
GONÇALVES BO AND BEIJO LA. 2011. Influência da linearização na estimação dos parâmetros da isoterma de Langmuir. IV Jornada Científica e XIII Mostra de Extensão da UNIFAL-MG, 2011, Alfenas. Anais eletrônicos...
Alfenas: Unifal. Disponível em: <https://www.unifal-mg.
edu.br/caex/inscricoes/submissoes/S01402.pdf>. Acesso em: 15 dez. 2015.
GONÇALVES MS, BETTIN JP, SILVA JUNIOR LCS, S A M PA I O S C A N D D A L B O S C O T C . 2 0 1 3 . Adequação dos modelos de Langmuir e Freundlich na adsorção de cobre em solo argiloso do sul do Brasil. Holos 4: 37-44.
HANNAN A, RANJHA AM, RAHMATULLAH, WAQAS M
AND NIAZ A. 2007. Potassium adsorption characteristics of four different textured alkaline calcareous soils. Pak J Agri Sci 44: 242-247.
HO YS. 2006. Isotherms for the sorption of lead onto peat: Comparison of linear and non-linear methods. Pol J Environ Stud 15: 81-86.
JACKSON ML. 1975. Soil chemical analysis: advance Course. 29th
ed., Madison.
LYRA MRCC, ROLIM MM AND SILVA JAA. 2003. Toposseqüência de solos fertirrigados com vinhaça: contribuição para a qualidade das águas do lençol freático. Rev Bras Eng Agric Ambient 7: 525-532.
MELO VF AND WYPYCH F. 2009. Caulinita e Haloisita. In:
Melo VF and Alleoni LRF. Química e Mineralogia do solo. Viçosa, MG, Soc Bras Cienc Solo 2: 459-504.
MITRA SP AND PRAKASH D. 1956. Adsorption of potassium as influenced by concentration and pH of the solution. Clay Miner 3: 151-153.
NICOCHELLI LM, NASCENTES R, LIMA EBNR AND SOARES FSC. 2012. Sorção de potássio em amostras de solo submetidas à aplicação de vinhaça. Rev Bras Eng Agric Ambient 16: 754-760.
OSMARI TA, GALLON R, SCHWAAB M,
BARBOSA-COUTINHO E, SEVERO JR JB AND PINTO JC. 2013. Statistical Analysis of Linear and Non-linear Regression
for the Estimation of Adsorption Isotherm Parameters. Adsorpt Sci Technol 31: 433-458.
PRANDEL AN, SAAB SC, BRINATT AM, GIAROLA
NFB, LEITE WC AND CASSARO FAM. 2014.
Mineralogical analysis of clays in cohesive soil horizons by X-ray fluorescence and X-ray diffraction using Rietveld method. Radiat Phys Chem 95: 65-68.
SANTOS LV, POLIVANOV H, ALAMINO RCJ AND SILVA VHG. 2006. Adsorção de cloreto e potássio em solos tropicais. Anuário do Instituto de Geociências - UFRJ 29: 101-121.
SIDHU AS, NARWAL RP AND BRAR JS. 2004.
Adsorption and desorption behavior of lead in soils amended with different organic material. J Indian Soc Soil Sci 52: 43-49.
SIGMA PLOT. 2008. Scientific Graphing Software. Versão 11.0. San Jose, California, USA, Jandel Corporation. SILVA APM, BONO JAM AND PEREIRA FAR. 2014.
Aplicação de vinhaça na cultura da cana-de-açúcar: Efeito no solo e na produtividade de colmos. Rev Bras Eng Agric Ambient 18: 38-43.
SPARKS DL AND HUANG PM. 1985. Physical chemistry of soil potassium. p. 201-276. In: Munson RD (Ed), Potassium in agriculture. American Society of Agronomy,
Madison, WI.
SPOSITO G. 1980. Derivation of the Freundlich equation from ion exchange reactive in soils. Soil Sci Soc Am J 44: 652-654.
THAKUR SK, TOMAR NK AND PANDEYA SB. 2004. Sorption of phosphate on pure and cadmium-enriched calcium carbonate and clay. J Indian Soc Soil Sci 52: 23-28.
USINA SÃO JOSÉ. 2013. Informações sobre a Usina São
José. Disponível em: <http://www.agenciaepronto.com.br/
usinasaojose/index.php>. Acesso em: 13 out. 2015. UYEDA CA, MIRANDA JH, DUARTE SN, MEDEIROS
PRF AND DIAS CTS. 2013. Influence of vinasse application in hydraulic conductivity of three soils. Eng Agric 33: 689-698.
VASCONCELOS RFB, CANTALICE JRB, OLIVEIRA VS, COSTA YDJ AND CAVALCANTE DM. 2010b. Estabilidade de agregados de um latossolo amarelo distrocoeso de tabuleiro costeiro sob diferentes aportes de resíduos orgânicos da cana-de-açúcar. Rev Bras Cienc Solo 34: 309-316.
VASCONCELOS RFB, CANTALICE JRB, SILVA AJN, OLIVEIRA VS AND SILVA YJAB. 2010a. Limites de consistência e propriedades químicas de um latossolo amarelo distrocoeso sob aplicação de diferentes resíduos da cana-de-açúcar. Rev Bras Cienc Solo 34: 639-648.
WANG FL AND HUANG PM. 1990. Ion-selective electrode
An Acad Bras Cienc (2018) 90 (1)
POTASSIUM ADSORPTION IN SOIL CULTIVATED WITH SUGARCANE 555
its significance in kinetic studies. Can J Soil Sci 70: 411-424.
WANG FL AND HUANG PM. 2001. Effects of organic matter
on the rate of potassium adsorption by soils. Can J Soil Sci 81: 325-330.
WU FC, WU PH, TSENG RL AND JUANG RS. 2014.