Grouping of
anthurium
genotypes based on
genetic and morpho-anatomical features
Gabrielen de Maria Gomes Dias
1*, Joyce Dória Rodrigues
Soares
2, Ana Cecília Ribeiro Castro
3, Moacir Pasqual
2, Ivan
Júnior Ascari
2and Adriano Carvalho Costa
4Abstract: The study aimed at investigating the anatomic and DNA content characteristics of 12 Anthurium genotypes. A large genomic amplitude was observed in the genotypes, ranging from 4.95 to 22.74 pg of DNA. Differences in DNA content, assessed by flow cytometry, allowed the differentiation between the genotypes A. andraeanum, A. affine, A. bomplandii, and A. gracile and the hybrid (A. lindmanianum × A. guianesis) and clustered the group A. raimundii, plowmanii and jemanii of IFT 258, in all analyses. Anatomical studies clustered the genotypes A. andraeanum (Astral and Rubi) and distinguished the hybrid and A. bomplandii from the other genotypes, with anatomical features specific to each genotypes. Cluster analysis allowed grouping of the genotypes A. rai
-mundii and A. affine, bomplandii and gracile, A. jemanii and plowmanii, and the cultivars Astral and Rubi, and isolated the hybrid. Demonstrated the importance of grouping in the diagnosis of species belonging to the genus Anthurium. Key words: Araceae, leaf anatomy, characterization, DNA.
Crop Breeding and Applied Biotechnology 17: 341-349, 2017 Brazilian Society of Plant Breeding. Printed in Brazil
http://dx.doi.org/10.1590/1984-70332017v17n4a52 ARTICLE
*Corresponding author:
E-mail: gabriellen@gmail.com
Received: 09 April 2016 Accepted: 01 May 2017
1 Universidade da Integração da Lusofo-nia Afro-Brasileira (UNILAB), Instituto de Desenvolvimento Rural (IDR), 62.790-000, Redenção, CE, Brazil 2 Universidade Federal de Lavras (UFLA), CP
3037, 37.200-000, Lavras, MG, Brazil 3 Embrapa Agroindústria Tropical, Pici, 60.020-181, Fortaleza, CE, Brazil 4 Instituto Federal Goiano (IFGoiano), Campus Rio Verde, 75.901-970, Rio Verde, GO, Brazil INTRODUCTION
The genus Anthurium is considered taxonomically complex, with many species not very well known, and only a few studies on their geographical distribution to-date. Taxonomic differentiation of the species is difficult, mainly due to their morphological plasticity (Coelho and Catharino 2008). Some are very similar, with subtle morphological and vegetative differences, which leads to taxonomic confusion within the group. Tillich (2003) points out that there are many gaps related to the structure of the seedling in Araceae, and important details about the morphology are still unclear even though 36 genera of the family (including Anthurium) have been studied. Publications on the Araceae family include an extensive work on leaf anatomy, but few anatomical analyses have been performed on the genus Anthurium. The most recent anatomical studies on Anthurium are based on the anatomy of the leaf and spathe (Mantovani and Pereira 2005, Mantovani et al. 2010) and leaf anatomy of young and adult plants in an epiphytic habitat (Lorenzo et al. 2010).
multiple-comparisons errors, and the main goal is to reduce the variability present in the data set.
Flow cytometry has been an attractive alternative to traditional methods of DNA content determination due to its ease, speed and accuracy (Dolezel and Bartos 2005). Flow cytometric analysis of nuclear DNA content is an excellent alternative to traditional methods of chromosome counting (Loureiro and Santos 2004) and can be used to differentiate species not yet identified, as well as for anatomical analysis. Anatomical features of leaves have been studied to resolve taxonomic confusion (Moraes et al. 2011). Therefore, combining leaf anatomy and flow cytometry can provide multiple features that help to clarify relationships within the species Anthurium.
Considering the large number of species and their diversity and complexity, it is important to use more advanced technologies, such as anatomy and flow cytometry as previously mentioned, to increase knowledge regarding genus
Anthurium.
Therefore, the objective of this study was to compare morpho-anatomical characteristics for taxonomic studies of the genus Anthurium, by clustering of genotypes through cluster analysis and quantification of DNA content.
MATERIAL AND METHODS
The experiment was conducted at the Department of Agriculture of the Federal University of Lavras (UFLA) (lat 21º 14’ S, long 45º 00’ W and alt 918 m asl), Lavras, south of Minas Gerais.
Twelve genotypes of the genus Anthurium from the Embrapa Tropical Agroindustry (CNPAT) germplasm bank, collected from different regions of Brazil, were studied: Anthuriumgracile (IFT 107), A. bomplandii (IFT 108), A. raimundii (IFT 109),
A. jemanii (IFT 117), A. plowmanii (IFT 118), Anthurium sp. (IFT 123), A. lindmaniarum × A. guianesis (IFT 128), A. affine (IFT 129), Anthurium sp. (IFT 255), Anthurium sp. (IFT 258), A. andraeanum (Astral IAC) and A. andraeanum (Rubi IAC). The genotypes, previously established in vitro in the Tissue Culture Laboratory of Embrapa (CNPAT), were sent to the UFLA. They were acclimatized in pots and maintained in an acclimatization room at a temperature of ± 28 °C for a photoperiod of 12 hours. After 120 days, three fully expanded leaves from three plants were collected for analysis.
Flow cytometry
For the three independent experiments, 30 mg of leaves from each genotypes were used, combined with the same amount of pea leaves (Pisum sativum) (DNA content reference standard 9.09 pg) or bean leaves (Phaseolus vulgaris L.) (DNA content reference standard 26.90 pg). Leaves were mashed in a petri dish containing 1 mL of nuclei extraction buffer, Tris or Marie (Dolezel et al. 1989), depending on the genotypes. Readings of 5000 nuclei isolated using 1 mL of Tris or Marie buffer and stained with 25 µL propidium iodide were performed. Histograms were acquired from a FacsCalibur® cytometer (Becton Dickinson) using the Cell Quest program (Dickinson 1998). DNA content (pg) of the plants was calculated using the following equation: DNA content (pg) = position of the G1 peak of the sample/position of the standard G1 peak × pg. Statistical analysis was performed using the software WinMDI 2.8 (Trotter 2000).
Anatomical features
Leaves were fixed in F.A.A70% to perform the anatomical analysis (Kraus and Arduim 1997). Paradermic sections of the abaxial and adaxial faces were taken manually and cross-sections were made using a desk microtome (LPC model). For mounting the semi-permanent slides, sections were clarified with sodium hypochlorite 50% (v v-1) and stained with 1.0% safranin and 1.0% safrablau (0.1% safranin and 1.0% Astra blue at a ratio of 7:3), for the paradermic and cross-sections, respectively, following the methodology proposed by Kraus and Arduim (1997). The material was observed under a Olympus CX41 microscope coupled to a Belcam DIV-3000 digital camera and photographed (15 fields), and the measurements were taken using the software ImageTool (UTHSCSA Image Tool for Windows version 3.0, San Antonio, TX, USA).
Ultrastructural features
tetroxide in 0.05 M cacodylate buffer for 4 hours at room temperature, following the protocol proposed by Alves (2006). Specimens were observed using a scanning electron microscope (LEO Evo 040), operating between 10 and 20 kV. The entire adaxial and abaxial epidermis was observed for each leaf.
Experimental design and statistical analysis
Experiments were conducted using a completely randomized design with 12 treatments (genotypes) and three repetitions (three leaves per genotype). All the data were subjected to Anova using the software R (R Development Core Team 2011) and the means were compared using the Scott-Knott test at 5% probability. Samples were compared based on similarity of anatomical features and DNA content through cluster analysis. After establishing 12 features for the leaf (Density of the stomata (DS), polar diameter (PD) and equatorial diameter (ED) of the stomata and PD/ED ratio, adaxial epidermis (ADE), abaxial epidermis (ABE) and mesophyll (ME) thickness of leaf tissues, presence and absence of drusen, waxes and stomata, DNA content and coefficient of variation (CV) of histograms), cluster analysis was performed using the Euclidean distance and the most suited linkage method (centroid, complete, medium, simple, and ward) was verified and selected for the comparison using the cophenetic correlation coefficient. The software R (R Development Core Team 2010) was used for data analysis.
RESULTS AND DISCUSSION
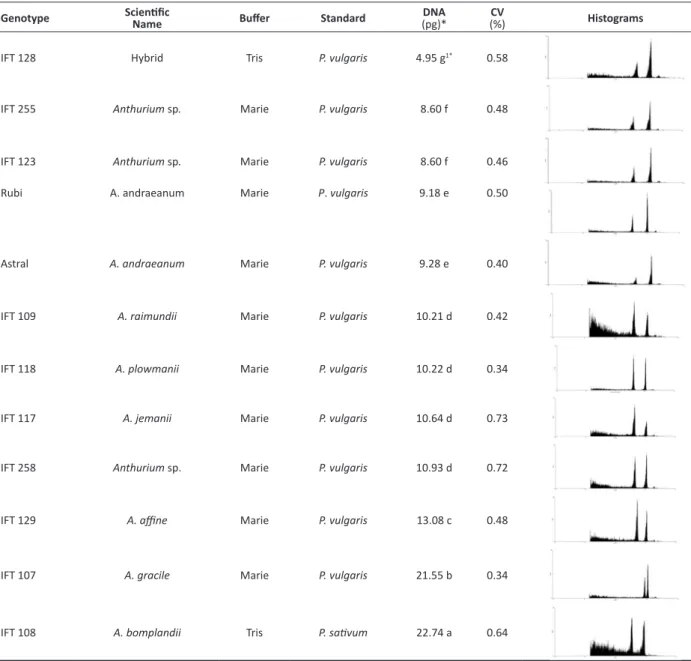
Regarding genomic amplitude, a great amplitude was observed in the genus Anthurium, ranging from 4.95 to 22.74 pg (Table 1). There was a clustering of the genotypes, which were divided into seven groups. The first group was only composed of the IFT 128 (hybrid A. lindmanianum × A. guianesis)with 4.95 pg. The second group was composed of the genotypes IFT 123 (Anthurium sp.) and IFT 255 (Anthurium sp.), materials not yet identified, with approximately twice the amount of DNA (8.60 pg) when compared with the first group. The third group has the commercial cultivars (Rubi and Astral) belonging to the genotype A. andraeanum, with 9.18 and 9.28 pg, respectively. The fourth group had the genotypes IFT 109, IFT 118, IFT 117, and IFT 258, classified as A. raimundii (10.21 pg), A. plowmanii (10.22 pg), A. jemanii
(10.64 pg),and Anthurium sp. (10.93 pg). The last three groups, with the highest amounts of DNA, were composed of the following isolated genotypes: A. affine (IFT 129) with 13.08 pg, A. gracile (IFT 107) with 21.55 pg and A.bomplandii
(IFT 108)with 22.74 pg.
In the experiment, the DNA content of the plants was determined by flow cytometry, which statistically clustered the genotypes A. raimundii, A. jemanii, A. plowmanii and Anthurium sp. (IFT 258), and also the group of two genotypes
not yet identified: IFT 123 and 255. Furthermore, it confirmed that the cultivars Astral and Rubi (IAC) belong to the same genotypes, which was also observed by Bliss and Suzuki (2012), and isolated A. bomplandii, A. gracile and A. affine from the other genotypes. From a practical point of view, determination of the nuclear DNA content can replace chromosome counting, especially when working with a large number of individuals, as in a germplasm bank (Schifino-Wittmann 2001). In this study, the mean of the coefficient of variation (CV) for the leaf samples ranged between 0.34 and 0.73. These values demonstrate the quality of the results obtained and the reliability of the estimates of DNA content in the genotypes of Anthurium spp. (Table 1). The pea (Pisum sativum) and the bean (Phaseolus vulgaris L.) were used as internal standards in this study and have a 2 C DNA content of 9.09 and 26.09 pg, respectively (Table 1). These standards were selected because their DNA content lies in the middle of the mean value for most plants, and therefore can be used to assess plants with both small and large genomes. Unlike conventional methods, such as chromosome counting or measuring the length of the stomata, flow cytometry is more accurate and faster (Nguyen et al. 2003, Chen et al. 2011).
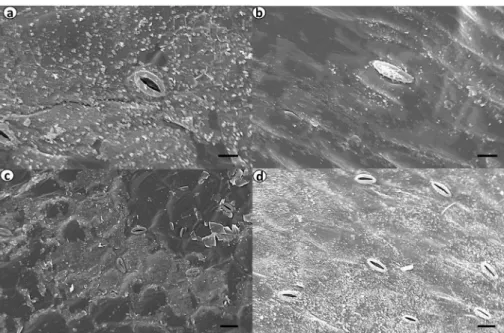
The species of Anthurium have a leaf blade with smooth cuticle, polygonal or irregular epidermal cells, with straight or sinuous anticlinal walls, and stomata on both faces or only on the abaxial face (Figure 1). All Anthurium genotypes s studied in this work showed leaf epidermal cells with straight or wavy walls, corroborating the results obtained by Keating (2002) and Mantovani et al. (2010). The epidermal cells in the leaves are short and have a random distribution. Mantovani et al. (2010) also observed this in a study with nine genotypes of Anthurium. There was, however, an exception as A. bomplandii showed more elongated cells, an important feature to differentiate it from other genotypes.
useful for its identification. In cross-sections, Keating (2002) observed that some genera of Araceae have the outline of the periclinal walls of epidermal cells, as well as the height/width proportion, and considered that these can be used for a taxonomic diagnosis.
Paradermic sections of the abaxial face of leaves are shown in Figure 1, demonstrating that the species have stomata on the abaxial face and are thus classified as hypostomatic leaves. The genotypes A. jemanii, A. affine, A. gracile, A. plowmanii and the hybridare an exception, having stomata on both faces and at a lower density, and are classified as amphihypostomatic (Figure 1). These genotypes also show stomata in the central nerve or in its proximity. This is in agreement with observations by Keating (2002) (Table 2) showing that the leaf of most genotypes of the Araceae family is hypostomatic and the stomata are mainly concentrated on the abaxial surface.
Table 1. DNA quantification for genotypes of Anthurium spp. using flow cytometry
Genotype ScientificName Buffer Standard (pg)*DNA (%)CV Histograms
IFT 128 Hybrid Tris P. vulgaris 4.95 g1* 0.58
IFT 255 Anthurium sp. Marie P. vulgaris 8.60 f 0.48
IFT 123 Anthurium sp. Marie P. vulgaris 8.60 f 0.46
Rubi A. andraeanum Marie P. vulgaris 9.18 e 0.50
Astral A. andraeanum Marie P. vulgaris 9.28 e 0.40
IFT 109 A. raimundii Marie P. vulgaris 10.21 d 0.42
IFT 118 A. plowmanii Marie P. vulgaris 10.22 d 0.34
IFT 117 A. jemanii Marie P. vulgaris 10.64 d 0.73
IFT 258 Anthurium sp. Marie P. vulgaris 10.93 d 0.72
IFT 129 A. affine Marie P. vulgaris 13.08 c 0.48
IFT 107 A. gracile Marie P. vulgaris 21.55 b 0.34
IFT 108 A. bomplandii Tris P. sativum 22.74 a 0.64
Figure 1. Photomicrographs of paradermic sections of the abaxial face of leaves from genotypes of Anthurium spp. a) IFT 108, b) IFT
117, c) IFT 128, d) IFT 123, e) IFT 129, f) IFT 255, g) IFT 107, h) IFT 258, i) IFT 109, j) IFT 118, l) IAC Astral and m) IAC Rubi. Bar 1 mm.
Table 2. Anatomical features of leaves of genotypes of Anthurium spp. Density of the stomata (DS), polar diameter (PD) and
equato-rial diameter (ED) of the stomata and PD/ED ratio, adaxial epidermis (ADE), abaxial epidermis (ABE) and mesophyll (ME) thickness of leaf tissues
Abaxial Epidermis (µm)
Scientific Name Collection Point DS
(mm2) PD ED PD/ED ADE(µm) ABE(µm) (µm)ME
A. raimundii Bahia 17.07a 39.96d 33.41a 1.19c 25.5f 21.2d 216.0e
A. jemanii Pará 15.27a 38.15d 33.48a 1.14c 45.7e 50.3c 508.5c
A. sp. (IFT258) Espírito Santo 13.10b 41.78d 30.86b 1.36b 19.2f 16.0d 182.3f
A. plowmanii Pará 12.71b 43.55b 34.20a 1.27c 43.3e 46.0c 523.2c
A. affine Pernambuco 11.60b 38.30d 28.11c 1.36b 109.5c 112.0b 677.6b
Hybrid Pará 10.80c 40.14c 29.92c 1.34b 118.6b 117.2a 484.5c
A. sp. (IFT123) Pará 10.00c 33.53e 26.00c 1.28c 115.0c 128.8a 716.6b
A. sp.(IFT255) Rio de Janeiro 8.64d 38.45d 27.43c 1.40b 127.0a 100.0b 916.2a
A. sp.(IFT255) Rio de Janeiro 8.64d 38.45d 27.43c 1.40b 127.0a 100.0b 916.2a
A. andraeanum Astral Cultivated 7.71d 38.17d 27.61c 1.38b 37.0e 36.3c 229.2e
A. andraeanum Rubi Cultivated 7.50d 34.35e 27.76c 1.23c 57.1d 48.6c 303.9d
A. bomplandii Amazonas 7.47d2* 43.84b 33.85a 1.29c 118.3b 105.0b 685.1b
A. gracile Paraíba 5.71e 54.58a 34.59a 1.57a 45.1e 40.4c 359.0d
CV % 22.22 9.61 10.68 13.41 16.25 24.47 14.43
All stomata in this study were identified as paracytic brachyfacial, which are characteristic of genotypes of Anthurium
(Mantovani and Pereira 2005, Mantovani et al. 2010). In the stomata of the abaxial face of A. bomplandii, the guard cells are less prominent than the subsidiary cells, which are more elongated, distinguishing this species from the others that have guard and subsidiary cells at the same level.
All species analyzed in this study have stomata flanked on each side by two subsidiary cells and guard cells with chloroplasts, and are classified as brachyparacytic. Most genotypes have epidermal cells with straight or sinuous walls, with the exception of A. andraeanum (Astral and Rubi) that has wavy walls, only on the abaxial face (Figure 1L and M).
Raphides were not found in the species studied although they are frequently found in the Araceae family (Keating 2004). On the other hand, drusen were found in all the species studied, in particular in the genotypes Anthurium bomplandii, A. jemanii, A. gracile and IFT 123, that showed the highest amounts of drusen concentrated in the adaxial face of the leaf blade and main nerve (Figure 2), which can be a distinctive feature for these genotypes.
The presence of small crystals in higher plants is common and is related to physical protection, removal of oxalate from the metabolic system, calcium storage, and regulation of light during photosynthesis in plants that grow in the shade (Franceschi and Nakata 2005). However, the presence, distribution or type of crystal (prismatic, drusen or styloid) can be used as a taxonomic feature. Moraes et al. (2011) suggested that the presence of styloid crystals could be an important feature to identify the genus Psychotria. In the present work, drusen crystals were found in all species studied (Figure 2). According to Keating (2004), the presence of idioblasts with calcium oxalate crystals is a feature of the Araceae family. However, in Anthurium, the cells have independent features and the crystals can occur in the leaf blade, petiole, stem, and root while rhapides are found in all organs. For the genotypes studied in this work, drusen were found only in the main nerve, leaf blade and below the epidermis, which was also observed by Mantovani et al. (2010).
The main nerve can have similar prominence in both faces for the genotypes A. bomplandii, A. jemanii, A. lindmaniarum
× A. guianesis hybrid, Anthurium sp. (IFT 123 and 258), A. raimundii, A. plowmanii, A. andraeanum ‘Astral’ and A. andraeanum ‘Rubi’ (Figure 2A, B andC) or be more prominent in the abaxial face (A. gracile, Figure 2G) or the adaxial
face (A. affine and Anthurium sp. (IFT 255), Figure 2E and F). The genotypes showing the highest prominence of the main nerve was A. affine (Figure 2E), while A. bomplandii, Anthurium sp. (IFT 123) and A. andraeanum Astral showed
the lowest prominence (Figure 2A, D and L, respectively). These results are in agreement with observations by Keating (2003) that the shape of the main nerve is variable. It can be symmetrical, rounded or with a deltoid shape on both
Figure 2. Photomicrographs of cross-sections of leaves from genotypes of Anthurium. a) IFT 108, b) IFT 117, c) IFT 128, d) IFT 123, e)
surfaces, flat or largely concave adaxially, and convex to rounded abaxially.
The mesophyll was uniform, with no significant difference between the palisade and spongy parenchyma. The mesophyll cells showed a compact arrangement in A. lindmaniarum × A. guianesis , Anthurium sp. (IFT 255), A. plowmanii,
A. andraeanum Astral and Rubi, with the exception of A. bomplandii, A. jemanii, Anthurium sp. (IFT 123) , A. affine, A.
gracile, Anthurium sp. (IFT 258) and A.raimundii, in which intercellular spaces were found.
All genotypes showed epicuticular wax deposited on the surface of the cuticle with different shapes. Among others, wax can have the shape of scales (Anthurium spp. – IFT 258), a continuous cover (A. raimundii) or, as in most cases,
granules (A. jemanii, hybrid and all others species studied) (Figure 3). The shape of the wax deposited on the surface of the organs is particular to each genotypes. The wax also acts as a barrier against fungi, bacteria and insects (Appezzato-da-Glória and Carmello-Guerreiro 2012).
The genotypes analyzed in this study show a smooth cuticle on both faces. Similar results were reported by Mantovani et al. (2010), who observed that the unornamented cuticle is a frequent feature in the Araceae family.
Regarding the density of the stomata, the genotypes that showed a highest number of stomata were A. jemanii
and A. raimundii, while A. gracile showed the lowest density of stomata. For the polar and equatorial diameters, A.
gracile showed higher values for both diameters and and also for the ratio between them. The values found for the density of stomata were similar between groups, ranging between 5.71 and 17.07 stomata mm2 (Table 2). In this study,
A. raimundii and A. jemanii had larger stomata while in A. gracile, the stomata were smaller. Larger stomata are usually associated with mesophytic environments, allowing a higher consumption of water (Galmes et al. 2007), and smaller stomata would be found in xeric environments, providing a better water control (Aasamaa et at. 2001).
In the adaxial epidermis, Anthurium sp. (IFT 255) showed greater epidermal thickness than the other genotypes and also showed a greater thickness of the mesophyll (916.2 µm). However, in the abaxial epidermis, A. lindmaniarum
× A. guianesis hybrid and Anthurium sp. (IFT 123) showed the greatest thickness. Anthurium raimundii and IFT 258 had similar values for both faces (adaxial and abaxial), showing the lowest values for the epidermal thickness. The Anthurium
sp. (IFT 258) showed the smallest thickness of the mesophyll with a value of 182.3 µm (Table 2).
Figure 3. Scanning electron micrographs of the epidermis of the adaxial face of leaves of genotypes of Anthurium spp., showing the
different types of wax. a) and b) Epicuticular wax in the shape of granules in A. jemanii and A. lindmaniarum × A. guianesis. Bar 20
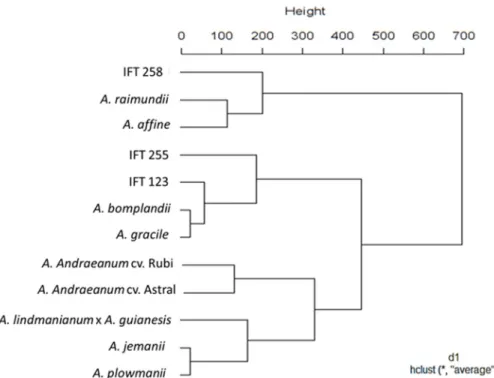
According to the dendrogram obtained following cluster analysis (Figure 4), the individuals can be divided into three groups considering the mean Euclidean distance (450), with several subgroups.
Cluster analysis grouped the genotypes A. raimundii and A. affine, A. bomplandii and A. gracile, and A. jemanii and A.
plowmanii, and isolated the hybrid, one of the few genotypes that does not have a large amount of wax in the epidermis. The IFT 258, a genotypesnot yet identified, was clustered with the branch containing the genotypes A. raimundii and A.
affine. The other two unidentified genotypes, IFT 123 and 255, were clustered with A. bomplandii and A. gracile. This data confirms that the unidentified genotypes belong to the same section of these.
We also observed that A. andraeanum, represented by the cultivars Astral and Rubi, is closely related to the rest of species examined in the current study. Such results reinforce the potential of anatomical and cytometric analysis for clustering and differentiating genotypes.
Anatomical data and DNA content were helpful for species identification and grouping through cluster analysis. Using cluster analysis of anatomical features of the leaf and spathe, Mantovani et al. (2010) reinforced the importance of clustering in the diagnosis of genotypes belonging to Anthurium.
Thus, knowledge of the genetic makeup of access of several species is important to enrich the knowledge of researchers and producers from around the world (Hornung-Leoni et al. 2013).
CONCLUSIONS
Anatomical studies clustered the genotypes A. andraeanum (Astral and Rubi) and distinguished the hybrid (A. lindmanianum × A. guianesis) and A. bomplandii from the other genotypes, with anatomical features specific to each.
Differences in DNA content, assessed by flow cytometry, allowed the differentiation between the genotypes A.
andraeanum, A. affine, A. bomplandii,and A. gracile and the hybrid(A. lindmaniarum × A. guianesis) and clustered the group A. raimundii, plowmanii and jemanii of Anthurium sp. (IFT 258), in all analyses.
Figure 4. Dendrogram obtained considering the mean Euclidean distance in the similarity analysis of anatomical features and DNA
Cluster analysis allowed grouping of the genotypes A. raimundii and A. affine, A. bomplandii and A. gracile, A.
jemanii and A. plowmanii, and the cultivars Astral and Rubi (A. andraeanum), and isolated the hybrid(A. lindmaniarum × A. guianesis).
ACKNOWLEDGMENTS
To EMBRAPA (CNPAT) for the seedlings, to the National Council for Scientific and Technological Development (CNPq) for funding and to the Coordination for the Improvement of Higher Education Personnel (CAPES) for the fellowship.
REFERENCES
Aasamaa K, Sober A and Rrabi M (2001) Leaf anatomical characteristics associated with shoot hydraulic conductance, stomatal conductance and stomatal sensitivity to changes of leaf water status in temperate deciduous trees. Australian Journal of Plant Physiology28: 765-774.
Alves E (2006) Introdução à microscopia eletrônica. UFLA/FAEPE, Lavras,
88p.
Appezzato-da-Glória B and Carmello-Guerreiro SM (2012) Anatomia vegetal. Editora UFV, Viçosa, 404p.
Bliss BJ and Suzuki JY (2012) Genome size in Anthurium evaluated in the context of karyotypes and phenotypes. AoB PLANTS006: 1-15.
Chen C, Hou X, Zhang H, Wang G and Tian L (2011) Induction of Anthurium andraeanum ‘‘Arizona’’ tetraploid by colchicine in vitro. Euphytica 181: 137-145.
Coelho MAN and Catharino ELM (2008) Duas espécies novas de Anthurium (Aracea) endêmicas do litoral de São Paulo, Brasil. Rodriguésia 59: 829-833.
Dickinson B (1998) Cell quest software: reference manual. Becton
Dickinson Immunocytometry Systems, San Jose, 227p.
Dolezel J and Bartos J (2005) Plant DNA flow cytometry and estimation of nuclear genome size. Annals of Botany95: 99-110.
Dolezel J, Binarova P and Lucretti S (1989) Analysis of nuclear DNA content in plantcells by flow cytometry. Biol Plantarum31: 113-120.
Franceschi VR and Nakata PA (2005) Calcium oxalate in plants: Formation and fuction. Annual Review of Plant Biology56: 41-71.
Galmes J, Flexas J, Savé R and Medrano H (2007) Water relations and stomatal characteristics of Mediterranean plants with different growth forms and leaf habits: responses to water stress and recovery.
Plant Soil290: 139-155.
Guedes TA (2002) Introdução ao controle da qualidade. Melhoria
contínua da qualidade. UEM/DES, Maringá, 84p.
Hornung-Leoni CT, Sosa V, Simpson J and Gil K (2013) Genetic variation in the emblematic Puya raimondii (Bromeliaceae) from Huascarán National Park, Peru. Crop Breeding and Applied Biotechnology 13: 67-74.
Karnovsky MJ (1965) A formaldehyde-glutaraldehyde fixative of high osmolality for use in electron microscopy. Journal of Cell Biology 27: 137-138.
Keating RC (2002) Anatomy of the monocotyledons: IX Araceae and
Acoraceae. Clarendon Press, Oxford, 322p.
Keating RC (2003) Leaf anatomic characters and their value in understanding morphoclines in the Araceae. The Botanical Review 68: 510-523.
Keating RC (2004) Vegetative anatomical data and its relationship to a revised classification of the genera of Araceae. Annals of the Missouri Botanical Garden91: 485-494.
Kraus JE and Arduin M (1997) Manual básico de métodos em morfologia vegetal. UFRRJ, Rio de Janeiro, 198p.
Lorenzo N, Mantuano DG and Mantovani A (2010) Comparative leaf ecophysiology and anatomy of seedlings, young and adult individuals of the epiphytic aroid Anthurium scandens (Aubl.) Engl.
Environmental and Experimental Botany68: 314-322.
Loureiro J and Santos C (2004) Aplicação da citometria de fluxo ao estudo do genoma vegetal. Boletim de Biotecnologia 77: 18-29. Mantovani A, Filartiga LDP and Coelho MAN (2010) Anatomia comparada
da folha e espata de espécies de Anthurium (Araceae) ocorrentes na Mata Atlântica Revista Brasileira de Botânica 33: 185-200.
Mantovani A and Pereira TE (2005) Comparative anatomy of leaf and spathe of nine species of Anthurium (section urospadix; subsection flavescentiviridia) (araceae) and their diagnostic potential for taxonomy. Rodriguésia56: 145-160.
Moraes TMS, Rabelo GR, Alexandrino CR, Neto SJS and Cunha M (2011) Comparative leaf anatomy and micromorphology of Psychotria species (Rubiaceae) from the Atlantic Rainforest. Acta Botanica Brasilica25: 178-190.
Nguyen XD, Eichler H, Dugrillon A, Piechaczel C, Braun M and Kluter H (2003) Flow cytometric analysis of T cell proliferation in a mixed lymphocyte reaction with dendritic cells. Journal of Immunological Methods275: 57-68.
R Development Core Team (2011) R: A language and environment for statistical computing. Vienna, R Foundation for Statistical Computing. Avaliable at <http://www.R-project.org>. Accessed in jan, 2012. Schifino-Wittmann MT (2001) Determinação da quantidade de DNA
nuclear em plantas. Ciência Rural 31: 897-902.
Tillich HJ (2003) Seedling diversity in Araceae and its systematic implications. Feddes Repertorium 114: 454-487.
Trotter J (2000) WinMDI©: version 2.8. La Jolla, The Scripps Research