Influence of Ethanol Concentration, Addition of Spices
Extract, and Level of Sweetness on Physico-chemical
Characteristics and Sensory Quality of Apple Vermouth
Vinod K. Joshi
1* and Danwant K. Sandhu
2Department of Post-harvest Technology, Dr YS Parmar University of Horticuture & Forestry, Nauni, Solan (HP) 173 230, India;Department of Microbiology, Guru Nanak Dev University, Amritsar India
ABSTRACT
The composition of apple base wine was found to be suitable for conversion into vermouth. The spices extract contained more TSS, tannins, esters, volatile acid but lower titrable acid than apple base wine. To optimize and develop apple vermouth with different ethanol concentrations (12%, 15%, 18%), sugar content (4%, 8%) and spices extract (2.5% and 5.0 %) was prepared and was evaluated. Significant differences in physico-chemical characteristics and sensory quality amongst the vermouths having different levels of alcohol, sugar and spices extract were noted. Generally, increasing ethanol content decreased titrable acidity, tannins, macroelements and colour units while micro -elements, viscosity and total esters were increased. Increased sugar level affected TSS, apparent viscosity, pH, esters, free aldehyde, total sugar, K, Cu and Mn contents. Level of spices extract (2.5 & 5.0) did not effect TSS (oB), titrable acidity, colour, total sugar, total tannins, volatile acidity, increased mineral contents except for K, esters and aldehyde contents. Increase in alcohol content upto 15% increased the sensory score of the product. Increased quantity of spices extract, however, decreased the mean sensory quality of vermouth. However, sensory scores for 4 or 8% sugar and 2.5 or, 5.0% spices extracted were similar. A product with 15% alcohol, 4% sugar and 2.5% spices extract was preferred the most in overall sensory quality. The studies revealed that apple fruit is suitable for making vermouth by the method described. The spices, herbs, their parts and the quantities used are also reported.
Key words: apple, vermouth, ethanol spices extract, sweetness, esters, quality, base wine, mineral, sensory
INTRODUCTION
Aperitif wine known as `Vermouth’ is prepared from grape wine by adding mixture of herbs and spices or their extract. These type of wines are quite popular in many European countries and USA. Aperitif or aromatised fruit wines are produced commercially in USSR and Poland (Jarczyk and Wzorck, 1977). Method of preparation and quality characteristics of grape vermouth is well established (Wright, 1960; Amerine et al., 1980). Vermouths having acceptable sensory qualities have also been made and evaluated from mango, plum and sand pear (Onkarayya, 1985; Joshi et al., 1991; Joshi et al., 1998). The apple based alcoholic beverages, which can be prepared and are quite popular include cider, wine and brandy (Amerine et al., 1980; Sandhu and Joshi, 1995; Joshi, 1997). As a diversification of apple based beverages another product of apple vermouth similar to
grape vermouth can be prepared. Both chemical and sensory qualities of such alcoholic beverages like vermouth is influenced by the alcohol concentration, quantity and type of spices extract added and the final sugar concentration in the product. In the preparation of vermouth, addition of spices/herbs extract increased the total phenols, aldehyde and ester content in plum vermouth (Amerine et al., 1980; Joshi et al., 1991). However, no published information seems to be avaialble on apple vermouth. Results obtained on the effect of different levels of ethanol, spices extract and sugar on the physico-chemical characteristics and sensory quality of apple vermouth have been discussed in this paper.
MATERIALS AND METHODS
conditions standardized earlier (Amerine et al., 1980; Joshi, 1995). Apple juice concentrate of 72oB was diluted with hot water (80oC) in 1:3 ratio, resulting in a TSS of 24oB. Pactin esterase enzyme `Pectinol’ was used for clarification of the wine as standardized earlier (Joshi and Bhutani, 1991). Diammonium hydrogen phosphate was added at the rate of 0.1% to the must along with 100 ppm sulphur dioxide to the must. The base wine was matured for a period of three months prior to its conversion into vermouth.
Apple vermouth: Vermouths with 3 levels of alcohol (12, 15 and 18% v/v) were prepared. Each alcohol level had either 4 or 8 per cent sugar content. Different combinations of products were prepared having 2.5 or 5 per cent (v/v) spices extract in each sugar and alcohol levels. Spices and herbal extracts were prepared in the similar manner as for plum and sand pear vermouth (Joshi
et al., 1991; Attri et al., 1994; Joshi, 1995). The name of spices and herbs, their parts and quantities used are presented in Table 1. The extraction was made in a mixture of apple base wine and apple brandy (60%) mixed in 1:1 ratio. Ethanol content of vermouth of various treatments was increased by addition of apple brandy made by distilling apple wine in a laboratory glass distillation apparatus (Amerine et al., 1980). Vermouth prepared was filtered again and 100 ppm of potassium metabisulphite was added and the product was bottled.
Physico-chemical analyses: Vermouth of different treatments was analysed for various physico-chemical and sensory characteristics. The TSS (oB), titrable acidity (% M.A.), pH, total sugars (%) and tintometer colour units were estimated by the standard methods (Ranganna, 1986). Colour was measaured with a tintometer and expressed as units of tintometer (TCU) in terms of red, yellow and blue colour units. Apparent viscosity of the vermouths was estimated as flow per unit time relative to water (Ranganna, 1986). Ethanol was estimated by colorimetric method (Caputi et al., 1996). Mineral contents were determined by Perkin Elmer spectrophotometric method with appropriate dilution of the sample as reported earlier (Bhutani
et al., 1989 and Bhutani and Joshi,1996). Tannin, esters, total aldehyde and volatile acidity were quantified by the prescribed method (Amerine et al., 1980).
Sensory evaluation: The sensory analysis of vermouth of different treatments was carried out on the weighted proforma described by Amerine et al. (1980). Efforts were made to get the unbiased judgement for each attributes with specific scores. The wine was served in tulip shaped wine glasses covered with glass dishes in a coded manner. The scores awarded to each wine were added to get the respective scores out of 20. In all, 10 judges participated in the sensory evaluation.
Statistical analysis: The analysis of variance of the data from physico-chemical characteristics was carried out by CRD (Cochran and Cox, 1963) by 3 factor design with alcohol levels, sugar concentration and quantity of spices extract. The mean values with critical differences have been presented. The data of sensory evalutation were analysed by RBD as per the standard procedure (Mohony, 1985).
RESULTS AND DISCUSSION
Apple base wine and spices extract: The composition of apple base wine (Table 2) revealed that it had residual sugar, desirable titratable acidity, low amount of aldehyde, good clarity (shown by transmittance value), low volatile acidity, medium amount of tannin and total esters. A reference to the published information on grape base wine showed it to be quite comparable with apple base wine (Table 2) and within the essential requirements of a base wine for conversion into a vermouth (Goswell and Kunkee, 1977). Besides, the apple wine was sound and with medium alcohol contents, thus suitable for conversion into vermouth.
earlier in case of grape, plum and sand pear vermouths that tannin, aldehyde and esters are contributed by the herbs/spices extract (Amerine et al., 1980; Joshi et al., 1991; Attri et al., 1994). A comparison of tannin content of base wine (Table 2) with vermouth of different treatments consequently showed an increase in latter. Tannins are important in endowing the wine with desirable astringency (mouth-puckering property) and their increase might have added to this property of wine. Compared to the base wine, the macro-elements viz. K, Mg, Na and Ca declined while micro-elements like Cu, Zn and Mn increased except Fe.
Physico-chemical characteristics of vermouth
Effect of ethanol: The increase in ethanol concentration did not effect TSS and titrable acidity but decreased the sugar content and colour values significantly (Table 3). A small contribution to the TSS of the vermouth compared to the base wine might have been made by the brandy added to increase the alcohol as stated earlier. However, ethanol addition
significantly
affected the pH values of vermouth of
different treatments and the changes were in
consistance with those of titrable acidity.
Both titrable acidity and pH of the
vermouth prepared from different fruits are bound to be different (Amerine et al., 1980; Joshi et al., 1991; Attri et al., 1994). Nevertheless, the pH remained sufficiently acidic to prevent the occurrence of spoilage. Generally, addition of ethanol content of vermouth increased the aldehyde and ester contents. The amount of tannin however, showeda significant decreasing trend with increase in ethanol concentration. The volatile acidity values decreased non-significantly (Table 3) and were less than the legal limit for the wine (Amerine et al., 1980) and are lower than that reported for mango vermouth (Onkaryya, 1985). Lower volatile acidity is desirable, indicating soundness of alcoholic fermentation and absence of any acetification.
In general, the macro-elements like K, Mg and Ca decreased as ethanol concentration was increased. However, for Na the differences were not significant. The data on micro-elements (Table 3) further showed that the addition of alcohol increased Cu (mightbe due to more extraction by ethanol), reduced Mn content and did not affect Zn levels in the vermouths of different treatments. The mineral composition of the vermouth has clearly shown the presence of K, Na, Mg, Ca, Cu, Mn, Zn and Fe contents, though their quantities were variable. After determination of macro and micro-nutrients of quinine and aperitif wines, Zepata et al. (1988) observed that K was found in the largest proportion. Similar trend for Na was observed earlier also. The difference in mineral content of the vermouths of variable ethyl alcohol is apparently the result of dilution by addition of branady (to raise the alcohol content) or the addition of spices extract when compared to the base wine. But these changes in apple vermouth are not high as was the case of plum or sand pear vermouth reported earlier (Bhutani and Joshi, 1996). However, irrespective of these changes, the composition of vermouth still remained within the desirable limits from enological and nutritional point of view.
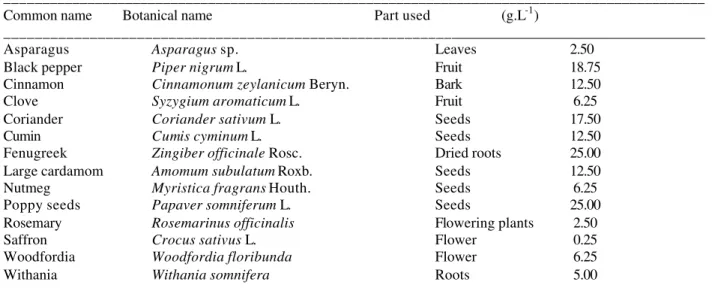
Table 1 - Spices/herbs used in apple vermouth preparation
_____________________________________________________________________________________________ Common name Botanical name Part used (g.L-1)
_____________________________________________________________________________________________
Asparagus Asparagus sp. Leaves 2.50
Black pepper Piper nigrum L. Fruit 18.75
Cinnamon Cinnamonum zeylanicum Beryn. Bark 12.50
Clove Syzygium aromaticum L. Fruit 6.25
Coriander Coriander sativum L. Seeds 17.50
Cumin Cumis cyminum L. Seeds 12.50
Fenugreek Zingiber officinale Rosc. Dried roots 25.00
Large cardamom Amomum subulatum Roxb. Seeds 12.50
Nutmeg Myristica fragrans Houth. Seeds 6.25
Poppy seeds Papaver somniferum L. Seeds 25.00
Rosemary Rosemarinus officinalis Flowering plants 2.50
Saffron Crocus sativus L. Flower 0.25
Woodfordia Woodfordia floribunda Flower 6.25
Withania Withania somnifera Roots 5.00
Table 2 - Composition of apple base wine and spices extract used in vermouth preparation
_____________________________________________________________________________
Parameters Apple base wine Spices extract
(Mean + S.D.) (Mean + S.D.)
____________________________________________________________________________________________
Total soluble solids (oB) 10.00 + 0.05 15 + 0.5
Titrable acidity (% MA) 0.42 + 0.02 0.30 +0.002
Total sugar (%) 2.94+ 0.02 ND
Tannin (mg/L) 228 + 6 1142 + 16
Total esters (mg/L) 187 + 2 934 + 20
pH 3.53 + 0.05 ND
Transmittance (%) 97 + 1.00 ND
Ethanol (% v/v) 12.80 + 0.3 58 + 2
Volatile acidity (% A.A) 0.038 + 0.001 0.075 + 0.002
Free aldehyde (mg/L) 44 + 0.2 ND
Colour (units)
Red 2.8 + 0.01 10.2 + 0.6
Yellow 10.6 + 0.03 40.0 + 2.0
Minerals
Potassium (mg/L) 2160 + 12 1570 + 20
Calcium (mg/L) 90 + 2 76 + 2
Magnessium (mg/L) 72 + 3 59 + 1
Sodium (mg/L) 62 + 2 47 + 0.5
Copper (mg/L) 0.09 + 0.01 0.15 + 0.01
Manganese (mg/L) 1.20 + 0.01 2.67 + 0.02
Zinc (mg/L) 0.12 + 0.01 6.29 + 0.02
Ferrous (mg/L) 1.21 + 0.01 0.26 + 0.001
____________________________________________________________________________________________ SD = Standard deviation; ND = Not determined
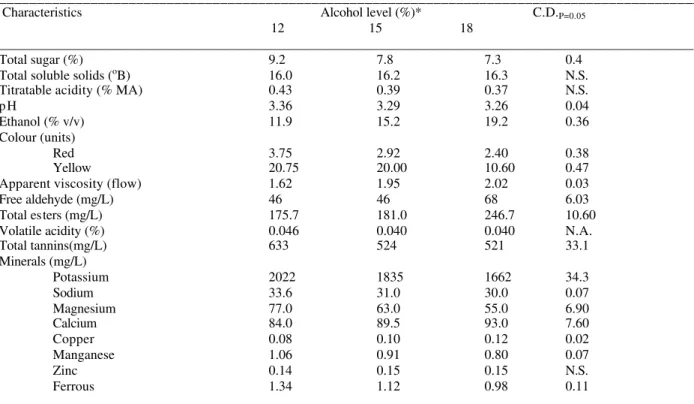
Table 3. Physico-chemical characteristics of apple vermouth of different levels of alcohol
____________________________________________________________________________________________
Characteristics Alcohol level (%)* C.D.P=0.05 12 15 18
_______________________________________________________________________________________________________
Total sugar (%) 9.2 7.8 7.3 0.4
Total soluble solids (oB) 16.0 16.2 16.3 N.S.
Titratable acidity (% MA) 0.43 0.39 0.37 N.S.
p H 3.36 3.29 3.26 0.04
Ethanol (% v/v) 11.9 15.2 19.2 0.36
Colour (units)
Red 3.75 2.92 2.40 0.38
Yellow 20.75 20.00 10.60 0.47
Apparent viscosity (flow) 1.62 1.95 2.02 0.03
Free aldehyde (mg/L) 46 46 68 6.03
Total esters (mg/L) 175.7 181.0 246.7 10.60
Volatile acidity (%) 0.046 0.040 0.040 N.A.
Total tannins(mg/L) 633 524 521 33.1
Minerals (mg/L)
Potassium 2022 1835 1662 34.3
Sodium 33.6 31.0 30.0 0.07
Magnesium 77.0 63.0 55.0 6.90
Calcium 84.0 89.5 93.0 7.60
Copper 0.08 0.10 0.12 0.02
Manganese 1.06 0.91 0.80 0.07
Zinc 0.14 0.15 0.15 N.S.
Ferrous 1.34 1.12 0.98 0.11
Table 4. Physico-chemical characteristics of apple vermouth of different levels of sugar
____________________________________________________________________________________________________
Characteristics Sugar (%)* C.D.P=0.05
4 8
____________________________________________________________________________________________________
Total sugar (%) 5.9 10.1 0.3
Total soluble solids (oB) 36.9 18.4 0.3
Titratable acidity (% MA) 0.41 0.39 NS
pH 3.31 3.28 0.03
Ethanol (% v/v) 15.4 15.5 NS
Colour (units)
Red 3.13 2.91 NS
Yellow 17.37 16.87 NS
Apparent viscosity (flow) 1.80 1.92 0.02
Free aldehyde (mg/L) 49.00 57.00 4.90
Total esters (mg/L) 198.0 210.5 8.6
Volatile acidity (%) 0.041 0.043 NS
Total tannins(mg/L) 581 524 -
Minerals (mg/L)
Potassium 1806 1885 28.0
Sodium 31.8 31.2 NS
Magnesium 67.0 62.0 NS
Calcium 90.0 88.0 NS
Copper 0.10 0.09 0.01
Manganese 1.05 0.83 0.06
Zinc 0.15 0.14 NS
Ferrous 1.11 1.17 NS
____________________________________________________________________________________________________ *Means are irrespective of alcohol and spices extract level
Table 5. Physico-chemical characteristics of apple vermouth of different levels of spices extract
____________________________________________________________________________________________________
Characteristics Spices extract (%)* C.D.P=0.05
2.5 5.0
____________________________________________________________________________________________________
Total sugar (%) 7.9 8.8 NS
Total soluble solids (oB) 16.3 16.1 NS
Titratable acidity (% MA) 0.40 0.39 NS
pH 3.33 3.29 0.03
Ethanol (% v/v) 15.4 15.3 NS
Colour (units)
Red 3.13 2.91 NS
Yellow 16.9 17.4 NS
Apparent viscosity (flow) 1.77 1.94 0.02
Free aldehyde (mg/L) 50 57 4.9
Total esters (mg/L) 173.3 228.8 8.6
Volatile acidity (%) 0.043 0.042 NS
Total tannins (mg/L) 558 561 NS
Minerals (mg/L)
Potassium 1826 1858 28.1
Sodium 31.5 31.5 NS
Magnesium 63.8 65.8 NS
Calcium 87.6 89.6 NS
Copper 0.10 0.10 NS
Manganese 0.90 0.93 0.06
Zinc 0.15 0.14 NS
Ferrous 1.13 1.16 NS
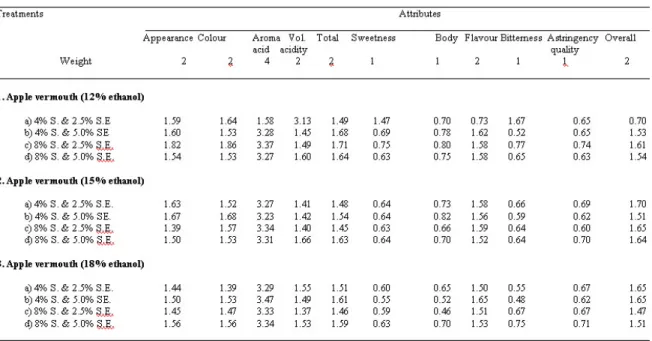
Table 6. Comparison of mean sensory quality attributes of apple vermouth of different treatments
Table 7. Comparison of total sensory score of apple vermouth of different treatments
_________________________________________________________________________________________________
Treatments Score Mean for
(20) Ethanol Sugar Spices
level extract
_________________________________________________________________________________________________
1. Apple vermouth (12% ethanol)
a) 4% S. & 2.5% S.E. 15.34
b) 4% S. & 5.0% SE. 15.19
c) 8% S. & 2.5% S.E. 15.28 15.09
d) 8% S. & 5.0% S.E. 14.54
2. Apple vermouth (15% ethanol)
a) 4% S. & 2.5% S.E. 16.39
b) 4% S. & 5.0% SE. 15.26 15.19 15.31
c) 8% S. & 2.5% S.E. 15.36 15.39
d) 8% S. & 5.0% S.E. 14.54
3. Apple vermouth (18% ethanol)
a) 4% S. & 2.5% S.E. 15.53
b) 4% S. & 5.0% SE. 15.12 15.17 15.15
c) 8% S. & 2.5% S.E. 14.37 15.11
d) 8% S. & 5.0% S.E. 15.14
_______________________________________________________________________________________________________
CD (p=0.05) = 0.9 S = Sugar, S.E. = Spice extract
Effect of sugar level: The results (Table 4) showed significant differences in the TSS (oB) and total sugar content of the vermouth, and the increase was proportional to the amount of sugar added in two types of vermouth. Significant differences in the TSS of base wine and vermouth from plum fruits has also been reported earlier (Joshi et al., 1991). Different sugar levels
view the acid content these values seem to be compatible. A reference to the titratble acidity of plum vermouth showed significant differences among the different products (Joshi et al., 1991). Absence of such drastic differences in apple vermouth compared to its base wine is ascribed to the use of lower volume of spices extract than that used in plum vermouth which might have diluted the acid more in plum than apple vermouth.
There were significant differences in pH values of vermouths prepared by the addition of different sugar content which could be correlated with their respective acid contents. Apparent viscosity was effected significantly by increasing the sugar concentration in the final product which correlated with sugar concentration used in vermouth preparation. According to Burnes and Noble (1985), the increase in perceived viscosity caused by addition of sucrose arose from approximately equaly contribution of physical viscosity and sweetness. Similar increase in viscosity in the product with 8% sugar and a decrease in perceived bitterness of vermouth must have taken place in the present study also. Added sugar contents increased the free aldehyde and ester content significantly. Invariably, a sweeter product contained more aldehyde than the corresponding dry product. Differences in aldehyde content of vermouth due to the addition of sugar might be the result of formation of compounds like furfuraldehyde or the addition of brandy to raise the alcohol content of the vermouth as it is one of the constituents of the distillates, and might have contributed to the amount of free aldehyde estimated here.
Increasing the quantity of sugars from 4 to 8 per cent in the vermouth increased the K content. However, Ca and Mg remained uneffected by the increase in sugar level. In general, the macroelements decreased with addition of sugar syrup used. The data on micro-elements (Table 4) revealed that the Cu content was increased significantly by sugar levels but significantly reduced Mn content without affecting the Fe and Zn content. Addition of increased quantity of sugar (4 to 8%) might not have effected to the same extent the mineral composition of apple vermouth as was the case with plum or sand pear vermouth (Joshi et al., 1991, Attri et al., 1994).
Effect of spices extract : Spices level (2.5 & 5%) did not alter the TSS(oB), total sugar, titrable
acidity, colour and total tannins and ethanol content of apple vermouth (Table 5) but there were significant differences in pH value and apparent viscosity of vermouth. The addition of spices extract did not significantly influence the colour (lovibond colour units). Similar to our findings on apple vermouth, no significant difference in colour values of the plum vermouth have been observed earlier (Joshi et al., 1991). Although, no information on apple vermouth is available, yet in grape vermouth, processing and storage were found to contribute more to the process of darkening than the spices extract addition (Wright, 1980). Absence of blue colour units further showed brightness of the product. This is desirable as clarity and attractiveness of the product did not decrease due to the addition of spices extract.
With the increase in concentration of spices extract, quantities of free aldehyde and ester increased. A comparison of the ester content of base wine and apple vermouth with that of spices extract clearly revealed that the latter has contributed to the ester content of vermouth in the similar manner as reported for plum vermouth (Joshi et al., 1991) and is desirable from sensory quality point of view. Besides, it also indicates a satisfactory maturation process which the product has undergone. From the results (Table 5), it is clear that the increase in aldehyde content took place due to the addition of spices extract in both mango and plum vermouths (Onkaryya, 1985; Joshi et al., 1991). The spices extract is known to contribute organic compounds such as aldehyde, esters and tannins to the vermouth (Amerine et al., 1980). This is further corroborated with the composition of spices extract (Table 2).
With increased quantity of spices extract the quantity of K was increased but the quantities of Ca, Mg, Cu, Mn and Fe were not significantly effected (Table 5). A comparison of mineral contents of the base wine and the composition of spices extract (Table 2) clearly reveals that the spices extract generally diluted the macroelements and increased the microelements like Cu, Mn and to some extent Zn. But the extent of dilution of mineral content due to the addition of spices extract in apple vermouth was lower than plum or sand pear vermouth (Joshi et al., 1991; Attri et al., 1994).
vermouths prepared with different ethanol concentrations, sugar levels and spices extract showed significant differences for various sensory quality parameters. The data (Table 6 ) revealed that for colour and appearance, generally 12% and 15% alcohol with 2.5% spices extract scored better but for aroma, virtually all the treatments were comparable. However, in total acidity vermouth with 18% ethanol scored lower than those with 12% and 15%. In bitterness and astringency, vermouths of all the treatments were comparable. In overall quality, apple vermouth with 15% ethanol, 2.5% spices extract and 4% sugar content scored the highest.
The sum of scores of different attributes for each treatment (Table 7) clearly reveal that the highest score has been awarded to the product with 15% alcohol contents . In an earlier finding, sweet products with 15% alcohol were considered the best for plum and sand pear vermouth (Joshi et al., 1991; Attri et al., 1994). Irrespective of concentration of the sugar and quantity of spices extract used, the scores remained the same. However, the sugar concentration of 4% was preferred to 8%. The scores for sensory quality of apple vermouth of all the treatments were more than 12 which showed quite high acceptability ratings of the product. Since there was not much difference for the scores of vermouth with spices levels of 2.5% and 5.0%, the lower quantity was preferred. The alcohol content of grape vermouth ranged from 14 to 22 per cent (Amerine et al., 1980) while for sand pear and plum vermouth, products with 15% alcohol content scored the best (Joshi et al., 1991; Attri et al., 1994). Similar results on apple vermouth have been obtained here.
The apple vermouth of 15% alcohol, 4% sugar and 2.5 spices extract must have made a better blend than other combinations tried and hence, higher acceptability. Higher sugar, more alcohol and higher quantities of spices extract might have made the product less acidic, more strong and more aromatic/flavoured and sweeter, thereby lowering its acceptability. Since the acid content of the base wine was kept the same its adjustment could have increased the acceptability of products with high alcohol or sugar contents. But increase in acid content in the apple vermouth with more sugar and alcohol levels might result in higher sensory acceptability by the judges. In a trial (data not shown), it was observed that increasing the acidity of product by addition of citric acid to
0.65% increased considerably the acceptability of product having 2.5% spices extract with 18% alcohol and 8% sugar. Masking effect of sugar on other sensory parameters might have influenced the sensory qualities of vermouth.
CONCLUSIONS
It was concluded that variations in the alcohol, sugar level and spices extract concentration effected the physico-chemical and sensory qualities of apple vermouth. However, the composition of the selected product remained within the desirable range of such type of products. The apple base wine is suitable for conversion into apple vermouth. Further, product with more alcohol content (18%) than 15% and sugar level of more than 4% could also be prepared by increasing the acid contents of the product (0.65 %). Product holds promise for commercialization in view of high sensory acceptabilities.
RESUMO
15% se obteve escores superiores na avaliação sensorial. Uma elevação na concentração de especiarias contribui para diminuir a qualidade sensorial do vermute. Porém, pontuações sensoriais semelhantes foram obtidas em formulações contendo de 4 - 8% açúcar e 2.5 - 5.0% especiarias. Um produto contendo 15% álcool, 4% açúcar e 2.5% extrato de especiarias foi preferido com relação aos demais pelas suas qualidade sensoriais superiores. Os estudos revelaram que a maçã é considerada uma fruta satisfatória para a fabricação de vermute pelo método descrito. Também são informadas as especiarias, ervas, bem como as quantidades utilizadas.
REFERENCES
Amerine, M.A.; Berg, H.W.; Kunkee, R.E.; Qugh, C.S.; Singleton, V.L. & Webb, A.D. (1980), The Technology of Wine Making, 4th edn. AVI Publishing Co., Inc. Westport, CT.
Attri, B.L.; Kaushal, B.B.L. & Joshi, V.K. (1994), Preparation and evaluation of sand pear vermouth. J. Food Sci. Technol., 30(6) : 435-437.
Bhutani, V.P.; Joshi, V.K. & Chopra, S.K. (1989), Mineral contents of the fruit wines produced experimentally. J. Food Sci. Technol., 26(6) : 332-333.
Bhutani, V.P. & Joshi, V.K. (1996), Mineral composition of experimental sand pear and plum vermouth. Alimentaria, 272 : 99-103.
Burns, D.J.W. & Noble, A.C. (1985), Evaluation of the separate contribution of viscosity and sweetness of sucrose to perceived viscosity, sweetness and bitterness of vermouth. J. Text. Studies, 16 : 365-381. Caputi, A.JR.; Ueda, M. & Brown, J. (1968),
Spectrophotometeric determination of ethanol in wine. Am. J. Enol. Vitic., 19 : 160-165.
Cockrane, W.G. & Cox, G.M. (1963), Experimental Designs, 14th edn, 613 p., Asia Publishing House, Bombay.
Gosswell, R.M. & Kunkee, R.E. (1977), Fortified wines. In Rose, A.H. (ed.) : Alcoholic Beverages, 477-535 pp., Academic Press, London.
Jarczyk, A. & Wzorek, W. (1977), Fruit and Honey Wines. In Rose A.H. (ed.) : Alcoholic Beverages, 387-421. Academic Press, London.
Joshi, V.K. & Bhutani, V.P. (1991), The influence of enzymatic clarification on the fermentation behaviour and sensory qualities of apple wine. Sci. Des. Aliments, 11 : 491-498.
Joshi, V.K.; Attri, B.L. & Mahajan, B.V.C. (1991), Production and evaluation of vermouth from plum fruits. J. Food Sci. Technol., 28 : 138-141.
Joshi, V.K. (1997), Fruit Wines. 255 p. 2nd End. Directorate of Extension Education, Dr YS Parmar University of Horticulture & Forestry, Solan (HP), India.
Mohony, O.M. (1985), Sensory Evaluation of Food Statistical Methods and Procedures. pp. 168-169. Marcel Dekker, Inc., New York.
Joshi, V.K.; Sandhu, D.K. and Thakur, N.S. (1998), Technology of fruit based alcoholic beverages. In V.K. Joshi and Ashok Pandey (eds) Biotechnology : Food Fermentation. Vol. II Educational Publishers and Distributors, New Delhi pp. 647-744.
Onkarayya, H. (1985), Mango Vermouth - A new alcoholic beverages. Indian Food Packer, 39(1) : 40-45.
Ranganna, S. (1986), Handbook of Analysis and Quality Control for Fruits and Vegetables Products. 2nd edn. Tata McGraw Hill, New Delhi.
Sandhu, D.K. & Joshi, V.K. (1995), Technology, quality and scope of fruit wines with special reference to apple. Indian Food Industry, 14 (1): 24-34.
Wright, D. (1960), Factors affecting the colour of dry vermouth. Am. J. Enol. Vitic., 11 : 30-34.
Zapata, R.M.A.; Diez Marques, C. & Garciamata, Y.M. (1988), Contenido do en elementos minerales, en vinos aromatizados. Alimentaria, 197 : 67-69.
Zapata, M.A.; Villanueva, M.J. & Redondo, A. (1989). Contenido do en elementos minerales, en vinos aromatizados III. Vermuts rojos. Alimentaria, 198 : 61-65.