Article
J. Braz. Chem. Soc., Vol. 22, No. 5, 929-935, 2011. Printed in Brazil - ©2011 Sociedade Brasileira de Química
0103 - 5053 $6.00+0.00
A
*e-mail: [email protected]
Antioxidant Activity and Composition of Propolis Obtained by Different
Methods of Extraction
Solange M. Cottica,*,a Alexandra C. H. F. Sawaya,b,c Marcos N. Eberlin,b
Selma L. Franco,d Lucia M. Zeoulae and Jesuí V. Visentainera
aDepartment of Chemistry, dPharmacy Department and eAnimal Husbandry Department,
State University of Maringá, 87020-900 Maringá-PR, Brazil
bThoMSon Mass Spectrometry Laboratory, Institute of Chemistry and cPlant Biology Department,
Institute of Biology, University of Campinas, 13083-970 Campinas-SP, Brazil
Extratos etanólicos de própolis obtidos a partir de diferentes concentrações de própolis e com álcool hidratado com diferentes teores de álcool/água foram analisados. A ação antioxidante destes
extratos foi determinada através da captura do radical livre 1,1-difenil-2-picril-hidrazila (DPPH•) e
do poder de redução férrico (FRAP) utilizando o complexo férrico-tripiridiltriazina (Fe3+–TPTZ).
O teor de compostos fenólicos totais e a quantiicação de lavonóides também foram veriicados e
obtidos por espectrometria de massas com ionização por electrospray (ESI(-)-MS) dos extratos.
Observou-se que a composição química dos extratos de própolis e sua atividade antioxidante variam com a concentração de própolis e, principalmente, com o teor de álcool/água do etanol hidratado utilizado na extração. Foi possível perceber também que a atividade antioxidante dos extratos é signiicativamente dependente destes parâmetros de extração e que as composições de compostos fenólicos e lavonóides também variam muito. Os valores de FRAP não apresentaram, porém, boa correlação com o teor de lavonóides.
Ethanolic extracts of propolis obtained with different concentrations of propolis and made using hydrous ethanol with various water/ethanol contents were analyzed. The antioxidant
action of the extracts was determined by free radical 1,1-diphenyl-2-picryl-hydrazyl (DPPH•)
scavenging and by ferric reducing ability power (FRAP), using the ferric-tripyridyl triazine
(Fe3+–TPTZ) complex. The total phenolic and lavonoid contents were also determined, and the
electrospray ionization mass spectrometry spectra (ESI(-)-MS) of the extracts were acquired. The chemical composition of propolis extracts and their antioxidant activity were observed to vary with the concentration of propolis, and especially with the water/ethanol contents of the hydrous ethanol used for extraction. The antioxidant activity of the extracts was also found to be signiicantly dependent on these extraction parameters, as well as on the composition of the phenolic compounds and lavonoids. FRAP values showed, however, poor correlation with the lavonoid content.
Keywords: total phenolic contents, antioxidant activity, ESI(-)-MS ingerprint, propolis extraction, lavonoids
Introduction
Propolis is a resin produced by honey bees by mixing wax, pollen, salivary secretions and collected natural resins.1
The chemical composition of propolis is complex and varies with the vegetation visited by bees, as well as with bee
species.2-6 As propolis has characteristics that are beneicial
to human health, such as antioxidant, anti-inlammatory, antifungal and anticancer activities, its chemical composition and properties have been extensively studied.7-10
The antioxidant activity of ethanolic extracts of propolis has been evaluated by free radical 1,1-diphenyl-2-picryl-hydrazyl (DPPH•) scavenging,8 by the ferric reducing
(Fe3+–TPTZ) complex11 and by oxidation of linoleic
acid.5 Similarly, mass spectrometry analyses has been
used to examine the chemical composition of propolis extracts and its correlation with type and properties.9,12
The compositions of total phenolic compounds by Folin-Ciocalteu method and of lavonoid by using AlCl3 have
been determined.11,13 It seems, however, that the correlation
between the antioxidant activity and the contents of phenolic compounds and lavonoids of propolis extracts obtained with different ethanol contents and propolis concentrations has not been investigated yet.
The purpose of this study was therefore to compare the antioxidant activity of ethanolic extracts of propolis prepared using hydrous ethanol with different ethanol/water contents and different propolis concentrations. We also investigated the effect of these extraction variables on the antioxidant activity, the total phenolic compounds and lavonoid, and in the overall composition, as revealed by electrospray ionization mass spectrometry (ESI(-)-MS) ingerprints of the extracts. In addition, we have also assessed the correlation between the composition of propolis of the various extracts and their antioxidant activity.
Experimental
Collection of propolis
Propolis sample was collected from hives of Apis mellifera bees in the apiary of the Iguatemi Experimental Farm of the Universidade Estadual de Maringá (Maringá, Paraná State) (latitude 23º25 south and longitude 51º57 west of Greenwich, altitudeof 540 m). The sample was kept in polypropylene jars at –4 °C. This sample is being certiied as organic propolis by IBD-Certiications at Botucatu, São Paulo State, Brazil. This institute certiies propolis at national and international levels, which makes possible the traceability of organic propolis.
Preparation of extracts
The four extracts were obtained using two different concentrations of propolis between 5 and 30% (m/m) and two ethanol dilutions, between 60 and 96% (v/v) by
turbo-extraction for 15 min. The extracts were vacuum iltered and dealcoholized in a rotary evaporator (Buchi, model RT 210) to the limit of 15% ethanol. Then, they were spray dried in a Labmaq spray drier with the capacity of 0.5 L h-1. The dried extracts were stored in amber-colored
lasks with inner sealing plugs and screw caps at −4 °C. More information about the preparation method, propolis and solvent concentrations are protected by a patent at the National Institute of Industrial Property (INPI) under the number PI 0605768-3.14 Table 1 shows the labeled extracts,
their respective levels (−1) for the lowest level; (+1) for the highest level) of the coded independent variables used in the experimental design and the total solid contents of the four extracts. The code of the lowest level (−1) represent the lowest concentration of propolis or the lowest ethanol contents used to prepare the extracts while the code of the highest level (+1) represent the highest concentration of propolis or the highest ethanol contents used to prepare the extracts.
DPPH radical scavenging activity
The free radical scavenging activity was measured using DPPH• as already described15 with some modiications.
Briefly, various volumes of propolis extract solutions (2.0 mg mL-1) were added to 2.0 mL of DPPH• methanolic
solution (0.1192 mmol L-1) and maintained in the dark
for 30 min at room temperature. Then, absorbance was measured at 517 nm. Methanol was used instead of propolis extract solutions as a control and Trolox was used as a positive control. The results were expressed by EC50 value
(half maximal effective concentration),which determines the extract concentration (µg mL-1) that provides 50%
inhibition; the lower its value is, the greater the eficiency of the antioxidant. The scavenging capacity of the DPPH radical was calculated with equation 1 (percent inhibition of the DPPH radical).
(1)
The extract concentration value was plotted vs. % of inhibition of DPPH• and the EC
50 value was obtained by
linear regression. All treatments were run in triplicate.
Table 1. Extract names, levels of coded independent variables and the total solid contents in each case of extraction
Extract names Ethanol content (%) Propolis concentration (% w/w) Total solid contents (%)*
B10 −1 −1 3.6 ± 0.1
B30 +1 −1 4.5 ± 0.2
C10 −1 +1 5.5 ± 0.2
C30 +1 +1 6.8 ± 0.3
Ferric reducing ability power – FRAP
The FRAP was determined as previously described16
with modifications. This method is based on a redox reaction in which the antioxidants act as reductants, and an easily reduced oxidant (Fe3+) is used in stoichiometric
excess, resulting in a blue ferrous complex. The absorbance at 593 nm was read using a spectrophotometer (Cary 50 – Varian) for 3.0 mL of a freshly prepared Fe3+–TPTZ complex
solution pre-incubated at 37 ºC. This solution (FRAP reagent) was prepared by mixing acetate buffer (300 mmol L-1,
pH 3.6), TPTZ (10 mmol L-1 in 1.0 mol L-1 HCl), and FeCl 3
(20 mmol L-1)at 10:1:1 (v/v/v). Different concentrations of
100 µL propolis extract solutions were added to cuvettes with 300 µL of distilled water and 3.0 mL of Fe3+–TPTZ complex,
totaling 1:34 dilution. The mixtures were homogenized and incubated at 37 ºC for 30 min before absorbance reading at 593 nm. All treatments were run in triplicate and Trolox™ ((±)-6-hydroxy-2,5,7,8-tetramethylchromane-2-carboxylic acid) was used as a positive control. The potential of the antioxidants in the propolis extract to reduce Fe3+ to Fe2+
was expressed in µmol Fe2+ g-1 of propolis extract using
a calibration curve of FeSO4•7H2O (0-2000 µmol L-1)
(r2 = 0.9999). It was assumed that the higher measured FRAP
value, the higher the antioxidant content of the propolis extract that could reduce the ferric ion to ferrous ion.
Total phenolic contents
The total phenolic contents of the propolis extracts were analyzed using gallic acid as a standard by the Folin-Ciocalteu method17 with some modiications. Methanolic
solutions of propolis extracts (2.5 mg mL-1) were prepared
and 250 µL of these solutions or of standard solutions of gallic acid or methanol as blank were added to separate test tubes. To each tube, 250 µL of Folin-Ciocalteu reagent (diluted in water 1:1), 500 µL of Na2CO3 saturated solution, and 4 mL
of distilled water were added and mixed. The solutions were incubated in the dark at room temperature for 25 min and then centrifuged for 10 min at 3000 rpm. The sample absorbance was read against the blank at 725 nm using a spectrophotometer (Cary 50 – Varian). The total phenolic content of the extracts was determined by comparison with a calibration curve of gallic acid as a standard (r2 = 0.9995)
and represented as mg gallic acid equivalents (GAE) in g-1
of propolis extract. The analyses were done in triplicate.
Total lavonoid contents
The total lavonoid contents in the propolis extracts were determined by the AlCl3 method,18 with slight
modiications. Methanolic solutions of propolis extract (2.5 mg mL-1) were prepared and 500 µL of solution or
of quercetin standard solutions using methanol as a blank were added to separate test tubes. To each tube, 250 µL of AlCl3 5% (m/v in methanol) and 4.25 mL of methanol
were added. After 30 min, absorbance was read at 425 nm using a spectrophotometer (Cary 50 – Varian) at room temperature. The total lavonoid contents of the extracts were determined by comparison with the calibration curve of the quercetin standard (r2 = 0.9998) and represented as
mg quercetin equivalents g-1 (mg QE g-1) of propolis extract.
The analyses were done in triplicate.
Electrospray ionization mass spectrometry (ESI-MS) ingerprints
For the ESI(-)-MS ingerprints of the propolis extracts, 10 mg of each extract were dissolved in 1 mL of a solution of 50% HPLC-grade methanol and 50% puriied water containg 0.5% of NH4OH. These solutions were directly
infusedinto the ESI source by means of a syringe pump (Harvard Apparatus, Massachusetts, USA) at a flow rate of 10 µL min−1. Negative ion mode fingerprints
[ESI(-)-MS] were acquired using an Applied Biosystems Q-TRAP mass spectrometer (Foster City, CA, USA) in the following conditions: capillary and cone voltages of −4500 V and −30 V, respectively, desolvation temperature of 350 ºC. Diagnostic ions in the different propolis extracts were identiied by comparison of their ESI(-)-MS/MS dissociation patterns with those of compounds identiied in previous studies.4,8,9,12,19 Fingerprints are shown in the
m/z 150-600 range, since no important ions were observed below or above these m/z values.
Statistical analysis
The experimental design and statistical analysis were planned using the software Design Expert 7.1.3,20 which used
both the propolis concentration and extraction ethanol content with −1 value as the lowest value and +1 for the highest value (Table 1) for the factorial design 22. The parameters used were
DPPH• test, FRAP, total phenolic contents and quantiication
of lavonoid. The data were expressed as mean standard deviations, one-way analysis of variance (ANOVA) and surface test from software Design Expert 7.1.3.
Chemicals
DPPH•, tripyridyltriazine, FeSO
4•7H2O, gallic acid,
Results and Discussion
Determination of antioxidant activity
Table 2 shows the results of the propolis extracts and positive control obtained by analyses of scavenging free radical DPPH, FRAP, total phenolic compounds by the Folin-Ciocalteu reagent method and quantification of lavonoid using AlCl3. For all the responses analyzed, the
linear model was signiicant (P < 0.0001). In the analysis of DPPH•, a lower EC
50 value indicates
greater antioxidant activity, as a smaller mass of extract
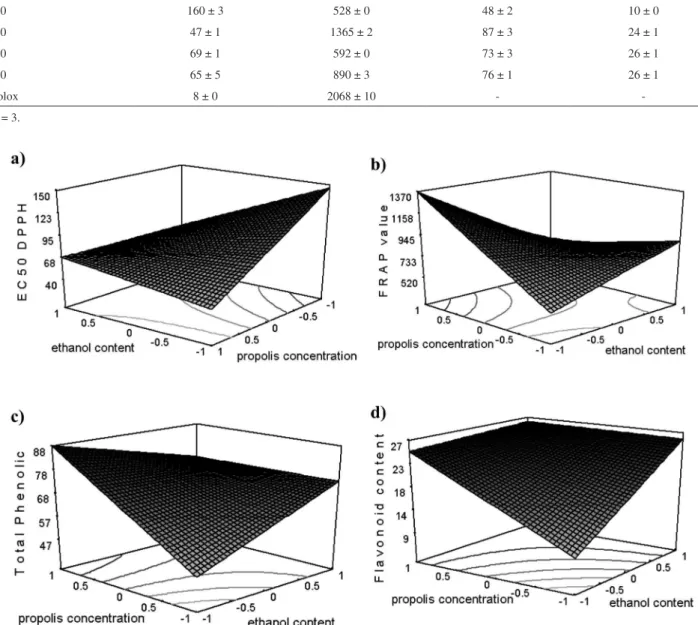
is required to inhibit 50% of the DPPH radical. The best result was observed in extract C10, obtained with a higher concentration of propolis and lower ethanol content (Figure 1a). The analysis of variance revealed that the propolis concentration and the ethanol content, as well as the interaction between these two factors, were highly signiicant (p < 0.0050) for the following model: y = + 82.6083 − 14.0083 x1− 24.9083 x2 + 24.8083 x1x2,
where y = DPPH value, x1 = ethanol content, x2 = propolis
concentration and x1x2 = interaction between concentration and ethanol content. The antioxidant effect of the main constituents found in water extracts of propolis is greater
Figure 1. a) EC50 DPPH• (µg mL-1 propolis extract), b) FRAP values (µmol Fe2+ g-1 propolis extract), c) total phenolic compounds (mg GAE g-1 propolis
extract), d) lavonoids (mg QE g-1 propolis extract) obtained for propolis extracts based on the ethanol content and propolis concentration.
Table 2. Antioxidant activity and composition of propolis extracts (PE)
Extract DPPH*
(EC50 µg mL-1)
FRAP value* (µmol Fe2+ g-1 PE)
Total phenolic content* (mg EAG g-1 PE)
Flavonoids* (mg EQ g-1 PE)
B10 160 ± 3 528 ± 0 48 ± 2 10 ± 0
C10 47 ± 1 1365 ± 2 87 ± 3 24 ± 1
C30 69 ± 1 592 ± 0 73 ± 3 26 ± 1
B30 65 ± 5 890 ± 3 76 ± 1 26 ± 1
Trolox 8 ± 0 2068 ± 10 -
than that of the ethanol extracts.21 Hence, higher antioxidant
activity is expected for propolis extracts made by hydrous ethanol with higher water contents. In this study, the observed contribution of the ethanol content to a lower EC50
was 13%, while those of the effects of extract concentration and the “extract concentration × ethanol content” interaction were both 40%. The remaining percentage likely corresponds to deviations in measurements.
In the FRAP analysis, the extract C10 also had a higher value of equivalent µmol Fe2+ g-1 of extract, indicating
higher antioxidant activity. The analysis of variance revealed that both the concentration and ethanol content factors and the interaction between them are signiicant (p < 0.0001) for the following model: y = + 843.6705 − 102.8131 x1 + 134.8087 x2− 283.7762 x1x2, where y = FRAP
value, x1 = ethanol content, x2 = propolis concentration and x1x2 = the interaction between concentration and ethanol
content. The “extract concentration × ethanol content” interaction was the main contributor to the effects, with 74%, while the contributions of the extract concentration and ethanol content for a higher FRAP value were 16 and 10%, respectively (Figure 1b).
Lower antioxidant activity was observed in extract B10, both by DPPH radical scavenging and FRAP (Table 2). Likewise, this propolis extract had the lowest contents of total phenolic compounds and lavonoid, resulting from a lower concentration of propolis and a lower ethanol content used for extraction. Several studies establish a relationship between the antioxidant activity of ethanolic extracts of propolis and their contents of phenolic compounds, such as the lavonoids.5,22,23 The analysis of variance revealed that
the propolis concentration, the ethanol content, and their interaction are signiicant (P < 0.0500) for the content of total phenolic compounds: y = + 70.3855 + 2.4794 x1 + 9.9669 x2 − 10.1251 x1x2, where y = content of total
phenolic compounds, x1 = ethanol content, x2 = propolis concentration and x1x2 = interaction between the propolis
concentration and the ethanol content. The effect of the ethanol content was only 3%, while those of the propolis concentration and the “extract concentration × ethanol content” interaction were more important for the content of total phenolic compounds, with contributions of 46 and 48%, respectively (Figure 1c). The remaining percentage corresponds to pure error. The values of total phenolic compounds obtained in this study are within the range found in propolis, which is 31-299 mg GAE g-1 of ethanolic
extract of propolis.5
The ethanol content of the hydrous ethanol used to obtain the extracts had a greater effect on the content of lavonoids (39%), whereas the propolis concentration and the interaction between these two factors had effects of 31 and
28%, respectively (Figure 1d). The remaining percentage corresponds to error. The analysis of variance showed that the main effects and the interaction between them were signiicant (P < 0.0001) for the quantiication of lavonoid: y = + 21.6882 + 4.2791 x1 + 3.8538 x2− 3.6678 x1x2, where
y = content of total phenolic compounds, x1 = ethanol content, x2 = propolis concentration and x1x2 = interaction
between the propolis concentration and the ethanol content. The flavonoid contents obtained in ethanolic extracts of propolis in this study are within the range of 2.5-176 mg QE g-1 found in propolis.5
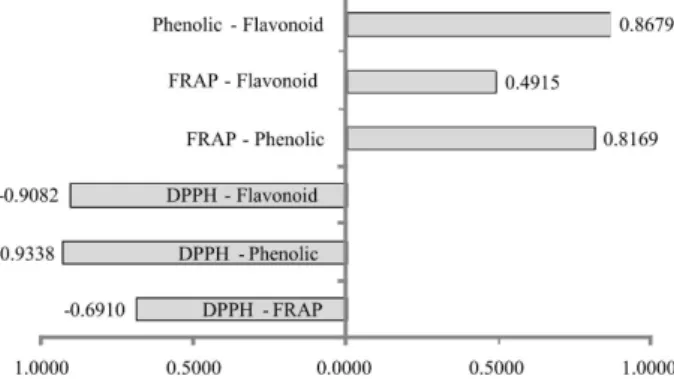
The correlations between the method results, DPPH•
and FRAP, and the contents of phenolic compounds and lavonoid are shown in Figure 2. A negative correlation is observed between the DPPH•-lavonoid content (–0.9082),
DPPH•-phenolic content (–0.9338) and DPPH•-FRAP
(–0.6910), since a low EC50 value in the DPPH• method
is related to high contents of phenolic compounds and lavonoid, and a high value of FRAP and vice-versa. The correlation between phenolic content-lavonoid content was positive (0.8679), as well as the correlation between FRAP-phenolic content (0.8169), indicating that a large amount of phenolic content can be derived from the lavonoid contents and that the high reducing power by the FRAP method can derive from the content of phenolic compounds present in the extracts. On the other hand, the FRAP value may not be related to the lavonoid content, because the coeficient of correlation between FRAP-lavonoid content is only 0.4915. This indicates that the lavonoids in the extracts analyzed are important for the antioxidant activity by the DPPH free radical scavenging method, but not by the reducing power observed by the FRAP method. According to Nagai and co-workers,24
the lavonoids in ethanolic propolis extracts behave as scavengers in the initial stage of lipid peroxidation and later react with peroxy radicals of polyunsaturated fatty acids, breaking the chain reaction;therefore, not necessarily as a reducer as in the FRAP method.
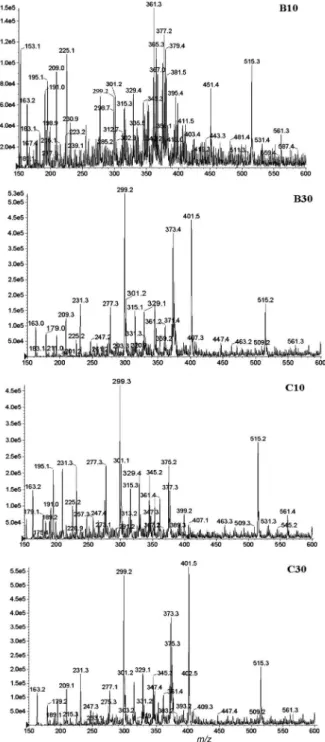
Fingerprint by mass spectrometry
These fingerprints were used for the qualitative assessment of the different methods of extraction. By comparing the four ESI(-)-MS fingerprints obtained (Figure 3), one can notice that the spectrum of the C10 propolis extract, which had the highest antioxidant activity, was similar to the spectra of extracts C30 and B30. The ion with the highest intensity in the C10 extract spectrum is that of m/z 299, which may be the phenolic
compound 3,5-diprenyl-4-hydroxy-cinnamic acid (DPHC) or the lavonoid kaempferide, both found in this type of propolis.9,19 We also found ions of m/z 163, 179, 231, 301,
329 and 515, commonly seen in ESI(-)-MS of propolis, which may correspond to p-coumaric acid, caffeic acid, propol or 3-prenyl-4-hydroxy-cinnamic acid (PHC), dihydrokaempferide or e/z communic acid, betuletol and dicaffeoylquinic acid, respectively.9,19 p-Coumaric acid,
caffeic acid, propol, 3-prenyl-4-hydroxy-cinnamic acid, and dicaffeoylquinic acid are all phenolic compounds, dihydrokaempferide and betuletol are lavonoids, and e/z communic acid is a terpene.
An increase in the ethanol content used to obtain the propolis extracts, both from B10 to B30 and C10 to C30, resulted in the appearance of ions of m/z 373 and 401 in the spectra of B30 and C30 (Figure 3), which can be assigned to triterpenes.8,19 These compounds have low antioxidant
activity,8 thereby reducing the total activity of their extracts.
This is in accordance with the decrease observed in FRAP values and the increase in IC50 values of DPPH• of extracts
C10 to C30. However, extracts B10 and B30 had a distinct behavior. Possibly due to the higher intensity of the ion of m/z 299 observed in the B30 propolis extract. Studies report that mono- and diprenyl ortho-substituted phenolic acids (PHC and DPHC) show higher antioxidant activity in comparison with unsubstituted p-coumaric acid.22 Such
compounds are possibly detected as the ions of m/z 231, 299 and 163, respectively (Figure 3). In addition, other studies of the effects of various parameters on the propolis extraction yield23 also observed increased yield for compounds derived
from p-coumaric acid with increased ethanol content, such as mono- and diprenyl ortho-substituted phenol acids.
The ESI(-)-MS of extract B10, which had the lowest antioxidant activity, also had the lowest ion intensity in general. The relative intensity of the ion of m/z 299 was also lower than those of the other ions, indicating its low concentration in the extract. The ion with the highest intensity in the B10 extract was that of m/z 361, which may be attributed to 15-acetoxy-cupressic acid, found in propolis from the Paraná State.9
The presence of the ion of m/z 299 in the spectra of the four extracts of the same propolis characterizes it as green propolis.19 In addition, the ion of m/z 299 appears to be
also responsible for the antioxidant activity of the propolis extracts analyzed, because extract B10, which showed low antioxidant activity, also had low intensity for this ion.
Conclusions
By the response surface and statistical analysis it was possible to observe that the DPPH• and FRAP values are
significantly dependent of the propolis concentration and the water/ethanol content of hydrous ethanol used in the extraction. The ethanol/water content and the propolis concentration were also found to correlate with the composition of phenolic compounds and lavonoids. Likewise, similar correlation was also found with all the parameters analyzed (DPPH•, FRAP, phenolic contents and
lavonoid contents) except for FRAP values, which showed poor correlation with lavonoid contents. The ESI(-)-MS ingerprints of the extracts showed substantial changes in ions intensities, indicating that the composition of propolis extracts varies with propolis concentration, especially with the water/ethanol content of the hydrous ethanol used in the extraction. The ion of m/z 299, which probably corresponds to the phenolic compound 3,5-diprenyl- 4-hydroxy-cinnamic acid, was the most intense and increased with the ethanol content and propolis concentration.
Acknowledgement
We thank CAPES, FINEP and CNPq for inancial support.
References
1. Mot, A. C.; Soponar, F.; Sârbu, C.; Talanta. 2010, 81, 1010. 2. Lotti, C.; Fernandez, M. C.; Piccinelli, A. L.; Cuesta-Rubio, O.;
Hernandez, I. M.; Rastrelli, L.; J. Agric. Food Chem. 2010, 58, 2209.
3. Peña, R. C.; Cien. Inv. Agr. 2008, 35, 17.
4. Sawaya, A. C. H. F.; Cunha, I. B. S.; Marcucci, M. C.; Rodrigues, R. F. O.; Eberlin, M. N.; Apidologie 2006, 37, 398. 5. Kumazawa, S.; Hamasaka, T.; Nakayama, T.; Food Chem. 2004,
84, 329.
6. Custodio, A. R.; Ferreira, M. M. C.; Negric, G.; Salatino, A.; J. Braz. Chem. Soc. 2003, 14, 354.
7. Dalben-Dota, K. F.; Faria, M. G. I.; Bruschi, M. L.; Pelloso, S. M.; Lopes-Consolaro, M. E.; Svidzinski, T. I. E.; J. Altern. Complemen. Med. 2010, 16, 285.
8. Sawaya, A. C. H. F.; Calado, J. C. P.; Santos, L. C.; Marcucci, M. C.; Akatsu, I. P.; Soares, A. E. E.; Abdelnur, P. V.; Cunha, I. B. S.; Eberlin, M. N.; J. ApiProduct ApiMedical Sci. 2009, 1, 36.
9. Marcucci, M. C.; Sawaya, A. C. H. F.; Custodio, A. R.; Paulino, N.; Eberlin, M. N. In Scientiic Evidence of the Use of Propolis in Ethnomedicine, Orsolic, N.; Basic, I.. eds., Transworld Res Network: Kerala, India, 2008, pp. 33-54.
10. Oliveira, A. C. P.; Shinobu, C. S.; Longhini, R.; Franco, S. L.; Svidzinski, T. I. E.; Mem. Inst. Oswaldo Cruz 2006, 101, 493. 11. Kalogeropoulos, N.; Konteles, S. J.; Troullidou, E.; Mourtzinos,
I.; Karathanos, V. T.; Food Chem. 2009, 116, 452.
12. Sawaya, A. C. H. F.; Cunha, I. B. S.; Marcucci, M. C.; Aidar, D. S.; Silva, E. C. A.; Carvalho, C. A. L.; Eberlin, M. N.; Apidologie 2007, 38, 93.
13. Singleton, V. L.; Rossi, J. A.; Am. J. Enol. Vitic. 1965, 16, 144. 14. Gregoris, E.; Stevanato, R.; Food Chem. Toxicol. 2010, 48, 76. 15. Franco, S. L.; Estivalet, T. I.; Pozzi, A. C.; Moura, L. P. P.;
Longhini, R.; BrPI 0501875-7, 2007.
16. Bondet, V.; Brand-Williams, W.; Berset, C.; Lebensm.Wiss. Technol. 1997, 30, 609.
17. Benzie, I. F. F.; Strain, J. J.; Anal. Biochem. 1996, 239, 70. 18. Woisky, R. G.; Salatino, A.; J. Apicult.l Res. 1998, 37, 99. 19. Sawaya, A. C. H. F.; Tomazela, D. M.; Cunha, I. B. S.; Bankova,
V. S.; Marcucci, M. C.; Custodio, A. R.; Eberlin, M. N.; Analyst 2004, 129, 739.
20. DESIGN EXPERT 7.1.3; Software for design of experiments; Stat-Ease, Inc., Minneapolis, USA, 2007.
21. Nakajima, Y.; Shimazawa, M.; Mishima, S.; Hara, H.; Life Sci. 2007, 80, 370.
22. Kortenska, V. D.; Velikova, M. P.; Yanishlieva, N. V.; Totzeva, I. R.; Bankova, V. S.; Marcucci, M. C.; Eur. J. Lipid Sci. Technol. 2002, 104, 19.
23. Cunha, I. B. S.; Sawaya, A. C. H. F.; Caetano, F. M.; Shimizu, M. T.; Marcucci, M. C.; Drezza, F. T.; Povia, G. S.; Carvalho, P. O.; J. Braz. Chem. Soc. 2004, 15, 964.
24. Nagai, T.; Inoue, R.; Inoue, H.; Suzuki, N.; Food Chem. 2003, 80, 29.
Submitted: July 22, 2010
Published online: February 3, 2011