Ciência Rural, v.47, n.3, 2017.
Fruit yield and composition in orange trees cv. ‘Lane Late’ in response to nitrogen
fertilization in Sandy Typic Hapludalf soil
Produção e composição de frutos de laranjeira cv. ‘Lane Late’ em resposta à adubação nitrogenada em um Argissolo Vermelho
Gustavo Brunetto1* Cesar Cella1 Alcione Miotto1 Eduardo Girotto2 Felipe Lorensini3
Auri Brackmann4 Carlos Alberto Ceretta1 Márcio Renan Weber Schorr4
Vanderlei Both4 Vítor Gabriel Ambrosini5
ISSNe 1678-4596
Received 06.05.14 Approved 10.21.16 Returned by the author 12.13.16
INTRODUCTION
Brazil is the greatest exporter of citrus juice. In Rio Grande do Sul (RS) State there are approximately 42,000 hectares with citrus crops, accounting for the fifth largest area in the country. From the year 2000, in Rosário do Sul and in other
municipalities of the Campanha Gaúcha region, part of the soils with natural grassland were added to the citrus production system, especially sweet orange varieties (Citrus sinensis L.), including cv. ‘Lane Late’. This orange cultivar produces fruit that are appreciated for in natura consumption (ALMEIDA et al., 2013).
1Departamento de Solos, Programa de Pós-Graduação em Ciência do Solo (PPGCS), Universidade Federal de Santa Maria (UFSM), 97105-900,
Santa Maria, RS, Brasil. E-mail: [email protected]. *Corresponding author.
2Instituto Federal de Educação, Ciência e Tecnologia do Rio Grande do Sul (IFRS), Ibirubá, RS, Brasil.
3Associação Riograndense de Empreendimentos de Assistência Técnica e Extensão Rural (EMATER), Palmeira das Missões, RS, Brasil. 4Departamento de Fitotecnia, Programa de Pós-Graduação em Agronomia, Universidade Federal de Santa Maria (UFSM), Santa Maria, RS, Brasil. 5Programa de Pós-Graduação em Ciência do Solo (PPGCS), Universidade Federal do Rio Grande do Sul (UFRGS), Porto Alegre, RS, Brasil.
ABSTRACT: Little is known about the impact of N fertilization on fruit production and composition in orange groves grown in soils with low
or medium organic matter content in Rio Grande do Sul (RS). This study aimed to evaluate how N fertilization of orange trees cv. ‘Lane Late’ in a sandy soil may interfere in fruit yield and composition of fruit and juice. The experiment was conducted with orange trees cv. ‘Lane Late’ growing in Sandy Typic Hapludalf soil, in Rosário do Sul (RS). The plants received applications of 0, 20, 40, 60, 80, 100, 120, 140 and 160kg N ha-1. Total N in leaves, number of fruits per plant, yield, fresh weight, fruit diameter, peel thickness, percentage of fruit juice, peel color, juice
color, ascorbic acid content, total soluble solids (TSS) and total titratable acidity were evaluated in 2010/2011 and 2011/2012 crops. In the first
crop, especially yield, number of fruits per plant, TSS content in fruit juice and ratio decreased with increasing N rate applied. However, in the second crop, the total titratable acidity of the fruit juice prominently increased with the dose of N applied. In both crops, results were highly
influenced by rainfall distribution, which affect the plant physiology, soil N dynamics and, consequently, probability of response to N applied
and the loss of mineral N in the soil.
Key words: nitrogen, leaf analysis, fruit quality, Citrus sinensis L.
RESUMO: O impacto da adubação nitrogenada na produção e composição de frutos em pomares de laranjeiras cultivados em solos com
baixo ou médio teor de matéria orgânica do RS é pouco conhecido. Este trabalho objetivou avaliar como a adubação nitrogenada, em solo de textura arenosa, pode interferir na produção, composição de frutos e do suco em laranjeiras cv. ‘Lane Late’. O experimento foi conduzido em um pomar de laranjeiras cv. ‘Lane Late’ instalado sobre um Argissolo Vermelho, em Rosário do Sul (RS). As plantas foram submetidas à aplicação de 0, 20, 40, 60, 80, 100, 120, 140 e 160 kg ha-1 de N. Nas safras de 2010/2011 e 2011/2012 foi avaliado o teor total de N em
folhas, o número de frutos por planta, a produção, o peso fresco e diâmetro de frutos, espessura da casca, porcentagem de suco nos frutos, cor da epiderme e do suco, os valores de vitamina C, sólidos solúveis totais (SST) e acidez total titulável. Na primeira safra, especialmente a produção, o número de frutos por planta, o teor de SST no suco e o ratio diminuíram com o aumento da dose de N aplicada. Mas, na segunda safra, de forma destacada, o teor de acidez total titulável no suco aumentou com a dose de N aplicada. Nas duas safras, os resultados foram
muito influenciados pela distribuição das precipitações pluviométricas, que afetam a fisiologia da planta, a dinâmica do N no solo e, por consequência, a probabilidade de resposta ao N aplicado, bem como as perdas de N mineral no solo.
Palavras-chave: nitrogênio, análise foliar, qualidade do fruto, Citrus sinensis L.
2 Brunetto et al.
Soils in which the groves are planted have a mild rolling relief, facilitating the mechanization of cultural practices. They have a sandy surface horizon and low or medium organic matter content, resulting in a low capacity to supply mineral nitrogen (N) for plants (BRUNETTO et al., 2012). In most of these productive groves, the vegetation on plant rows is desiccation to avoid competition for water and nutrients with orange trees. In general, an intense growth of cover crops is observed in inter-rows. Leguminosae can promote the biological fixation of atmospheric N together with grasses or other species. They can absorb nutrients, including N, from deeper layers of the soil. With the decomposition of shoot residues deposited on the soil surface and senescent roots inside the soil, the N contained in the plant tissue can be released to the root zone of orange trees. However, it can be sometimes absorbed in small amounts by plants (DASBERG, 1987). Despite these factors, fully mature leaves, which are organs diagnostic of this nutritional status in orange trees, usually show a total N below “normal status” (< 23g kg-1) (CQFS-RS/SC, 2004). Therefore, it
usually becomes necessary to apply N sources, such as urea (BOARETTO et al., 2013).
The amount of N needed and the dose to be applied in soils of citrus groves, in RS state, are established based on the content of soil organic matter; but the expected yield and the total N in mature leaves are also considered (CQFS-RS/SC, 2004). However, N doses have not been established for this culture based on regional calibration experiments in RS. Their impact on the nutritional status of plants, fruit production and its components, such as number of fruits per plant, weight and fruit diameter, are still not known. Effect of N fertilizer on fruit peel color and juice composition, such as ascorbic acid content, a compound with high reductant power and potential antioxidant activity, have also not been established for this culture (COUTO & CANNIATTI-BRAZAGA, 2010). Their effects are also unknown regarding total soluble solids (TSS), represented by soluble sugars, organic acids and inorganic salts (WILLS et al., 1981), and the ratio (TSS/acidity), which is used to evaluate fruit ripening and balance of sweet: acid taste; consequently, their effects on the palatability to the consumer (LIMA et al., 1999).
Therefore, it is necessary to carry out calibration experiments in the field in order to obtain numerical parameters that assist in the prediction of N fertilization. Thereby, it may be possible to establish adequate N levels to supply the plant
demands, increasing fruit yield (CANTARELLA et al., 2003). High levels of N fertilizer increases fruit weight although dilute the TSS content (FERGUSON & BOYD, 2002). However, the amount of N cannot be excessive because, it may stimulate a vegetative growth (PEREIRA et al., 2013), increasing the shading of fruits, which may slow their ripening and the degradation of organic acids. This study aimed to evaluate how nitrogen fertilization of orange trees cv. ‘Lane Late’, in a sandy soil, which may interfere with the fruit yield and in the composition of fruit and juice.
MATERIALS AND METHODS
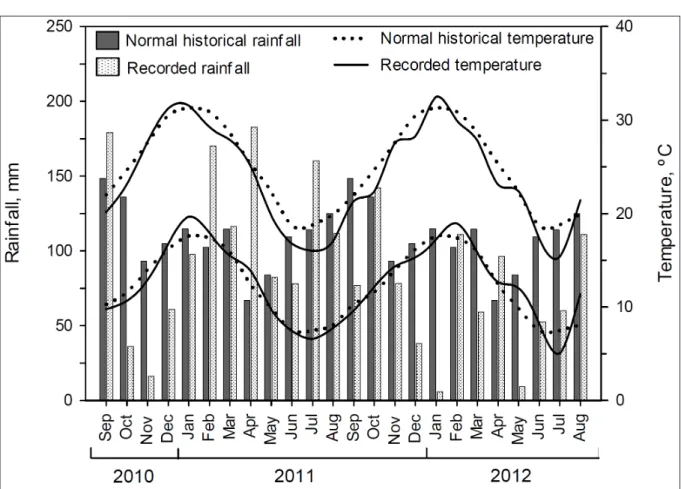
The field experiment started in 2009. The 2010/2011 and 2011/2012 crops, grown in a commercial grove with orange trees cv. ‘Lane Late’ grafted on a Poncirus trifoliata rootstock in Rosário do Sul (RS), Campanha Gaúcha Central region (30°15’26.75’’ S, 54°58’43.72” W) (datum - WGS84), were evaluated. Grove was established in 2004, with a 6.0m spacing between rows and 3.0m between plants, totaling 555 plants per hectare. The climate is humid subtropical (CFA 2). The climatic data observed during the experiment are shown in figure 1. The soil was classified as a Sandy Typic Hapludalf. Prior to the experiment beginning, it was made a soil test (layer 0-20cm). The soil contains 80g kg-1 of clay; 15g kg-1 of organic matter; pH
in water of 5.7; 76mg dm-3 of available P; 80mg
dm-3 of exchangeable K (Mehlich 1 extractor);
4.4cmolc dm-3 of exchangeable Ca and 0.8cmol c
dm-3 of exchangeable Mg (KCl 1mol L-1 extractor)
(TEDESCO et al., 1995).
In September 2009, 2010 and 2011, 0, 20, 40, 60, 80, 100, 120, 140 and 160kg N ha-1
diameter and the peel thickness were determined with two cross-section measurements in each fruit. In the same fruits, the juice was quantified using a juicer. Sample of juice were also analyzed in relation to ascorbic acid content, TSS and total titratable acidity (INSTITUTO ADOLFO LUTZ, 2008). The TSS/ total titratable acidity (ratio) was also calculated.
The epidermis color and the juice color was determined with an electronic colorimeter (Minolta, model CR310), with a three-dimensional color scale L*C*Ho (CIELAB). The L value
represents lightness scale ranging from black (L=0) to white (L=100). The chroma (C) represents the strength of a surface color. At the center of the three-dimensional layout its value is zero and increases as it is moved away. The hue (H°) is the color tone, wherein the angle 0° comprises pure red, 90° pure yellow, 180° pure green and 270° blue. Epidermis color was determined in all five fruits in the equatorial region, in less orange and more orange quadrants. Determination of juice color was done in a sample consisting of five
fruits. In January, 20 leaves per plant from each crop were collected at approximately 1.5m above the ground in four quadrants of the canopy (CQFS-RS/SC, 2004). Leaves were dried, grounded and subjected to analysis of total N content (TEDESCO et al., 1995). In 2009/2010 season, the amount of rainfall during the flowering was high and affected negatively the yield. Therefore, yield and quality components were not evaluated in this crop season. The data were submitted to analysis of variance (ANOVA) and, when significant, regression equations were adjusted.
RESULTS AND DISCUSSION
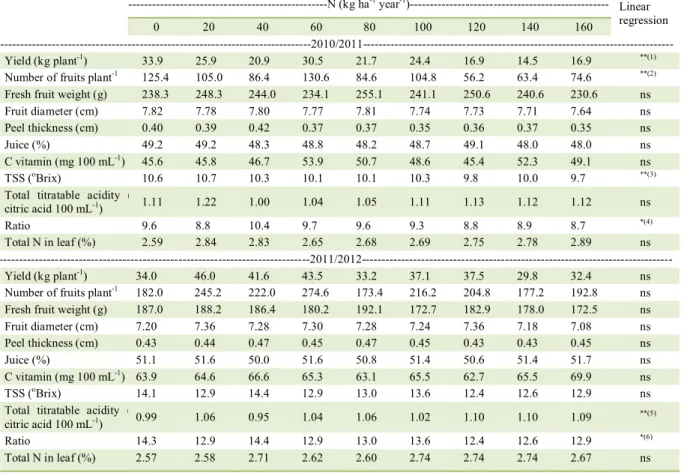
In the 2010/2011 crop season, the fruit yield, number of fruits per plant, TSS of the juice and the ratio decreased with increasing N doses applied to the soil, presenting low determination coefficients (R2), respectively 0.21, 0.19, 0.44 and 0.13 (Table 1).
However, N doses did not affect fresh fruit weight, fruit diameter, peel thickness, percentage of juice
4 Brunetto et al.
and total N content in mature leaves. In addition, juice parameters as ascorbic acid content and total titratable acidity were also not affected. This little expressive answer may be attributed to the fact that in the previous crop season there was not fruit yield due to the high volume of rain in the period. Therefore, for this crop season, the plants had more internal reserves of N compounds, based on rates of N in leaves, which minimized the treatments effect (Table 1). In addition, little answer can be attributed in part to the high volume of rainfall in the last months of 2010, and also over some months in 2011 (Figure 1). Because of this, as the soil only had 15g kg-1 of organic matter and 80g kg-1 of clay, part
of the N applied may have been lost by leaching, especially in the NO3--N form. LORENSINI et al.
(2012), verified in the same kind of soil present in the study, in an area nearby this experiment, a considerable raise in the concentrations of NO3--N
at 20cm depth, 20 days after the surface application of urea in the doses of 120kg N ha-1. This showed the
ease in which the NO3--N can migrate in the profile
of this soil, even under moderate rain condition. As for most fruit trees, most roots responsible for absorbing water and nutrients are located in the superficial layers of the soil. If a downward movement of forms of N into deeper layers of the soil profile happens, a lower utilization of N applied is expected and, consequently, less accumulation in the organs of the plant (MAUST & WILLIAMSON, 1994). This may explain in part why there was no increase in the total N content in leaves and also the impact of N applied to other evaluated parameters such as fresh fruit weight, fruit diameter, peel thickness, percentage of juice in fruits, vitamin C content and total titratable acidity in the juice.
In addition, DAVIES & ALBIGO (1994) attribute the low absorption of N in the early stages
Table 1 - Production, yield components, fruit composition and orange fruit juice (cv. ‘Lane Late’) subjected to N fertilization.
---N (kg ha-1 year-1
)--- Linear regression
0 20 40 60 80 100 120 140 160
---2010/2011--- Yield (kg plant-1) 33.9 25.9 20.9 30.5 21.7 24.4 16.9 14.5 16.9 **(1)
Number of fruits plant-1 125.4 105.0 86.4 130.6 84.6 104.8 56.2 63.4 74.6 **(2)
Fresh fruit weight (g) 238.3 248.3 244.0 234.1 255.1 241.1 250.6 240.6 230.6 ns Fruit diameter (cm) 7.82 7.78 7.80 7.77 7.81 7.74 7.73 7.71 7.64 ns Peel thickness (cm) 0.40 0.39 0.42 0.37 0.37 0.35 0.36 0.37 0.35 ns Juice (%) 49.2 49.2 48.3 48.8 48.2 48.7 49.1 48.0 48.0 ns C vitamin (mg 100 mL-1) 45.6 45.8 46.7 53.9 50.7 48.6 45.4 52.3 49.1 ns
TSS (oBrix) 10.6 10.7 10.3 10.1 10.1 10.3 9.8 10.0 9.7 **(3) Total titratable acidity (g
citric acid 100 mL-1) 1.11 1.22 1.00 1.04 1.05 1.11 1.13 1.12 1.12 ns
Ratio 9.6 8.8 10.4 9.7 9.6 9.3 8.8 8.9 8.7 *(4)
Total N in leaf (%) 2.59 2.84 2.83 2.65 2.68 2.69 2.75 2.78 2.89 ns ---2011/2012---
Yield (kg plant-1) 34.0 46.0 41.6 43.5 33.2 37.1 37.5 29.8 32.4 ns Number of fruits plant-1 182.0 245.2 222.0 274.6 173.4 216.2 204.8 177.2 192.8 ns
Fresh fruit weight (g) 187.0 188.2 186.4 180.2 192.1 172.7 182.9 178.0 172.5 ns Fruit diameter (cm) 7.20 7.36 7.28 7.30 7.28 7.24 7.36 7.18 7.08 ns Peel thickness (cm) 0.43 0.44 0.47 0.45 0.47 0.45 0.43 0.43 0.45 ns Juice (%) 51.1 51.6 50.0 51.6 50.8 51.4 50.6 51.4 51.7 ns C vitamin (mg 100 mL-1) 63.9 64.6 66.6 65.3 63.1 65.5 62.7 65.5 69.9 ns
TSS (oBrix) 14.1 12.9 14.4 12.9 13.0 13.6 12.4 12.6 12.9 ns
Total titratable acidity (g
citric acid 100 mL-1) 0.99 1.06 0.95 1.04 1.06 1.02 1.10 1.10 1.09
**(5)
Ratio 14.3 12.9 14.4 12.9 13.0 13.6 12.4 12.6 12.9 *(6) Total N in leaf (%) 2.57 2.58 2.71 2.62 2.60 2.74 2.74 2.74 2.67 ns
(1)y=30.38-0.0997x, R2=0.21; (2)y=128.85-0.4237x, R2=0.19; (3)y=10.63-0.0056x, R2=0.44; (4)y=9.68-0.0052x, R2=0.13; (5)y=0.99+0.0007x,
of budding and flowering (spring) of citrus, a period coinciding with the application of fertilizers, to the decreased activity or the roots. LEGAZ et al. (1995) observed that 70% of the N reported in early leaves and branches derived from the plant’s internal reserves. Consequently, the increase of the content of N in the soil increases its losses and decreases the utilization efficiency of N by plants (DE PAZ & RAMOS, 2004).
Decrease in TSS contents in fruits derived from plants submitted to application of higher N doses to the soil is usually attributed to the dilution of sugars, due to the increased weight or fruit diameter, or yet by the competition for assimilates between shoots and fruits (FERGUSON & BOYD, 2002). It may even have contributed to the dilution of N inside the plants, since there was no increase of it in their fully mature leaves. This is a possible explanation because there was no statistical increase in weight and fruit diameter (Table 1). There are fluctuations in the average values of 238.3g in fruits of plants grown without nitrogen fertilization up to average values above 250g in plants grown with the N application such as those subjected to the addition of 80 to 120kg N ha-1. TSS values correspond mainly to soluble
sugars, organic acids and inorganic salts (WILLS et al., 1981). Together with the ratio value, pH and total titratable acidity, they can be used to evaluate the state of ripening of fruits and the definition of the harvest time. However, also based on TSS values, it can be inferred that the taste of the fruits changed with the dose of N supplied to the plants, which may affect consumer acceptability.
In the 2011/2012 crop season, the doses of N applied to the plants did not affect the fruit yield, number of fruits per plant, fresh fruit weight, fruit diameter, peel thickness, juice content, total nitrogen content in leaves, ascorbic acid and TSS content in the juice (Table 1). This might be attributed to the absorption by plants, such as those grown without the addition of N fertilizer, of N derived from other sources such as from the N mineralization soil labile organic matter and from decomposing residues in the inter-row soil surface, such as senescent and pruned leaves and roots inside the soil (BRUNETTO et al., 2011; 2014). This is suggested because there was an adequate distribution of rainfalls, especially during the citrus growing period (Figure 1). This explanation can also be applied to the biological N fixation made by native leguminosae that cohabited the rows of the grove and to the release of N contained in its
decomposing residue at the soil surface or even in senescent roots inside the soil (DASBERG, 1987).
The total titratable acidity in the juice increased according to the N dose, which was reflected in ratio values (Table 1). These results further reinforce previous results on vines obtained by BRUNETTO et al. (2007), who attributed this to the shoot vegetative growth, causing an increase in fruit shading inside plants, slowing the ripening and the degradation of organic acids in the fruit. This likely stimulation of shoot vegetative growth according to the increase of the N dose in the soil may have caused the dilution of N inside the plant. An increase of its content in mature leaves was not observed (Table 1), as well as in the 2011/2012 crop. Based on these results, it is possible to infer that the fruits of plants subjected to higher N doses are more acidic.
Regarding fruit peel color, there was a similar response in both crop seasons (2010/2011 and 2011/2012) to chroma parameters (C), which were not influenced by the dose of N applied, and hue angle (H°), which increased with higher N doses (Table 2). The values recorded for H° mean that the fruit epidermis color was between yellow and red. In fruits from plants subjected to the lowest N doses the epidermis tended more to a red color and plants with the application of the highest doses of N showed a more yellowish epidermis. In both crop season, the determination coefficient was low (r2=0.10), meaning that only 10% of the change in
6 Brunetto et al.
parameter of fruit quality, i.e., juice color, was not altered by the N fertilization in both crops.
CONCLUSION
In the first crop, especially fruit yield, number of fruits per plant, TSS content in fruit juice and ratio decreased with increasing N rate applied in orange trees cv. ‘Lane Late’. However, in the second crop, the total titratable acidity of the fruit juice prominently increased with the higher N rates applied. In both crops, the results were highly influenced by rainfall distribution, which affected the plant physiology, soil N dynamics and consequently the probability of response to N applied and the loss of mineral N in the soil.
ACKNOWLEDGEMENTS
The authors thanks Conselho Nacional de
Desenvolvimento Científico e Tecnológico (CNPq) for its financial
support. The first, sixth and seventh authors thank the CNPq for research grants.
REFERENCES
ALMEIDA, S.C. et al. Economic analysis of citrus Rosário do
Sul/RS: a focus on the adoption of environmental certification
program. Revista Eletrônica em Gestão, Educação e Tecnologia
Ambiental, v.11, p.2427-2436, 2013. Available from: <http:/
dx.doi.org/10.5902/223611708803>. Accessed: May 05, 2015. doi: 10.5902/223611708803.
BOARETTO, R.M. et al. Absorption of 15NH
3 volatilized from urea by
Citrus trees. Plant and Soil, v.365, p.283-290, 2013. Available from: Table 2 - Fruit peel color and orange fruit juice (cv. ‘Lane Late’) subjected to N fertilization.
N (kg ha-1 year-1)
---Color parameters---
---Epidermis--- ---Juice
---L C Ho L C Ho
0 69.7 73.8 72.9 69.3 59.6 82.9
20 70.2 73.0 73.3 68.5 58.7 83.7
40 70.6 73.4 74.6 68.6 58.3 84.6
60 70.9 73.6 74.7 67.2 58.9 84.7
80 70.4 72.9 74.8 66.1 59.3 84.9
100 71.1 74.4 73.3 67.3 58.6 83.9
120 70.8 72.5 74.2 67.7 58.6 84.7
140 71.4 74.7 74.4 67.6 58.6 84.4
160 72.0 74.5 75.6 67.7 56.6 83.7
Significant ** ns * ns ns ns
Equation y=69.9+0.011x - y=73.3+0.011x - - -
r2 0.33 - 0.10 - - -
CV (%) 1.23 2.50 2.34 3.11 5.13 1.58
0 67.1 72.5 69.1 69.3 60.4 83.4
20 67.1 71.9 70.4 69.9 62.8 83.4
40 67.7 73.6 69.8 70.8 62.0 84.0
60 68.2 72.0 72.1 70.3 63.2 83.8
80 67.4 73.2 71.3 70.2 61.9 82.9
100 67.3 72.2 69.7 70.3 62.1 83.5
120 67.7 72.1 70.4 69.9 63.0 83.4
140 68.4 70.5 72.4 69.9 61.6 83.1
160 67.9 71.4 71.3 70.7 60.7 83.1
Significant ns ns ** ns ns ns
Equation - - y=69.8+0.012x - - -
r2 - - 0.10 - - -
CV (%) 2.58 2.16 2.40 1.41 2.55 0.70
<http:/dx.doi.org/10.1007/s11104-012-1380-7>. Accessed: Nov. 18, 2016. doi: 10.1007/s11104-012-1380-7.
BRUNETTO, G. et al. Application of nitrogen in grapevines in the campaign of the Rio Grande do Sul: productivity and chemical characteristics of the grape must. Ciência Rural, v.37, p.389-393, 2007. Available from: <http://dx.doi.org/10.1590/S0103-84782007000200014>. Accessed: May 04, 2014. doi: 10.1590/ S0103-84782007000200014.
BRUNETTO, G. et al. Nutrients release during the decomposition of mowed perennial ryegrass and white clover and its contribution to nitrogen nutrition of grapevine. Nutrient Cycling in
Agroecosystems, v.90, p.299-308, 2011. Available from: <http:/
dx.doi.org/10.1007/s10705-011-9430-8>. Accessed: Nov. 18, 2016. doi: 10.1007/s10705-011-9430-8.
BRUNETTO, G. et al. Use of the SPAD-502 in estimating nitrogen content in leaves and yield in grapevines in soils with different texture. American Journal of Plant Sciences, v.3, p.1546-1561, 2012. Available from: <http:/dx.doi.org/10.4236/ ajps.2012.311187>. Accessed: Nov. 18, 2016. doi: 10.4236/ ajps.2012.311187.
BRUNETTO, G. et al. Contribution of nitrogen from agricultural residues of rye to ‘Niagara Rosada’ grape nutrition. Scientia
Horticulturae, v.169, p.66-70, 2014. Available from: <http:/
dx.doi.org/10.1016/j.scienta.2014.02.019>. Accessed: Nov. 18, 2016. doi: 10.1016/j.scienta.2014.02.019.
CANTARELLA, H. et al. Fruit yield of ‘Valencia’ sweet orange fertilized with different N sources and the loss of applied N. Nutrient Cycling in Agroecosystems, v.67, p.215-223, 2003. Available from: <http:/dx.doi.org/10.1023/ B:FRES.0000003600.20499.76>. Accessed: Nov. 18, 2016. doi: 10.1023/B:FRES.0000003600.20499.76.
COMISSÃO DE QUÍMICA E FERTILIDADE DO SOLO - RS/
SC. Manual de adubação e calagem para os Estados do Rio
Grande do Sul e de Santa Catarina. 10.ed. Porto Alegre: SBCS
- Núcleo Regional Sul/UFRGS, 2004. 400p.
COUTO, M.A.L.; CANNIATTI-BRAZACA, S.G. Quantification
of vitamin C and antioxidant capacity of citrus varieties. Ciência
e Tecnologia de Alimentos, v.30, p.15-19, 2010. Available
from: <http://dx.doi.org/10.1590/S0101-20612010000500003>. Accessed: May 04, 2014. doi: 10.1590/S0101-20612010000500003.
DASBERG, S. Nitrogen fertilization in citrus orchards. Plant
and Soil, v.100, p.1-9, 1987. Available from: <http:/dx.doi.
org/10.1007/BF02370928>. Accessed: Nov. 18, 2016. doi: 10.1007/BF02370928.
DAVIES, F.S.; ALBIGO L.G. Citrus. 2.ed. Wallingford: CAB international, 1994. 254p.
DE PAZ, J.M.; RAMOS, C. Simulation of nitrate leaching for different nitrogen fertilization rates in a region of Valencia
(Spain) using a Gis-Gleams system. Agriculture, Ecossystems &
Environment, v.103, p.59-73, 2004. Available from: <http:/dx.doi.
org/10.1016/j.agee.2003.10.006>. Accessed: Nov. 18, 2016. doi: 10.1016/j.agee.2003.10.006.
FERGUSON, I.B.; BOYD, L.M. Inorganic nutrients and fruit quality. In: KNEE, M. Fruit quality and its biological basis. Ohio: Wiley Blackwell, 2002. Cap.2, p.17-45.
HUFF, A. Nutritional control of regreening and degreening in citrus peel segments. Plant Physiology, v.73, p.243-249, 1983. Available from: <http:/dx.doi.org/10.1104/pp.73.2.243>. Accessed: Nov. 18, 2016. doi: 10.1104/pp.73.2.243.
INSTITUTO ADOLFO LUTZ. Métodos físico-químicos para
análise de alimentos. São Paulo: Instituto Adolfo Lutz, 2008. 1020p.
LEGAZ, F. et al. Mobilization of the reserve N in citrus. Plant
and soil, v.173, p.205-210, 1995. Available from: <http:/dx.doi.
org/10.1007/BF00011457>. Accessed: Nov. 18, 2016. doi: 10.1007/BF00011457.
LIMA, L.C. et al. Quality of the ‘Ponkan’ tangerine tree fruits (Citrus reticulata Blanco), stored at room temperature. Revista
da Universidade de Alfenas, v.5, p.27-31, 1999. Available from:
<http://www.unifenas.br/pesquisa/download/ArtigosRev1_99/ pag27-31.pdf>. Accessed: Nov. 18, 2016.
LORENSINI, F. et al. Lixiviation and volatilization of nitrogen in Sandy Typic Hapludalf soil cultivated with grapevine submitted to the nitrogen fertilization. Ciência Rural, v.42, p.1173-1179, 2012. Available from: <http://dx.doi.org/10.1590/S0103-84782012005000038>. Accessed: Jun. 08, 2016. doi: 10.1590/ S0103-84782012005000038.
MAGALHÃES, A.F. de J. Nutrição mineral e adubação dos
citros irrigados. Cruz das Almas: EMBRAPA, 2006. 12p.
(Circular Técnica 79).
MAUST, B.E.; WILLIAMSON, J.G. Nitrogen nutrition of containerized citrus nursery plants. American Society for
Horticultural Science, v.119, p.195-201, 1994. Available from:
<http://journal.ashspublications.org/content/119/2/195.full.pdf>. Accessed: Nov. 18, 2016.
PEREIRA, I.S. et al. Nitrogen fertilization and agronomic characteristics in blackberry. Pesquisa Agropecuária Brasileira, v.48, p.373-380, 2013. Available from: <http://dx.doi.org/10.1590/ S0100-204X2013000400004>. Accessed: May 04, 2014. doi: 10.1590/S0100-204X2013000400004.
TEDESCO, M.J. et al. Análises de solo, plantas e outros
materiais. Porto Alegre: UFRGS/Departamento de Solos, 1995.
174 p. (Boletim Técnico 5).