ABSTRACT: The most southern Brazilian state, Rio Grande do Sul, is characterized by high crop yield and is, currently, the third leading
soybean producer in the country. Therefore, agriculture is very important
to the economy of the region. Because agriculture is highly dependent
on variable weather parameters, the present study aimed to test the
Temperature-Vegetation Dryness Index (TVDI) as a regional indicator
of water status under the climate and soybean crop management
conditions that predominate in northwestern Rio Grande do Sul. For
this, soybean crop seasons with contrasting yields were selected:
2004 – 2005 (yield 0.5 t·ha–1) and 2009 – 2010 (2.7 t·ha–1). TVDI was obtained from the surface temperature (TS) and Normalized Difference
AGROMETEOROLOGY -
Article
TVDI spatiotemporal pattern of a soybean
growing area in humid subtropical climate
Lucimara Wolfarth Schirmbeck1*, Denise Cybis Fontana2, Juliano Schirmbeck1
1. Universidade Federal do Rio Grande do Sul - Centro Estadual de Pesquisas em Sensoriamento Remoto e Meteorologia - Porto Alegre (RS), Brazil.
2. Universidade Federal do Rio Grande do Sul - Faculdade de Agronomia - Departamento de Plantas Forrageiras e Agrometeorologia - Porto Alegre (RS), Brazil.
*Corresponding author: [email protected]
Received: May 18, 2016 – Accepted: Nov. 8, 2016
Vegetation Index (NDVI) images available from MODIS products, which
were correlated to obtain a triangular scatter plot. Rainfall data from
surface weather stations were also used. The results showed that
the pattern of the TVDI is associated with rainfall variability. However,
as the TVDI is based on normalization of the wet and dry edges of
each image individually, the comparison of TVDI values across different
images is challenging. This deficiency can be mitigated by analysis
of the parameters used to derive the index. Therefore, both the TVDI
and the “b” and TSmin parameters used to derive it can elucidate the patterns of crop response to water availability.
INTRODUCTION
The most southern state in Brasil, Rio Grande do Sul, is characterized by a significant grain production, and soybean crop, which takes place in the spring/summer period, occupies the largest area (IBGE 2016). Despite the average annual increase of soybean production in the state, the harvest varies greatly among crop seasons. This high variability is especially determined by two main risk factors inherent to agricultural activity that are not controlled by the producer: market and climatic adversities.
Regarding to climatic adversities, several studies have shown that rainfall from December to March is the isolated weather element that has the greatest impact on soybean yield in Rio Grande do Sul (Berlato and Fontana 1999; Fontana et al. 2001). This results from the fact that, in a largely non-irrigated agriculture activity, rainfall is the only water supply to the system and, therefore, associated with water availability for the crop. Water restrictions, especially during blooming and grain filling, hinder crop development and yield (Zanon et al. 2016). The Temperature-Vegetation Dryness Index (TVDI) has been used to determine soil moisture and water availability on a regional scale (Sandholt et al. 2002; Gao et al. 2011; Holzman et al. 2014). It is potentially an important monitoring tool for agriculture. The TVDI is calculated directly based on the synergy between surface temperature and vegetation index derived from satellite images and does not require measurements of surface weather elements. The relationship between the surface temperature (TS) and vegetation index
(VI) often generates a triangular or trapezoidal shaped dispersion (Price 1990; Carlson et al. 1994). The slope of the linear regression between TS and VI represents the
degree of stress, given the negative relationship between these 2 parameters (Nemani and Running 1989; Carlson et al. 1995; Moran et al. 1996; Fensholt and Sandholt 2003; Venturini et al. 2004; Wang et al. 2007; Holzman et al. 2014). The trapezoid or triangle shaped dispersion depends on the availability of the water content in the soil. The trapezoidal shape tends to occur more often in hot climates with high vegetation cover (Carlson 2007). The moderate resolution imaging spectroradiometer (MODIS) sensor, aboard the Terra platform, provides images of the surface temperature (MOD11A2) and
vegetation index (MOD13A2) with temporal resolution of 8 and 16 days, respectively. These products enable monitoring crop development cycle over time, calculating TVDI, which can be used to define water availability. Both indicators are key to agricultural monitoring systems.
Several studies have using the TVDI determined from the MODIS sensor images (Chen et al. 2011; Son et al. 2012; Holzman et al. 2014). The results have been used to plan and manage the water resources to mitigate impacts on agriculture, as well as for crop monitoring and forecasting. Sandholt et al. (2002) proposed to use the Normalized Difference Vegetation Index (NDVI) to calculate the TVDI; and several subsequent studies have used the TS and NDVI relationship (Gao et al. 2011;
Chen et al. 2011; Son et al. 2012).
This study aimed at testing the TVDI as an indicator of regional water availability, considering the climate and soybean crop management conditions that predominate in northwestern part of Rio Grande do Sul. The specific objectives were to characterize the shape of the TS and
NDVI relationship as well as to analyze the sensitivity of the relationship parameters to calculate the TVDI and to determine water availability.
MATERIAL AND METHODS
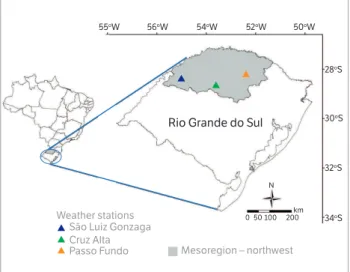
The study area is located in the mid-northwestern Rio Grande do Sul state, which is characterized by large volume of grain production (Figure 1). Agriculture in this
Figure 1. Location of the study area and used meteorological stations. Rio Grande do Sul State, Brazil.
Weather stations São Luiz Gonzaga Cruz Alta
Passo Fundo Mesoregion – northwest
Rio Grande do Sul
200 km N
100 50
28oS
50oW
52oW
54oW
56oW
55oW
30oS
32oS
region is the base of the economy, with approximately 6.5 million ha of the total area according to the base map of IBGE (2010), including the municipalities with the highest yield in the state. The average grain yield was 2.6 million ha between 2000 and 2012, with an average yield of 2 t·ha–1. Soybean is the main spring-summer
crop in terms of cultivated area and economic return to farmers in this region.
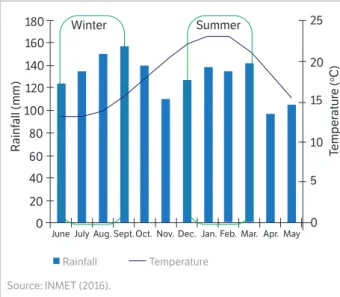
The study area is located in the northern half of the state, where the rainfall in the summer ranges from 350 to 550 mm, which on average is not enough to supply the water demand of soybean crops (Matzenauer et al. 2011). In the summer (December to March), the average temperatures (above 22 °C) are higher than in the winter (below 18 °C, but above –3 °C), from June to September. There is no dry season in the state, and rainfall is higher than 60 mm every month of the year (Figure 2). In consequence, the study area is classified as “Cfa”, according to Köppen (1948), with hot summers.
The TVDI was calculated (Equation 1) as proposed by Sandholt et al. (2002):
There were used TS and NDVI data originated from the
MODIS, MOD11A2, and MOD13A2 products, with spatial resolution of 1,000 m corresponding to composition periods of 8 and 16 days, respectively. The data covering the study area were downloaded from the Land Processes database - Distributed Active Archive Center (LPDAAC 2015) product tile h13v11, which were transformed from the sinusoidal projection to WGS 84 geographic coordinates. The images were cut according to the boundaries of the study area, and a mask was applied to the soybean cultivation area of the equivalent crop.
The TS and NDVI images were correlated to obtain the
TVDI (Figure 3), resulting in a dispersion pattern which can assume a triangular or trapezoidal shape, depending on the existing biomass and soil moisture content (Price 1990; Sandholt et al. 2002). The index is calculated from a normalized format that varies between 0 and 1 for each image. More distant dispersion points represent a very small percentage of the entire dataset and they may correspond to anomalous surfaces including water and clouds. These points, which are close to the dry or wet edges, were discarded from the analysis as recommended by Carlson (2007).
The TSmin was calculated by the average of the minimum
temperatures, corresponding to the wet edge. The parameters “a” and “b” are the linear and angular coefficients of the straight line, respectively, and represent the dry edge. They were obtained from the NDVI and Ts scatterplot and used to
normalize the model. In this study, TSmin and the parameters
“a” and “b” were determined for each one of the 12 images that include the 2 analyzed crop seasons.
The 2004 – 2005 and 2009 – 2010 crop seasons with contrasting soybeans yields of 0.5 and 2.7 t·ha–1, respectively,
0
June July Aug. Sept. Oct. Nov. Dec. Jan. Feb. Mar. Apr. May 20
40 60 80 100 120 140 160
180 Summer 25
Rainfall Temperature Winter
20
15
10
5
0
Source: INMET (2016).
R
ainf
all (mm)
Temper
atur
e (
oC)
S
urf
ac
e t
emper
atur
e
Normalized Difference Vegetation Index Wet edge
Dry edge Bare
soil
Partial cover
Full cover
Source: adapted from Sandholt et al. (2002).
where: TS is the observed surface at the given pixel
(K); TSmin is the minimum surface temperature (K),
corresponding to wet edge of the evaporative triangle; “a” and “b” are linear and angular coefficients of the straight line representing the dry edge.
TVDI = (TS – TSmin)/(a + b × NDVI – TSmin) (1)
Figure 2. Normal monthly rainfall and monthly average temperature
were chosen for the analysis. The lower yields recorded in 2004 – 2005 resulted from lower rainfall and average temperatures slightly higher than those registered in January and February (Table 1), compared to the Climatological Normal and those observed in 2009 – 2010.
Only the soybean crops were analyzed, so the crop area was determined by the method that utilizes the difference between the NDVI at the maximum development minus NDVI at implantation, as proposed by Santos et al. (2014). To this end, the pixels that showed in the image differences greater than 0.30 and 0.39 for the 2004 – 2005 and 2009 – 2010 harvests, respectively, were considered soybeans. The criterion for determining this threshold was to obtain a farming area nearby a crop area divulged by the IBGE (2016) for each crop.
The rainfall data were obtained from three weather stations (Figure 1), belonging to the Instituto Nacional de Meteorologia (INMET), located in major grain producer areas. Subsequently, the data were grouped in 16-day periods to become compatible with the timescale of MODIS images.
The TVDI and NDVI data were used to analyze the results originated for the 2 crop seasons, initially, extracted from the soybean growing areas in 5 × 5 pixel windows centered on the coordinates of the 3 weather stations, and posteriorly for the entire area mapped as soybean crop in northwestern Rio Grande do Sul.
Two images with different water conditions were chosen: one, with water deficit (2/18/2005) and another, in wet conditions (3/6/2010) to analyze the TVDI pattern, the index parameters, and rainfall. Finally, the NDVI, TVDI and “b” and TSmin parameters were correlated with rainfall
by scatterplots.
RESULTS AND DISCUSSION
The dynamics of the soybean crop development in the study area can be evaluated looking at the pattern of NDVI over time (Figure 4). The observed pattern is typical of annual crops and consistent with what is expected for
Average air temperature (°C) Total rainfall (mm)
Occurred Climatological normal Occurred Climatological normal
2004 – 2005 2009 – 2010 1961 – 1990 2004 – 2005 2009 – 2010 1961 – 1990
Cruz Alta 24.1 23.8 23.2 134.1 409.9 256.0
Passo Fundo 22.6 23.0 22.05 132.6 230.1 315.5
São LuizGonzaga 26.0 25.9 24.7 190.5 643.6 281.6
Table 1. Average air temperature and accumulated rainfall in January and February for the 2004 – 2005 and 2009 – 2010 harvests and climatological normal.
Source: INMET (2016)
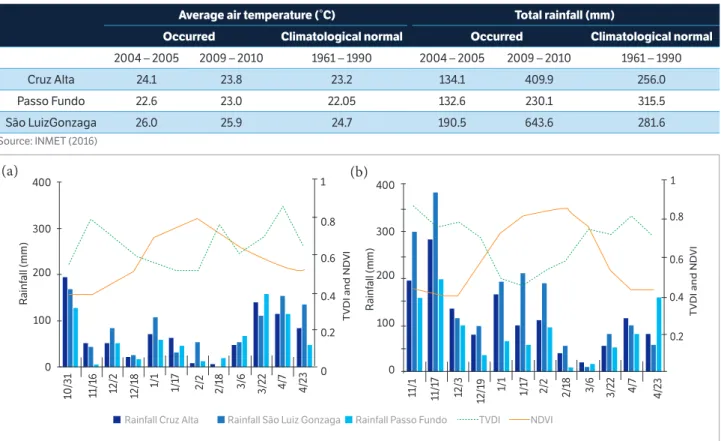
Figure 4. Temporal profile of the Temperature-Vegetation Dryness Index (TVDI) and the Normalized Difference Vegetation Index (NDVI) in northwestern Rio Grande do Sul and rainfall in the weather stations of Cruz Alta, São Luiz Gonzaga, and Passo Fundo, Brazil, in the 2004 – 2005 (a) and 2009 – 2010 (b) crops.
10/
31
11
/16
12
/2
12
/1
8
1/1 1/17 2/2 2/1
8
3
/6
4
/7
4
/2
3
4
/2
3
3
/2
2
1/1 1/17 2/2
12
/1
9
12
/3
11
/17
11
/1
2
/1
8
3
/6
4
/7
3
/2
2
400
300
200
100
R
ainf
all (mm)
0
400
300
200
100
R
ainf
all (mm)
0 1
0.8
0.6
0.4
0.2
0
TVDI and ND
VI
TVDI and ND
VI
1
0.8
0.6
0.4
0.2
Rainfall Cruz Alta Rainfall São Luiz Gonzaga Rainfall Passo Fundo TVDI NDVI
the region (Fontana et al. 2015), allowing to track the differences regarding the temporal evolution of the green biomass of soybean over the 2 crop seasons. The analysis of crop development against the critical periods of the cycle allows interpreting the responses of soybean plants to environmental conditions.
NDVI was low in November, associated with low green biomass coverage upon crop implantation (recommended sowing data is between October 11 and December 31, according Cunha et al. 2001). NDVI increased gradually as the biomass also increased up to the blooming stage, reducing again at the end of the cycle. These data are coherent since the average crop cicle is about 140 days (Thomas and Costa 2010). The highest NDVI values were observed from January to March, associated with the higher density of crops green biomass. At blooming, soybeans reach maximum leaf area index, maximum capacity to intercept solar radiation, and photosynthesis, thus causing NDVI to peak. In the 2004 – 2005 and 2009 – 2010 crop seasons, the highest NDVI were 0.79 and 0.85, respectively, both in February, coinciding with blooming that usually occurs in February (Fontana et al. 2015). The variations observed between years indicate different conditions for crop growth and development and may be used for estimating yield models. The highest NDVI values in the 2009 – 2010 crop were consistent with the highest yield of 2.7 t·ha–1 compared to 0.5 t·ha–1 in the 2004 – 2005 crop.
On the other hand, the TVDI (Figure 4) showed a similar temporal pattern for both crops seasons. High values were observed at the beginning and end of the cycles, contrary to the NDVI pattern, which are partly due to the biomass capacity to control the evapotranspiration process. The values greater than 0.8 observed during these periods can be attributed to bare soil (beginning of cycle) and/or senescent vegetation (end of cycle) that cause lower evaporation rate and higher soil temperature (Wang et al. 2007). On the other hand, TVDI decreased during the higher vegetative growth period (blooming and grain formation) which, associated with an increased transport of water by the plants into the atmosphere, indicated more appropriate water conditions, but with important differences between the 2 seasons.
The rainfall was higher in the 2009 – 2010 crop season (Figure 4b), which can influence the TVDI, especially during the period of higher vegetative growth. The index dropped more sharply in January in the 2009 – 2010 crop compared to the 2004 – 2005 one, reaching a minimum 0.45 and 0.52, respectively. The index increased rapidly in February in the
2004 – 2005 crop season (Figure 4a). This increase coincides with the period when large water deficit is observed more often in the region, as a result of increased atmospheric evaporative demand and higher water consumption by the plants (Matzenauer et al. 2002; Mundstock and Thomas 2005).
Therefore, TVDI responded to the biomass variability in the study area while the rainfall caused fluctuations of the TVDI profile along soybean development period. Nevertheless, the scatter-plot analysis between the cumulative rainfall and TVDI (Figure 5) presented high variability while TVDI did not display significant increasing trend with decreasing rainfall.
400
300
200
100
0
0.2 0.4 0.6 0.8 1
TVDI – Cruz Alta
R
ainf
all (mm)
400
300
200
100
0
0.2 0.4 0.6 0.8 1
TVDI – São Luiz Gonzaga
R
ainf
all (mm)
400
300
200
100
0
0.2 0.4 0.6 0.8 1
TVDI – Passo Fundo
Crop 2004 – 2005 Crop 2009 – 2010 Linear tendency
R
ainf
all (mm)
This apparent inconsistency can be explained by the fact that the TVDI calculation is based on the normalization of wet and dry edges that are applied individually for each image, making the comparison of the index values between different images and/or crops more challenging.
It is noteworthy that using the TVDI normalized for each image is more common in the literature (Gao et al. 2011; Holzman et al. 2014; Liang et al. 2014). Moreover, this is critical to the use of TVDI for crop monitoring purposes and can sometimes be misinterpreted. This deficiency, however, can be minimized by analyzing the parameters that determine the dry and wet edges of the evaporative triangle, which are rather comparable between different images or crop seasons.
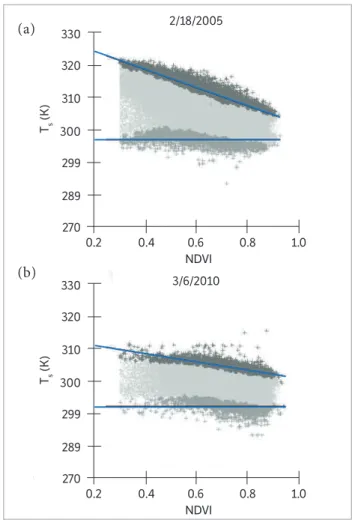
As an example, Figure 6 shows the triangles obtained in two different days, with low (2/18/2005) and high (3/6/2010) water availability. On 2/18/2005, the greater
negative slope of the dry edge corresponds to higher temperature pixels for each NDVI (Sandholt et al. 2002). The NDVI/TS slope has been associated with
the resistance of the stomata and evapotranspiration surface (Nemani and Running 1989). Steepening can be interpreted as a greater contrast between dry (non-irrigated, higher temperature) and wet ((non-irrigated, lower temperature) areas.
The straight line of the wet threshold corresponds to the number of cooler pixels, which is a result of increased water content (Carlson et al. 1994; Sandholt et al. 2002). As expected, on 2/18/2005 (Figure 6a), the average minimum temperature was close to 24 °C, higher than that observed for more humid conditions (Figure 6b) of about 19 °C, demonstrating the relationship between water and thermal conditions.
The TVDI distribution in the study area for these 2 images can be seen in Figure 7. Red represents the highest indices worst water conditions, which predominate in much of the northwestern area of the state. It is important to emphasize that, when using normalization by image, it is possible to differentiate spatially different water
Figure 6. Dispersion between the Normalized Difference Vegetation
Index (NDVI) and surface temperature (TS) on 2/18/2005 (a) and
3/6/2010 (b) in northwestern Rio Grande do Sul, Brazil.
0.2 0.4 0.6
NDVI 2/18/2005
Ts
(K
)
270 289 299 300 310 320 330
0.8 1.0
0.2 0.4 0.6
NDVI 3/6/2010
Ts
(K
)
270 289 299 300 310 320 330
0.8 1.0
28oS
29oS
55oW 54oW 53oW 52oW
28oS
29oS
55oW
0.0 0.2 0.4 0.6 0.8 1.0
TVDI
54oW 53oW 52oW
3/6/2010 2/18/2005
Figure 7. Temperature-Vegetation Dryness Index (TVDI) on 2/18/2005 (a) and 3/6/2010 (b) in northwestern Rio Grande do Sul, Brazil.
(a)
(a)
(b)
conditions in the soy-producing region of the studied areas, but they should not be compared between dates and harvests.
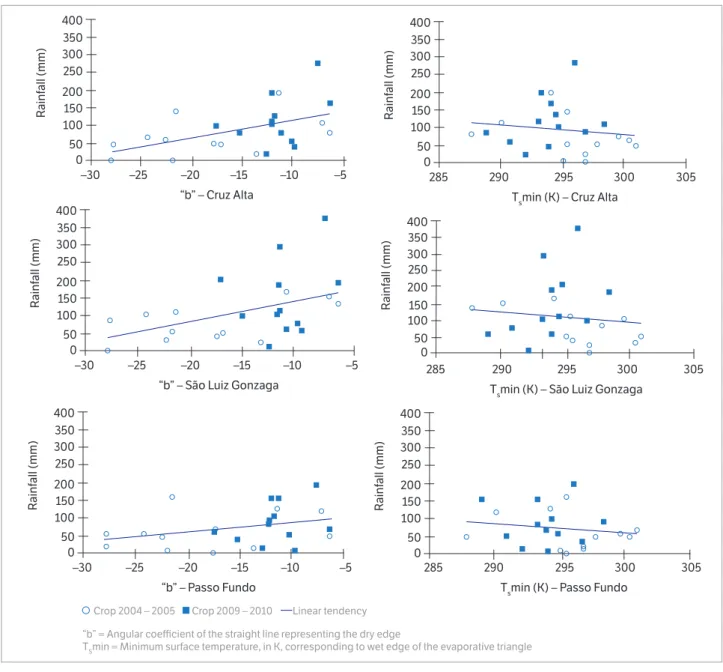
The dispersion between rainfall and TSmin data and
the slope of the straight-line “b” (Figure 8) shows a reverse trend, as TSmin decreases and “b” increases,
rainfall increases as well. The increase of “b”, dry edge straight line with less negative slope, is due to the fact that for higher rainfall, the incidence of warmer pixels decreases especially for smaller vegetation cover (NDVI) (Carlson et al. 1994; Sandholt et al. 2002). The lower TSmin results from the greater water availability in the
soil, enabling the vegetation to control the temperature better (Sandholt et al. 2002).
It is noteworthy that, contrary to what is often seen in the literature, it is not appropriate to use the parameterized TVDI for image to compare water availability in different dates, an important limitation of the index. However, it is possible to minimize this limitation by using the TVDI calculated parameters. However, in this case, there is another important constraint, associated with loss of information related to the spatial variability of the index in the area to be monitored, which is certainly one of the main advantages of using satellite images.
Crop 2004 – 2005 Crop 2009 – 2010 Linear tendency
400 350 300 250
200 150 100 50 0
–30 –25
“b” – Passo Fundo
R
ainf
all (mm)
–20 –15 –10 –5
400 350 300 250
200 150 100 50 0
R
ainf
all (mm)
400 350 300 250
200 150 100 50 0
–30 –25
“b” – São Luiz Gonzaga
R
ainf
all (mm)
–20 –15 –10 –5
400 350 300 250 200 150 100 50 0
R
ainf
all (mm)
400 350 300 250
200 150 100 50 0
–30 –25
“b” – Cruz Alta
R
ainf
all (mm)
–20 –15 –10 –5
400 350 300 250 200 150 100 50 0
285 290
Tsmin (K) – Cruz Alta
R
ainf
all (mm)
295 300 305
285 290
Tsmin (K) – São Luiz Gonzaga
295 300 305
285 290
Tsmin (K) – Passo Fundo
295 300 305
“b” = Angular coefficient of the straight line representing the dry edge
TSmin = Minimum surface temperature, in K, corresponding to wet edge of the evaporative triangle
CONCLUSION
In the rainy subtropical climate conditions that prevail in Rio Grande do Sul, the dispersion between TS
and NDVI assumes a triangular shape (the evaporative triangle). The parameters defining this triangle, which are used to calculate the TVDI, are associated with water conditions prevalent in regions.
In each image or the date, the TVDI highlights the differences in water availability that occur in the
assessed region, which are partly associated with the spatiotemporal variability of rainfall.
However, the TVDI is based on the parameterization of the wet and dry edges that are applied to each image individually, the comparison of index values between different dates or crop seasons becomes complex.
In the comparisons between dates or crops, it is recommended to use the information contained in the parameters “b” and TSmin, used to calculate the index,
which can be indicators of water availability over time.
Berlato, M. A. and Fontana, D. C. (1999). Variabilidade interanual da precipitação pluvial e rendimento da soja no Estado do Rio Grande do Sul. Revista Brasileira de Agrometeorologia, 7, 119-125.
Carlson, T. N. (2007). An Overview of the “Triangle Method” for Estimating Surface Evapotranspiration and Soil Moisture from
Satellite Imagery. Sensors, 7, 1612-1629. http://dx.doi.org/10.3390/
s7081612.
Carlson, T. N., Gillies, R. R. and Perry, E. M. (1994). A Method to Make Use of Thermal Infrared Temperature and NDVI measurements to Infer Surface Soil Water Content and Fractional Vegetation
Cover. Remote Sensing Reviews, 9, 161-173. http://dx.doi.org/
10.1080/02757259409532220
Carlson, T. N., Gillies, R. R. and Schmugge, T. J. (1995). An interpretation of methodologies for indirect measurement of soil water content. Agricultural and Forest Meteorology, 77, 191-205. http://dx.doi.org/10.1016/0168-1923(95)02261-U.
Chen, J., Wang, C. Z., Jiang, H., Mao L. X. and Yu Z. R. (2011). Estimating soil moisture using temperature-vegetation dryness index (TVDI) in the Huang-huai-hai (HHH) plain. International
Journal of Remote Sensing, 32, 1165-1177. http://dx.doi.org/
10.1080/01431160903527421.
Cunha, G. R., Barni, N. A., Haas, J. C., Maluf, J. R. T., Matzenauer, R., Pasinato, A., Pimentel, M. B. M. and Pires, J. L. F. (2001). Zoneamento agrícola e época de semeadura para soja no Rio Grande do Sul. Revista Brasileira de Agrometeorologia, 9, 446-459.
Fensholt, R. and Sandholt, I. (2003). Derivation of a shortwave infrared water stress index from MODIS near-and shortwave infrared data in a semiarid environment. Remote Sensing of Environment,
87, 111-121. http://dx.doi.org/10.1016/j.rse.2003.07.002.
REFERENCES
Fontana, D. C., Berlato, M. A., Lauschner, M. H. and Mello, R. W. (2001). Modelo de estimativa de rendimento de soja no Estado
do Rio Grande do Sul. Pesquisa Agropecuária Brasileira, 36,
399-403. http://dx.doi.org/10.1590/S0100-204X2001000300001.
Fontana, D. C., Pinto, D. G., Junges, A. H. and Bremm, C. (2015).
Inferências sobre o calendário agrícola a partir de perfis temporais
de NDVI/MODIS. Bragantia, 74, 350-358. http://dx.doi.org/
10.1590/1678-4499.0439.
Gao, Z., Gao, W. and Chang, N. (2011). Integrating temperature
vegetation dryness index (TVDI) and regional water stress index (RWSI) for drought assessment with the aid of LANDSAT TM/
ETM+ images. International Journal of Applied Earth Observation
and Geoinformation, 13, 495-503. http://dx.doi.org/10.1016/
j.jag.2010.10.005.
Holzman, M. E., Rivas, R. E. and Piccolo, M. C. (2014). Estimating
soil moisture and the relationship with crop yield using surface
temperature and vegetation index. International Journal of Applied Earth Observation and Geoinformation, 28, 181-192.
http://dx.doi.org/10.1016/j.jag.2013.12.006.
Instituto Brasileiro de Geografia e Estatística (2010). Base de
dados cartográfica; [accessed 2014 Sept 20]. ftp://geoftp.ibge.
gov.br/malhas_digitais/municipio_2010/
Instituto Brasileiro de Geografia e Estatística (2016). Levantamento
sistemático da produção agrícola; [accessed 2016 Oct 04]. http://
www.sidra.ibge.gov.br/
Instituto Nacional de Meteorologia (2016). Banco de Dados
Meteorológicos para Ensino e Pesquisa BDMEP. [accessed
Köppen, W. (1948). Climatologia. Mexico: Fondo de Cultura Economica.
Land Processes Distributed Active Archive Center (2015). Banco de Imagens de Satélite; [accessed: 2015 Sept 20]. https://lpdaac. usgs.gov
Liang, L., Zhao, S., Qin, Z., He, K., Chen, C., Luo, Y. and Zhou, X.
(2014). Drought change trend using MODIS TVDI and its relationship with climate factors in China from 2001 to 2010. Journal of
Integrative Agriculture, 13, 1501-1508. http://dx.doi.org/10.1016/
S2095-3119(14)60813-3.
Matzenauer, R., Bergamaschi, H., Berlato, M. A., Maluf, J. R. T., Barni, N. A., Bueno, A. C., Didoné, I. A., Anjos, C. S., Machado, F. A. and Sampaio, M. R. (2002). Boletim FEPAGRO, Consumo de
água e disponibilidade hídrica para milho e soja no Rio Grande do Sul, n. 10.
Matzenauer, R., Radin, B. and Almeida, I. R. (2011). Atlas Climático: Rio Grande do Sul. Porto Alegre: Secretaria da Agricultura Pecuária e Agronegócio; Fundação Estadual de Pesquisa Agropecuária.
Moran, M. S., Rahman, A. F. and Washburne, J. C. (1996).
Combining the Penman–Monteith equation with measurements of surface temperature and reflectance to estimate evaporation rates of semiarid grassland. Agricultural and Forest Meteorology,
80, 87-109. http://dx.doi.org/10.1016/0168-1923(95)02292-9.
Mundstock, C. and Thomas, A. L. (2005). Soja: Fatores que
afetam o crescimento e o rendimento de grãos. Porto Alegre: Departamento de Plantas de Lavoura da Universidade Federal
do Rio Grande do Sul; Evangraf.
Nemani, R. R. and Running, S. W. (1989). Estimation of regional
surface resistance to evapotranspiration from NDVI and thermal IR AVHRR data. Journal of Applied Meteorology, 28, 276-284. http://dx.doi.org/10.1175/1520-0450 (1989)028%3C0276:EORS
RT%3E2.0.CO;2.
Price, J. C. (1990). Using spatial context in satellite data to infer regional scale evapotranspiration. IEEE Transactions on Geoscience and
Remote Sensing, 28, 940-948. http://dx.doi.org/10.1109/36.58983.
Sandholt, I., Rasmusen, K. and Andersen, J. (2002). A simple
interpretation of the surface temperature/vegetation index space for assessment of surface moisture status. Remote Sensing of Enviromenmt,
79, 213-224. http://dx.doi.org/10.1016/S0034-4257(01)00274-7.
Santos, J. S., Fontana, D. C., Silva, T. F. and Rudorff, B. F. T. (2014). Identificação da dinâmica espaço-temporal para estimar área
cultivada de soja a partir de imagens MODIS no Rio Grande do Sul, Revista Brasileira de Engenharia Agrícola e Ambiental, 18,
54-63. http://dx.doi.org/10.1590/S1415-43662014000100008.
Son, N. T., Chen, C. F., Chen, C. R., Chang, L. Y. and Minh, V. Q. (2012).
Monitoring agricultural drought in the Lower Mekong Basin using MODIS NDVI and land surface temperature data. International Journal of Applied Earth Observation and Geoinformation, 18,
417-427. http://dx.doi.org/10.1016/j.jag.2012.03.014.
Thomas, A. L. and Costa, J. A. (2010). Desenvolvimento da planta de soja e o potencial de rendimento de grãos. In: Evangraf. SOJA: manejo para alta produtividade de grãos. Porto Alegre: Evangraf.
Venturini, V., Bisht, G. and Islam, S. (2004). Comparison of evaporative fractions estimated from AVHRR and MODIS sensors over South
Florida. Remote Sensing of Enviromenmt, 93, 77-86. http://dx.doi.org/
10.1016/j.rse.2004.06.020.
Wang, X., Xie, H. and Guan, H. (2007). Different responses of MODIS-derived NDVI to root-zone soil moisture in semi-arid and
humid regions. Journal of Hydrology, 340, 12-24. http://dx.doi.org/
10.1016/j.jhydrol.2007.03.022.
Zanon, A. J., Streck, N. A. and Grassini, P. (2016). Climate and Management Factors Influence Soybean Yield Potential in a
Subtropical Environment. Agronomy Journal, 108, 1447-1454. http://