ISSN 2179-8087 (online)
Artigo Original
Quality Assessment of Air-dried Teakwood Boards
Using Moisture Content Gradients
Djeison Cesar Batista
1, José Tarcísio da Silva Oliveira
1, Rená Porto Pizetta
1,
Vinicius Munaldi Lube
11Departamento de Ciências Florestais e da Madeira, Universidade Federal do Espírito Santo – UFES, Jerônimo Monteiro/ES, Brasil
ABSTRACT
The determination of moisture content gradients is one of the most important steps for assessing the quality of wood drying. The general aim of this work was to study the quality of air-dried teakwood boards according to the gradients of moisture content in thickness and length. Six representative boards (40 × 180 × 2,300 mm) were sampled from a stack air-dried under shelter, divided into 30 equal parts in length and measured with a resistance moisture meter, resulting in four treatments: two depths (1/4 and 1/2 thickness) and two surfaces (inner and outer) of measurement. As main results, we can conclude that the air-drying quality can be considered good, mainly for two reasons: i) the average moisture content gradients in thickness were comparable to those reported in literature for kiln-drying of less thick boards; ii) the range of average moisture content among boards (2.5 p.p.) was satisfactory for a drying process carried out without environment control. Length moisture content gradient was completely different from that reported in literature, in which no board tops had smaller moisture content than the parts comprehended in between the tops.
Keywords: wood drying, quality control, Tectona grandis.
Avaliação da Qualidade da Secagem Natural de Tábuas de Teca
pela Utilização de Gradientes de Umidade
RESUMO
A determinação dos gradientes de umidade é uma das etapas mais importantes na avaliação da qualidade da secagem da madeira. O objetivo geral do trabalho foi estudar a qualidade da secagem natural de tábuas de teca utilizando os gradientes de umidade na espessura e no comprimento. Seis tábuas representativas (40 × 180 × 2.300 mm) foram amostradas de uma pilha de secagem natural sob cobertura, divididas em 30 partes iguais no comprimento e medidas com um medidor elétrico de umidade resistivo, resultando em quatro tratamentos: duas profundidades (1/4 e 1/2 da espessura) e duas superfícies (interna e externa) de medição. Dentre as principais conclusões, a qualidade da secagem natural pôde ser considerada boa, principalmente por dois motivos: i) os gradientes de umidade médios na espessura foram comparáveis àqueles reportados na literatura para secagem artificial de tábuas menos espessas; ii) a amplitude da umidade média entre tábuas (2,5 p.p.) foi satisfatória para um processo de secagem conduzido sem controle das variáveis ambientais. O gradiente de umidade no comprimento foi completamente diferente daqueles reportados na literatura, nos quais o topo de nenhuma tábua apresentou menor umidade do que as porções compreendidas entre os topos.
1. INTRODUCTION
Air-drying is a very common practice in Brazil, because of its low cost and favorable weather conditions along the year in the majority of country. Although air-dried lumber is considered to have worse quality than kiln-dried, due to the lack of control of the environmental factors, some low valuable products demand only this kind of drying. According to Bergman (2010), the main purpose of air drying lumber is to evaporate as much of the water as possible before end use or prior to kiln-drying.
According to the Associação Brasileira de Produtores de Florestas Plantadas – ABRAF (Brazilian Association of Producers of Planted Forests), the planted area of Tectona grandis L.f. (teak) in Brazil in 2012 was concentrated on the States of Mato Grosso, Roraima and Pará (ABRAF, 2013). According to the Indústria Brasileira de Árvores – IBÁ (Brazilian Industry of Trees) the area of teakwood in Brazil in 2013 was 88,270 hectares, which represented an increase of 31% compared to 2012 (IBÁ, 2014).
Teakwood is high valuable, native from Tropical Indian and Asian forests, and has been used in naval industry, building, furniture, flooring and decking (ABRAF, 2013). As these products demand prior drying, it is essential to understand teakwood drying behavior. Studies about drying of teakwood planted in Brazil are scarce, what motivated this study. Although there is enough literature about moisture content gradient through lumber thickness, the same cannot be said about it along the length. The literature presented has basic characteristics, and is poor in experimental data, both for moisture content gradients in thickness and in length. In general, what can be found for the latter is that the tops of dried boards are drier than the internal parts (Bachrich, 1980; Bergman, 2010; Hildebrand, 1970; Simpson, 1991).
Homogeneous moisture content of lumber is desirable for any use purpose, mostly in higher added value products, because drying gradients are associated to stresses and defects. Longitudinal homogeneity is as important as thickness, mostly for higher added value products, for example, in furniture industry, where large amounts of short trimmed pieces are used.
The general aim of this work was to study the quality of air-dried teakwood boards according to the
gradients of moisture content in thickness and length. Specific aims were: to compare the moisture content between surfaces of measurement; to evaluate the moisture content between two depths of measurement; to analyze the moisture content variation between different boards; to assess the moisture content along the length.
2. MATERIAL AND METHODS
2.1. Sampling
Six representative plainsawn boards (40 × 180 × 2,300 mm) of teakwood (Tectona grandis L.f.) were sampled from a stack that was air-dried (under shelter) for approximately 24 months. The wood was sampled from 16 years old trees, planted in a stand located in the Vale do Rio Doce region, Minas Gerais State, Brazil. More details about the site and the wood properties can be found in Motta (2011).
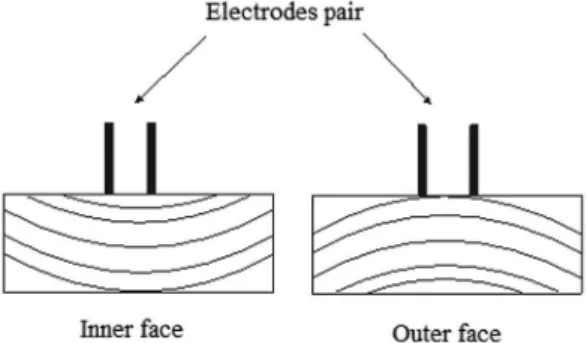
The electric (resistive) moisture meter used followed the manufacturer recommendations, where the electrodes measured an electric potential difference perpendicular to wood grain, using scale number 2 (Digisystem, 2006). This scale is recommended to wood with density between 0.50 and 0.75 g.cm–3, and the study’s teakwood presented average apparent density of 0.62 g.cm–3 (Motta, 2011). The boards were divided (but not cut) into 30 equal parts in length, and each one was measured with the moisture meter with two different pairs of insulated electrodes: one of 10 mm (1/4 thickness) and the other of 20 mm length (1/2 thickness). The boards were measured in both surfaces, one closer to pith, and other closer do bark, named inner and outer surfaces, respectively (Figure 1).
2.2. Treatments
In order to achieve the aims of this study, moisture content was determined according to four treatments, as presented in Table 1.
2.3. Statistical analysis
Statistical analysis was performed for treatments’ effect on moisture content, according to a Completely Randomized Design, and we adopted a 95% confidence level for all tests.
A multifactor Analysis of Variance was applied to simultaneously evaluate the measurement factors surface (inner and outer) and depth (1/4 or 1/2 thickness). In cases which were observed statistically significant influence of the factors (P-value < 0.05), we applied Tuckey’s Multiple Range Test to determine the difference between the averages.
For moisture content comparison between boards, we applied a one-way Analysis of Variance and Tuckey’s Multiple Range Test for averages differentiation. For data of moisture content gradient in length, no statistical analysis was performed, only a graphical analysis.
3. RESULTS AND DISCUSSION
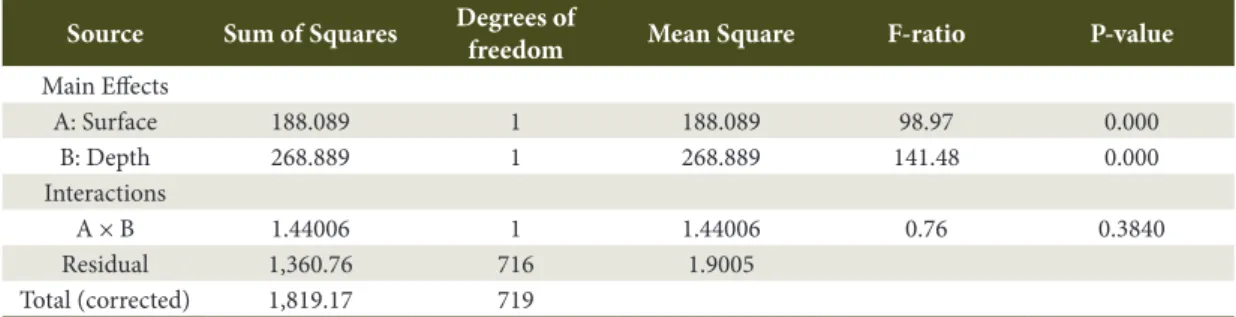
Table 2 presents the Analysis of Variance for moisture content data, according to the factors surface and depth. According to the P-values, the influence
of the factors surface and depth, individually, were statistically significant on the moisture content at 99% of confidence level. However, the interaction between the factors was not statistically significant at 95% of confidence level.
Since there was no interaction significance, it was not possible to simultaneously analyze both factors. Therefore, the statistical analysis was changed, where surface and depth were isolated and studied separately, resulting in only two treatments by factor. In this case, we applied the t test of Student (95% confidence level) for averages comparison.
3.1. Moisture content according to the boards’
surface of measurement
Table 3 shows the results for the analysis of the factor surface of measurement, where inner and outer treatments were compared. Moisture content averages between the surfaces were statistically different, where inner surface presented smaller average than outer surface. Regarding saturated wood, it was expected that the portion represented by the inner surface had higher moisture content than the outer, since the first has smaller density (Glass & Zelinka, 2010).
However, in this case the averages showed that there was no more free water in the boards, but only bound water, which demands more energy to be dried from wood (Bergman, 2010). Thus, as the outer surface is represented by a more mature wood, such tissue presents higher density, with thicker cell walls (Tsoumis, 1991), which can hold higher amounts of bound water. Therefore, the results of moisture content gradient between the inner and outer surfaces followed the information presented in the literature, and they were explained as a matter of wood anatomy and water sorption phenomena.
Table 1. Evaluated treatments.
Treatment Factor A – Surface of measurement
Factor B – Depth of measurement
1
Inner 1/4 thickness
2 1/2 thickness
3
Outer 1/4 thickness
4 1/2 thickness
Table 2. Summary table of analysis of variance for moisture content data according to surface and depth of measurement.
Source Sum of Squares Degrees of
freedom Mean Square F-ratio P-value
Main Effects
A: Surface 188.089 1 188.089 98.97 0.000
B: Depth 268.889 1 268.889 141.48 0.000
Interactions
A × B 1.44006 1 1.44006 0.76 0.3840
Residual 1,360.76 716 1.9005
Although the analysis revealed statistical difference between the moisture content of the different boards’ surfaces, such average difference was of only 1.0 percentage point (p.p.). It is necessary to evaluate, according to the final product that will be made from the wood, whether such difference is really significant in practice, since it was quite small.
For example, Mellado & Tomaselli (1993) kiln dried 25 mm thick boards of Eucalyptus viminalis and achieved an average moisture content on both surfaces (without control of inner or outer), after conditioning, of 8.55 and 10.47%. It results in a gradient of 1.92 p.p. between surfaces, which was considered a good result for that species.
In another situation, Batista (2009) studied the kiln drying behavior of Eucalyptus saligna, Eucalyptus grandis and Eucalyptus dunnii 30 mm thick boards. After a period of eight hours of conditioning, the boards presented average moisture content gradient between both surfaces of 0.04, 0.38 and 0.46 p.p., respectively. Considering that there is no control of the natural air drying process, the moisture gradient between the surfaces of the teakwood boards was very good, compared to those of kiln dried wood mentioned in literature (Batista, 2009; Mellado & Tomaselli, 1993).
3.2. Moisture content according to the boards’
depth of measurement
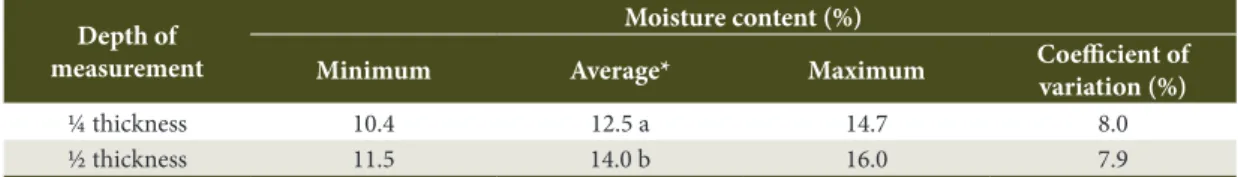
Table 4 shows the results for the analysis for the factor depth of measurement, where two lengths of electrodes were compared, represented by ¼ and ½ thickness.
Moisture content in teakwood was higher at ½ than at ¼ thickness. This result was expected and is extensively reported on the literature (Bachrich, 1980; Bergman, 2010; Hildebrand, 1970; Simpson, 1991), which states that the maximum moisture content is reached at ½ thickness. The average gradient between depths (1.5 p.p.) was higher than that between surfaces (1.0 p.p.) but, as discussed before for surface gradient, it can be considered a good result for air drying.
We also expected that wood tissues closer to the boards’ surface, i.e., those exposed to higher contact to surrounding air, would present lower moisture content, in this case, represented by ¼ thickness.
3.3. Moisture content between boards
Prior to the Analysis of Variance, moisture content data by board were analyzed according to Bartlett’s test, in order to test the null hypothesis that the variances of moisture content within each board were the same. Since the statistics M/C of Bartlett’s test was 1.1816 (P-value = 0.00), the null hypothesis was rejected, which means that there was a statistically significant difference (99% confidence level) amongst each board variances. This violated one of the important assumptions underlying the Analysis of Variance, invalidating such analysis (Ribeiro, 2001).
Thus, we performed the Kruskal-Wallis test, which tested the null hypothesis that the medians of moisture content of each board were the same. Then, moisture content data of each board were first combined and ranked from smallest to largest. The average rank was
Table 3. Wood moisture content according to the boards’ surface of measurement.
Surface of measurement
Moisture content (%)
Minimum Average* Maximum Coefficient of
variation (%)
Inner 10.5 12.6 a 15.5 9.4
Outer 11.0 13.6 b 17.4 11.1
*The two data taken from a same position in length, represented by the two depths (1/2 and 1/4 thickness), were transformed in a single average. The value presented in this table is an average of those 30 averages by board, totalizing an N value equal to 180.
Table 4. Wood moisture content according to the boards’ depth of measurement.
Depth of measurement
Moisture content (%)
Minimum Average* Maximum Coefficient of
variation (%)
¼ thickness 10.4 12.5 a 14.7 8.0
½ thickness 11.5 14.0 b 16.0 7.9
then computed for the data of each board (Spiegel, 1994), and the results are presented in Table 5.
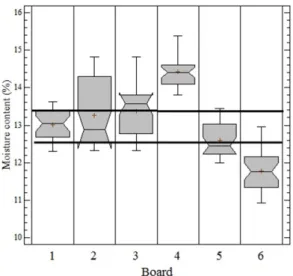
The statistics H calculated at Kruskal-Wallis test was 116.833 (P-value = 0.00), and showed that there was a statistically significant difference amongst the medians at the 99% confidence level. To determine the medians significant difference we performed a Box-and-Whisker Plot, presented in Figure 2.
The horizontal parallel lines in Figure 2 were traced based on the notches of board 2, since it was the one presenting the largest coefficient of variation (6.7%). Board 1 notches overlapped with board 2’s, what means that there was not a statistically significant difference between the boards’ medians at the 95% confidence level.
The analysis of the other boards’ notches revealed no more overlaps among them, representing that the medians of boards 3, 4, 5 and 6 were statistically
different from the group mentioned before and among themselves. Therefore, the six boards were separated in five distinct moisture content groups: i) board 4 with the highest moisture content (14.4%); ii) board 3; iii) boards 1 and 2; iv) board 5; and board 6 with the lowest moisture content (11.8%).
The average range of moisture content between the boards was 2.6 percentage points (board 4 × board 6) and Batista (2009) found 3.51 percentage points for Eucalyptus grandis kiln dried boards. Thus, the teakwood boards result can be considered good, indicating that moisture content variation among boards air-dried under shelter can be smaller than that achieved by kiln dried lumber.
3.4. Longitudinal gradient of moisture content
Figure 3 presents the gradient of moisture content along length by board, and each point corresponds to the average of the four treatments, as explained in Table 5. In order to facilitate the moisture content distribution analysis, boards 1, 2 and 3 were grouped in a different graphic from the others.
Initially, it was possible to notice that the boards’ moisture content gradient along length was not homogeneous. According to literature information, it was expected the tops to present smaller moisture content, while the 1/2 length portion would present higher moisture content (Bachrich, 1980; Bergman, 2010; Hildebrand, 1970; Simpson, 1991), which did not happen for any board.
Boards 1, 5 and 4 presented smaller ranges of moisture content gradient along length, respectively with 1.3, 1.4 and 1.6 p.p., while boards 2 and 3 had the highest range (2.5 p.p). Regarding air-drying, these Figure 2. Box-and-Whisker plot of moisture content by
board.
Table 5. Summary statistics of moisture content by board.
Boards Moisture content (%) Range (p.p.) Coefficient of
variation (%) Average rank
Minimum Average* Maximum
1 12.3 13.0 13.6 1.3 3.1 92.1
2 12.3 13.3 14.8 2.5 6.7 100.0
3 12.3 13.4 14.8 2.5 4.7 110.2
4 13.8 14.4 15.4 1.6 3.1 157.6
5 12.0 12.6 13.4 1.4 3.5 61.5
6 10.9 11.8 13.0 2.1 4.4 21.6
results can be considered good, although moisture content peaks represent bad quality of drying control.
Boards 2 and 3 presented noticeable moisture peaks along the length, indicating the presence of wetter regions, with “pockets” of moisture content. The causes for these results are various, particularly due to natural air-drying, for example, non-uniform stacking, board position on the stack, and even anatomical features, such as the position of the board in the tree.
On the other hand, boards number 1, 4, 5 and 6 had a more uniform pattern of moisture content distribution from top to top, sometimes increasing (boards 1, 5 and 6), sometimes decreasing (board 4). In fact, the increasing or decreasing patterns do not matter, because it depends on the top that was chosen to start the moisture content measurement, which was at random.
4. CONCLUSIONS
The air-drying quality of 40 mm teakwood boards can be considered good for a under shelter condition, mainly for two reasons: i) the average moisture content gradients in thickness were comparable to those reported
in literature for kiln drying of less thick boards; ii) the range of moisture content among boards (2.5 p.p.) was satisfactory for a non-controlled drying process.
We observed a significant interaction between the factors surface and depth of moisture content measurement.
Outer surfaces of teakwood boards, represented by a more adult tissue, had higher moisture content than inner surfaces, represented by a more juvenile wood. The behavior of moisture content gradient in thickness was the same as largely reported in literature, in which at 1/2 thickness it was achieved higher moisture content than at 1/4.
Length moisture content gradient was completely different from that reported in literature, in which no board tops had smaller moisture content than the parts comprehended between the tops. Moisture content gradient along length presented increasing and decreasing patterns, according to the board, and moisture peaks in different positions.
SUBMISSION STATUS
Received: 14 nov., 2013 Accepted: 11 apr., 2016
CORRESPONDENCE TO
Djeison Cesar Batista
Departamento de Ciências Florestais e da Madeira, Universidade Federal do Espírito Santo – UFES, Avenida Governador Carlos Lindenberg, 316, Centro, CEP 29550-000, Jerônimo Monteiro, ES, Brasil
e-mail: [email protected]
REFERENCES
Associação Brasileira dos Produtores de Florestas Plantadas – ABRAF. Anuário estatístico da ABRAF 2013: ano base 2012. Brasília: ABRAF; 2013.
Bachrich JL. Dry kiln handbook. Vancouver: H.A. Simons International; 1980.
Batista DC. Qualidade da secagem convencional conjunta da madeira de nove clones do gênero Eucalyptus [dissertação]. Curitiba: Universidade Federal do Paraná; 2009. Bergman R. Drying and control of moisture content and dimensional changes. In: Forest Products Laboratory. Wood
handbook: wood as an engineering material. Madison: United States Department of Agriculture; 2010. Digisystem. Medidor de umidade para madeiras DL 822 & DUP 8805. Curitiba: Digisystem; 2006.
Glass SV, Zelinka SL. Moisture relations and physical properties of wood. In: Forest Products Laboratory. Wood handbook: wood as an engineering material. Madison: United States Department of Agriculture; 2010. Hildebrand R. Kiln drying of sawn timber. Plochingen: Richard Schorndorfer; 1970.
Indústria Brasileira de Árvores – IBÁ. Indústria Brasileira de Árvores. Brasília: IBÁ; 2014. 97 p.
Mellado ECR, Tomaselli I. Secagem da madeira serrada de
Eucalyptus viminalis. Ciência Florestal 1993; 3(1): 147-159.
Motta JP. Propriedades tecnológicas da madeira de Tectona grandis L.f. proveniente do vale do rio doce, Minas Gerais
[dissertação]. Goiabeiras: Centro de Ciências Agrárias, Universidade Federal do Espírito Santo; 2011.
Ribeiro JI Jr. Análises estatísticas no SAEG. Viçosa: UFV; 2001.
Simpson WT. Dry kiln operator’s manual. Madison: United States Department of Agriculture; 1991.
Spiegel MR. Estatística. 3. ed. São Paulo: Pearson Education do Brasil; 1994.