Printed version ISSN 0001-3765 / Online version ISSN 1678-2690 http://dx.doi.org/10.1590/0001-3765201820170396
www.scielo.br/aabc | www.fb.com/aabcjournal
Spatial Distribution of
Euschistus heros
(Hemiptera: Pentatomidae)
in Cotton (
Gossypium hirsutum
Linnaeus)
ANDERSON C. WEBER1
, PAULO E. DEGRANDE1
, ELLEN P. DE SOUZA2
, ROSALIA AZAMBUJA2
and MARCOS G. FERNANDES2
1
Universidade Federal da Grande Dourados, Faculdade de Ciências Agrárias, Rodovia Dourados/ Itahum, Km 12, Cidade Universitária, Caixa Postal 364, 79804-970 Dourados, MS, Brazil 2
Universidade Federal da Grande Dourados, Faculdade de Ciências Biológicas e Ambientais, Rodovia Dourados/Itahum, Km 12, Cidade Universitária, Caixa Postal 364, 79804-970 Dourados, MS, Brazil
Manuscript received on May 24, 2017; accepted for publication on March 26, 2018
ABSTRACT
Recently, the Neotropical brown stink bug, Euschistus heros (Pentatomidae: Hemiptera), has been detected in cotton in the Brazilian Cerrado. Several reliable surveys have been conducted on the spatial distribution of stink bugs in soybean; however, few studies have examined the behavior of this insect in cotton in Brazil. Thus, this study examined the spatial distribution of E. heros in cotton using aggregation indices based on the variance-to-mean ratio, Morisita index, exponent k, Poisson and negative binomial distributions. Inverse Distance Weighting interpolation maps were also used to represent insect density.
The study was conducted in a 1.1 hectare experimental cotton field in which 64 equally-sized plots were sampled on a weekly basis. Our findings revealed that stink bugs presented an aggregate distribution in 2
sampling weeks based on aggregation indices, and this pattern was best described by a negative binomial distribution. Maps showing the density of pests can be an important tool for sampling pests in crops and
control measures in early stages of infestation, when there is an edge effect on the distribution of E. heros,
can be an efficient strategy in cotton.
Key words: Aggregation Indices, Dispersion, GIS, IPM, Negative Binomial.
Correspondence to: Ellen Patrícia de Souza E-mail: [email protected]
INTRODUCTION
The Neotropical brown stink bug, Euschistus heros
(Hemiptera: Pentatomidae) (F.), usually occurs in the cotton and is becoming an economically important pest for Brazilian cotton growers (Soria et al. 2009). In Brazil, E. heros is the species
with the highest incidence in cotton fields (Soria et al. 2009). Most stink bugs attack cotton fields
during the development of cotton bolls, causing
immaturity, stained lint, general loss of fiber quality,
and reduced yield (Reay-Jones et al. 2009). Stink bugs feeding on cotton can also result in indirect damage due to the transmission of pathogens, such as the bacterium Pantoea agglomerans, which causes cotton boll rot (Medrano et al. 2007).
The high incidence of E. heros is caused by the simultaneous sowing of soybean and cotton, in which stink bugs migrate from the former to the
in soybean, high density of insects, and dispersion of the pest population from one area to another in search of food, and the attacks coincide with the formation of bolls, the most critical stage in the development of cotton (Soria et al. 2010, 2009).
Integrated pest management depends on an
efficient sampling method that is essential when
deciding to perform an effective pest control. Spatial distribution models can identify when a species has a regular, random, or aggregated
spatial distribution in field, in which probabilistic
models of Poisson, positive and negative binomial distributions are respectively used to describe the types of pattern of a pest (Young and Young 1998).
The use of surface maps increases the understanding of the spatial interactions of an organism within a given area. These maps of geospatial variability are very accurate for Integrated Pest Management (Fleisher et al. 1999). The interpolation of the data from the sampling area consists of generating data from non-sampled sites, with the construction of surface models or surface maps. Among the methods of interpolation, the Inverse Distance Weighting (IDW) can be used to assist in evaluating the spatial distribution of stink bugs in cotton growing areas (Reay-Jones et al. 2010). Therefore, we investigated the spatial distribution pattern of the Neotropical brown stink bug, E. heros, in cotton to develop management strategies for this pest.
MATERIALS AND METHODS
The study was carried out at the Experimental Farm of Agricultural Sciences of the Federal University of Grande Dourados (Fazenda Experimental de Ciências Agrárias da Universidade Federal da Grande Dourados – FAECA UFGD), located in the municipality of Dourados (MS), latitude 22º 14’ 07’’ S and longitude 54º 59’ 17” W. The area consisted
of 1.1 hectare experimental field cultivated with
cotton variety FiberMax® 910, and corn planted
around the edges to isolate it from stink bugs
present in surrounding soybean fields in different
infestation levels, and appropriate management practices were carried out when needed.
For sampling purposes, the experimental field was divided into 64 equally-sized (13 x 13m) plots.
In each plot, two whole cotton plants in the central lines were examined weekly, during the entire growing season, starting at 7 DAE (days after emergence) up to 118 DAE, and counts of adults
of E. heros were obtained for each plot directly in
the plant
The numbers of adults of stink bugs obtained in cotton in each plots were used to determine the spatial distribution of the population. Stink bugs were found in nine of 14 sampling dates, , between 64 DAE and 118 DAE, which were used to calculate the mean, variance, and aggregation indices. Sampling dates in which the insects did not occur (from 7 DAE to 57 DAE) were not included. Dispersion indices were obtained to determine the type of spatial distribution of the pest in the field. Also, the Poisson and negative binomial
distributions were fitted to the data to test observed and expected frequencies.
DISPERSION INDICES
The variance/mean ratio (I=s²/m) measures the deviation of an arrangement from randomness.
Values equal to zero indicate a random spatial
pattern; values less than one indicate a regular or
uniform spatial distribution; and values significantly
greater than one indicate contagious or clustered spatial arrangement (Davis 1994). With the data
obtained in each plot, the chi-square test was used
to analyze randomness.
The Morisita’s index Iᵟ (Morisita 1962) is independent from the sample mean and the total
number of individuals. Values equal to one indicate
RESULTS
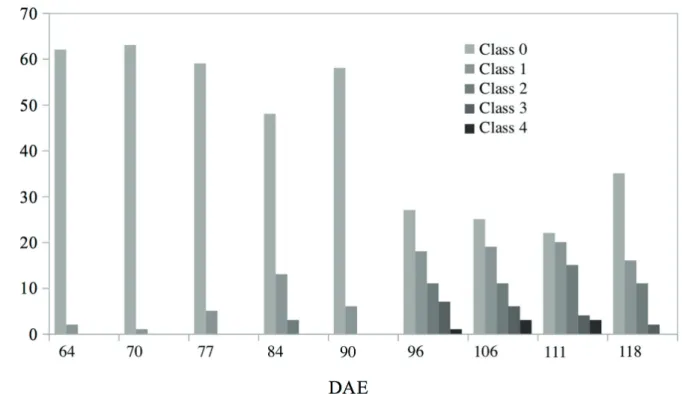
The number of adult insects per plot recorded weekly was highly variable and the observed
frequency of stink bugs was low at 64 DAE and
70 DAE. The first occurrence of E. heros was observed at 64 DAE when cotton plants were in the reproductive development stage, with only two classes in the beginning of the study and reaching
up to five classes in the last sampling dates.
In the beginning of this study, only one insect was observed per sample plot. Class zero represents
the frequency of 0s and class one includes the frequency of 1s (Fig. 1). In the first and second
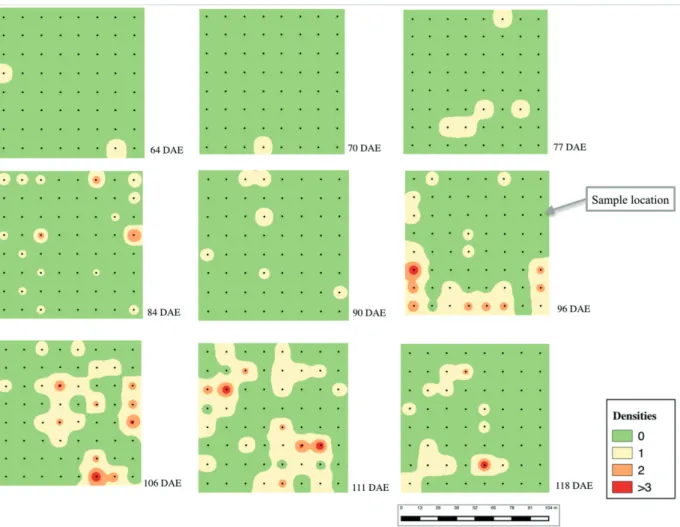
sampling dates, insects were found in the plots on
the edge of the cotton field (Fig. 2), indicating the
arrival of the pest from adjacent areas planted with corn.
Based on the variance/mean ratio, the level of aggregation of E. heros adults was low in the
cotton field. Thus, values were statistically lower
than the threshold, except for the samples at 106 DAE and 118 DAE, showing that stink bugs were aggregated only in these two dates. In all others, a random distribution of insects was observed in cotton plots (Table I).
The Morisita index was statistically similar to the variance/mean ratio (Table I), indicating that stink bugs were aggregated in only in the samples at 106 DAE and 118 DAE, tending to a random distribution.
The results of the exponent k of the negative binomial distribution, however, suggested that stink bugs were more aggregated in the cotton
field. The exponent k obtained with the method of
moments (MM) was between 0 and 8, suggesting an aggregated distribution in most sampling dates
(84, 90, 96, 106, 111 and 118 DAE) in the field
(Table I). These values are similar to some of those obtained for the Morisita index and the variance/ mean ratio.
one indicate a uniform or regular distribution. The
chi-square test is used to reject randomness when the
calculated X² is greater than the table value.
The exponent k of the negative binomial distribution can be determined with the Method of Moments (MM) or Maximum Likelihood Estimation (MLE) (Young and Young 1998). In the present study, MM was used to estimate this exponent, which indicates aggregation when k> 0 and k <8, where k <0> 8 indicates a random distribution.
FREQUENCY DISTRIBUTION
The Poisson and negative binomial distributions were used as models for the population samples. The Poisson distribution indicates randomness and
is characterized by a variance equal to the mean,
using only the sample mean as the parameter of evaluation. On the other hand, the negative binomial distribution indicates spatial aggregation and is characterized by a variance greater than average, using as parameters the sample mean and the exponent k (Young and Young 1998).
Therefore, the theoretical frequency
distributions used to evaluate the spatial distribution
of E. heros in the cotton field were fitted to the data
with the chi-square goodness-of-fit test (X²), which
compares observed and expected frequencies (Young and Young 1998). The observed frequencies
of the data collected were assigned into classes; each class represented the numerical value for the
observed and expected frequency of E. heros of the
sampling. The level of significance was set at 5%.
SPATIAL ANALYSIS WITH THE GEOGRAPHIC INFORMATION SYSTEM
For the representation of the statistical models, surface maps of the site were obtained with Inverse Distance Weighted (IDW) interpolation, using
the Software QGIS® (www.qgis.org). The maps
described the population density of stink bugs in
Figure 1 - Observed frequency of E. heros in nine cotton sampling dates between 64 and 118 days after emergence (DAE), and grayscale color representing each class. Dourados - MS, Brazil.
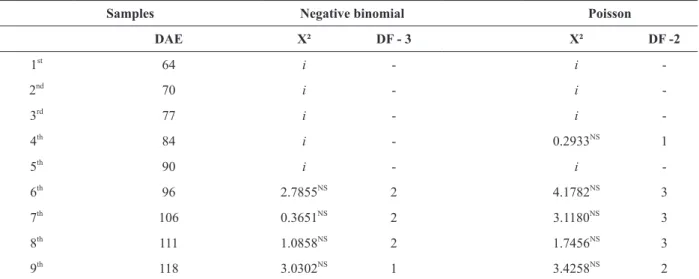
For the chi-square goodness-of-fit test, the
value obtained with N-1 degrees of freedom and
significance level of 5% was 82,529. Thus, all X²
values calculated lower than the table value were rejected, and did not reach the threshold to be considered aggregated.
In the present study, the negative binomial
distribution best described the frequency of stink
bugs, although there is also adjustment for the
Poisson distribution, the Chi-square values of the
Negative Binomial Distribution are smaller in relation to those of Poisson; this indicates a better
fit for Negative Binomial. Also, by the surface maps
(Figure 2) it is possible to observe an aggregate distribution of the population. The number of
classes of frequency of stink bugs was insufficient
until 90 DAE (Table II) . This distribution is characterized by a variance greater than the mean (s² > ) and thus, the negative binomial
distribution significantly fitted the data, reflecting
the aggregation pattern of the brown stink bug in
cotton. The samples of E. heros analyzed with
chi-square test were not significant.
The data obtained for the Neotropical brown stink bug were also tested to Poisson distribution, however, there were not good adjustment because
it is characterized by a variance equal to the mean.
The negative binomial and Poisson distributions were sufficient to identify the best spatial pattern to describe the Neotropical brown stink bug in cotton. Thus, the results suggest that
E. heros adults were aggregated in the cotton field,
and is best described by the negative binomial distribution, since variance values were higher than the mean, besides the negative binomial values were lower than those obtained for the Poisson distribution, approaching zero.
SPATIAL ANALYSIS WITH GEOGRAPHIC INFORMATION SYSTEM
bugs. The initial pattern of insects sampled showed
the colonization of cotton field edges near corn,
indicating that E. heros dispersed from corn to cotton. (Fig. 2).
I n v e r s e D i s t a n c e We i g h t i n g ( I D W ) interpolations indicated the areas of the first occurrences of stink bugs in the plots. The initial pattern of the insects was on the edge of the cotton
field and at 77 DAE, stink bugs was found within the field. The population peaked at 96 DAE (Fig. 2).
Thus, a control method focused on the edges of the
field could be effective in early stages of E. heros
infestations. However, once stink bugs are settled
in the area, the entire field needs to be treated.
The maps showed the areas with the highest population densities of stink bugs, which were aggregated based on the variance/mean ratio and Morisita index. These parameters can be compared with 96 to 118 DAE interpolated maps representing the data described by the Negative Binomial Distribution (Fig. 2).
DISCUSSION
After the third week, a significant increase in the E.
heros population was observed in the area, which
fluctuated constantly during the sampling weeks
in the study area (Fig. 1). This variation within the
field can be associated with the movement of insects
searching for food. According toAzambuja et al.
(2013), E. heros attacks cotton due to the shortage of other foods, becoming an alternative pest in the crop, although Edessa meditabunda also normally develops on this crop (Azambuja et al. 2015).
Stink bugs movement between closely associated host plants throughout the growing season may be a response to a decrease in the availability of their current host plants (Jones and Sullivan 1982, Velasco and Walter 1992, Ehler 2000, Tillman and Cottrell 2016a). Crop-to-crop dispersal of stink bug species has been reported for many cropping systems (Tillman et al. 2009, Reay-Jones et al. 2010, Reeves et al. 2010, Tillman 2011, Reisig et al. 2013). When stink bugs disperse
from one crop to another, they aggregate at field
borders. Therefore, there is a pronounced edge
effect observed in the distribution of stink bugs
as they colonize a new crop (Zalom et al. 1997, Espino et al. 2008, Reay-Jones 2010, Reay-Jones et al. 2010, Reeves et al. 2010; Olson et al. 2012, Reisig et al. 2013, Tillman et al. 2014).
Regarding the spatial distribution of phytophagous stink bugs, Todd and Herzog (1980) reported an aggregated pattern for the green stink bug Nezara viridula in southeastern United States. In addition to dietary habits, Tillman and Cottrell (2016b) reported that pheromones, such as aggregation pheromones, can influence the
mobility of stink bugs and consequently their spatial
TABLE I
Dispersion indices of the spatial distribution of the stink bug E. heros in cotton, Dourados - MS, Brazil. Samples
(DAE) 64 70 77 84 90 96 106 111 118
M 0.031 0.016 0.078 0.313 0.109 1.031 1.125 1.188 0.719
S² 0.031 0.016 0.073 0.377 0.131 1.301 1.476 1.456 0.967
I 0.984al
1.000al
0.937al
1.206al
1.195al
1.261al
1.312ag
1.226al
1.346ag
Iᵟ - - - 1.684al
3.048al
1.253al
1.277ag
1.190al
1.484ag K 1.969 ag
- -1.230 al
1.514ag
0.561ag
3.948ag
3.604ag
5.245ag
2.079ag
X² 62.00 - 59.00 76.00 75.29 79.45 82.67 77.26 84.78
DAE = days after emergence; M = mean; S² = variance; I = variance/mean ratio; Iδ = Morisita index; k = exponent k; X² = calculated
chi-square; ag
= Aggregated; al
distribution. Thus the movement of insects to the
cotton field can occur as a result of the presence
of neighboring host plants and the availability of a new food source.
Our findings indicate an aggregate distribution
pattern of E. heros in cotton, corroborating other studies and it is best described by the negative binomial distribution (Santos et al. 2004, Souza 2012). Therefore, stink bugs can move into cotton
by the edges of the field and cluster in different
places at each sampling date, possibly as a result of the phenological stage of cotton plants and the search for food (Reisig et al. 2015).
Considering all sampling dates, infestation
levels were low until 84 DAE and the first incidence
of insects were observed in plots on the edges of
the field indicating a classic edge effect. Soria et
al. (2010) reported that the presence of E. heros
depends on the phenological stage of cotton plants and that in most cases, stink bugs migrate to cotton from surrounding crops. Pilkay et al. (2015) also found a higher incidence of stink bugs in crops cultivated near areas planted with soybeans.
Stink bugs of the Pentatomidae family, such as
N. viridula and E. servus, also have been reported
colonizing agricultural landscapes from the edges
of the crop (Edge Effect) and then dispersing in the field or to other crops, in which the height of the plant can influence its dispersion suggesting that
the dispersal of bed bugs, as observed by Tillman (2014). Further studies are needed on plants as barriers as an alternative to hinder the dispersion and distribution of stink bugs .
SPATIAL ANALYSIS WITH GEOGRAPHIC INFORMATION SYSTEM
Several studies have been carried out to determine the spatial distribution of insects in cash crops. The mean and variance are used to determine the distribution pattern of an insect but do not take into account the location of the pest in the area. Reay-Jones et al. (2010) demonstrated that pentatomids
have an aggregate pattern in cotton fields, using
statistical methods and mapping based on Inverse Distance Weighting (IDW) interpolation. Thus,
surface maps may be more effective to identify the
location of insects in the study area and to show the spatial distribution of the insect during its
establishment in the field.
Based on studies conducted in the United States on pentatomids, Reay-Jones et al. (2010) reported that mapping stink bug density and damage to cotton
bolls are effective ways to describe both variables.
Moradi-Vajargah et al. (2011) suggested the Taylor
Regression model to assist the identification of
distribution patterns of pests.
With the use of surface maps, the areas with
the highest densities of stink bugs can be identified.
The areas with greater damage to cotton plants
caused by the insects may be different than those
with higher densities, thus suggesting the need to assess cotton boll damage (Pulakkatu-Thodi et al. 2014).
CONCLUSIONS
The distribution of brown stink bug was aggregated based on the variance/mean ratio, the Morisita index, and the exponent k of the negative binomial distribution.
The negative binomial distribution was able to describe the aggregation of E. heros and our
findings may be useful in future sampling plans in
cotton.
Sampling maps can be a useful tool to monitor agricultural pests, to identify their initial spatial location, and to determine their distribution within
the cotton field.
TABLE II
Chi-square goodness-of-fit test of the observed and expected frequencies of E. heros per plot and the Poisson and negative
binomial distributions. Dourados - MS, Brazil.
Samples Negative binomial Poisson
DAE X² DF - 3 X² DF -2
1st
64 i - i
-2nd
70 i - i
-3rd
77 i - i
-4th
84 i - 0.2933NS
1 5th
90 i - i
-6th
96 2.7855NS
2 4.1782NS
3 7th
106 0.3651NS
2 3.1180NS
3 8th
111 1.0858NS
2 1.7456NS
3 9th
118 3.0302NS
1 3.4258NS
2
REFERENCES
AZAMBUJA R, DEGRANDE PE AND PEREIRA FF. 2013. Comparative Biology of Euschistus heros (F.) (Hemiptera: Pentatomidae) Feeding on Cotton and Soybean Reproductive Structures. Neotrop Entomol 42: 359-365. AZAMBUJA R, DEGRANDE PE, SOUZA EP, PEREIRA
FF AND PASTORI PL. 2015. Reprodução de Edessa meditabunda (Hemiptera: Pentatomidae) em algodoeiro. Acta Biol Colomb 20: 203-208.
DAVIS PM. 1994. Statistics for Describing Populations. In: Pedigo LP and Buntin GD, Handbook of Sampling Methods for Arthropods in Agriculture. Florida: CRC Press, p. 33-53.
EHLER LE. 2000. Farmscape Ecology of Stink Bugs in Northern California; Entomological Society of America: Lanham, MD, USA, p. 59.
ESPINO L, WAY MO AND WILSON LT. 2008. Sequential
sampling plans for sweep net and visual sampling of
Oebalus pugnax in rice. Southwest. Entomol 33: 53-64. FLEISHER SJ, BLOM PE AND WEISZ R. 1999. Sampling
in Precision IPM: When the objective is a map. Phytopathology 89: 1112-1118.
JONES WA AND SULLIVAN MJ. 1982. Role of host plants in population dynamics of stink bug pests of Soybean in South Carolina. Environ Entomol 11: 867-875.
MEDRANO EG, ESQUIVEL JF AND BELL AA. 2007. Transmission of cotton seed and boll rotting bacteria by the southern green stink bug (Nezara viridula L.). J Appl Microbiol 103: 436-444.
MORADI-VAJARGAH M, GOLIZADEH A, RAFIEE-DASTJERDI H, ZALUCKI M, HASSANPOUR M AND NASERI B. 2011. Population Density and Spatial Distribution Pattern of Hypera postica (Coleoptera: Curculionidae) in Ardabil,Iran. Not Bot Horti Agrobo 9: 42-28.
MORISITA M. 1962. Iᵟ -index, a measure of dispersion of individuals. Res Popul Eco(Kyoto) 4: 1-7.
OLSON DM, RUBERSON JR AND ANDOW DA. 2012. Effects on stink bugs of field edges adjacent to woodland. Entomol Exp Appl 156: 94-98.
PILKAY GL, REAY-JONES FP, TOEWS MD, GREENE JK AND BRIDGES WC. 2015. Spatial and temporal dynamics of stink bugs in southeastern farmscapes. J Insect Sci 5: 1-13.
PULAKKATU-THODI I, REISIG DD, GREENE JK, REAY-JONES FPF AND TOEWS MD. 2014. Within-Field Spatial Distribution of Stink Bug (Hemiptera: Pentatomidae)-Induced Boll Injury in Commercial Cotton Fields of the Southeastern United States. Environ Entomol 43: 744-752. REAY-JONES FPF. 2010. Spatial and temporal patterns of
stink bugs (Hemiptera: Pentatomidae) in wheat. Environ Entomol 39: 944-955.
REAY-JONES FPF, TOEWS MD, GREENE JK AND REEVES RB. 2009. Sampling stink bugs (Hemiptera: Pentatomidae) for population estimation and pest management in southeastern cotton production. J Econ Entomol 102: 2360-2370.
REAY-JONES FPF, TOEWS MD, GREENE JK AND REEVES RB. 2010. Spatial Dynamics of Stink (Hemiptera: Pentatomidae) and Associated Boll Injury in Southeastern Cotton Fields. Environ Entomol39: 956-969.
REEVES RB, GREENE JK, REAY-JONES FPF, TOEWS MD AND GERARD PD. 2010. Effects of adjacent habitat on populations of stink bugs (Heteroptera: Pentatomidae) in cotton as part of a variable agricultural landscape in South Carolina. Environ Entomol 39: 1420-1427.
REISIG DD, REAY-JONES FPF AND MEIJER AD. 2015. Aggregation and association of NDVI, boll injury, and stink bugs in North Caroline cotton. J Insect Sci 15: 1-4. REISIG DD, ROE M AND DHAMMI A. 2013. Dispersal
pattern and dispersion of adults and nymph stink bugs (Hemiptera: Pentatomidae) in wheat and corn. Environ Entomol 42: 1184-1192.
SANTOS RSS, REDAELLI LR, DIEFENBACH LMG, ROMANOWSKI HP, PRANDO HF AND ANTOCHEVIS RC. 2004. Distribuição espacial de Oebalus poecilus
(Dallas, 1851) (Hemiptera: Pentatomidae) durante a hibernação. Entomotropica 19: 91-100.
SORIA MF, DEGRANDE PE AND PANIZZI AR. 2010. Invasão inusitada. Cultivar: Grandes Culturas 131(4): 18-20.
SORIA MF, THOMAZONI D, MARTINS RR AND DEGRANDE PE. 2009. Stink bugs incidence on Bt cotton in Brazil. In: Beltwide Cotton Conferences, 2009, San Antonio, Texas, EUA. Beltwide Cotton Conferences Proceedings8: 13-819.
SOUZA LA. 2012. Distribuição espacial e plano de
amostragem sequencial para Euschistus heros (Fabricius, 1794) (Heteroptera: Pentatomidae) na cultura da soja convencional e transgênica [Dissertação]. Faculdade de Ciências Agrárias e Veterinárias, Universidade Estadual Paulista, Jaboticabal. (Unpublished).
TILLMAN PG. 2011. Influence of corn on stink bugs
(Heteroptera: Pentatomidae) in subsequent crops. Environ
Entomol 40: 1159.
TILLMAN PG. 2014. Physical barriers for suppression of movement of adult stink bugs into cotton. J Pest Sci 87: 419-427.
TILLMAN PG AND COTTRELL TE. 2016a. Density and egg parasitism of stink bugs (Hemiptera: Pentatomidae) in elderberry and dispersal into crops. J Insect Sci 16: 1-14. TILLMAN PG AND COTTRELL TE. 2016b. Attraction
of Stink Bug (Hemiptera: Pentatomidae) Nymphs to
TILLMAN PG, COTTRELL TE, MIZELL RFIII AND KRAMER E. 2014. Effect of field edges on dispersal and distribution of colonizing stink bugs across farmscapes of the Southeast US. Bull Entomol Res 104: 56-64.
TILLMAN PG, NORTHFIELD TD, MIZELL R AND RIDDLE RC. 2009. Spatiotemporal patterns and dispersal of stink bugs (Heteroptera: Pentatomidae) in peanut-cotton farmscapes. Environ Entomol 38: 1038-1052.
TODD JW AND HERZOG DC. 1980. Sampling phytophagous Pentatomidae on soybean. In: Kogan M and Herzog D.C. Sampling methods in soybean entomology, New York: Springer-Verlag, p. 438-478.
VELASCO LRI AND WALTER GH. 1992. Availability of different host plant species and changing abundance
of the polyphagous bug Nezara viridula (Hemiptera: Pentatomidae). Environ Entomol 21: 751-759.
YOUNG LJ AND YOUNG JH. 1998. Statistical ecology: a population perspective. Boston: Kluwer Academic Publishers, 565 p.