http://dx.doi.org/10.1590/1806-9061-2017-0661
Liver Is Associated with Fatness of Chickens
Author(s)
Parada RI
Malewski TII
Jaszczak KI
Kawka MI
I Department of Genomics, Institute of
Genetics and Animal Breeding, Polish Academy of Sciences, 05-552 Jastrzębiec, Postępu Street 36A, Poland.
II Department of Molecular and Biometric
Techniques, Museum and Institute of Zoology, Polish Academy of Sciences, Wilcza Street 64, 00-679 Warsaw, Poland.
Mail Address
Corresponding author e-mail address Magdalena Kawka
Department of Genomics, Institute of Genetics and Animal Breeding, Polish Academy of Sciences, 05-552 Jastrzębiec, Postępu Street 36A, Poland.
Phone: +48 22 7367027 Email: m.kawka@ighz.pl
Keywords
Fat deposition, PPARG, transcription factor, SNP, slow-growing chickens.
Submitted: 17/October/2017 Approved: 12/February/2018
ABSTRACT
The expression of four transcription variant of peroxisome proliferator-activated receptor gamma gene (PPARG) (XM_015292931.1; XM_015292932.1; XM_015292933.1 and NM_001001460.1) in the liver of broilers was measured and its correlation with abdominal fat weight and relative abdominal fat content was investigated. The study was conducted with 92 slow-growing crossbred chickens (Cobb males x indigenous Green-legged Partridge female chickens) divided into “fat” and “lean” groups, according to their abdominal fat yield. The NM_001001460.1 transcriptwas upregulated with ratio of means 4.26 (p≤0.01) in the “fat” group in relation to the “lean” group. Expression of this transcript was highly correlated with relative abdominal fat content (0.71, p≤0.01) and abdominal fat weight (0.59, p≤0.01). Two SNPs are located in putative transcription factor binding sites. Mutation -991C>A disrupts PPAR while mutation -884C>T disrupts C/EBP putative binding site. The gene expression analysis of PPARg showed that the expression of the transcripts (NM_001001460.1) was more than four times higher in fat than in lean chickens. These results point out that the peroxisome proliferator-activated receptor gamma NM_001001460.1 transcript could be candidate gene for determination of abdominal fat deposition in the chickens.
INTRODUCTION
Poultry breeding programs are used to improve growth performance and carcass traits. Decades of intensive genetic selection have resulted in higher body weight gain and growth rate, and better feed conversion efficiency in broiler chickens (Wang et al., 2012). However, the selection for rapid growth had unintended effects such as excessive fat deposition. Excessive adiposity is a major problem in meat-type chicken production. About 20% of the broiler’s body weight is fat, and it is mostly deposited in adipose tissues (Havenstein et al., 2003). Fat is currently considered a by-product of very little commercial value. Moreover, it is a body component that requires high energy intake and, therefore, high fat deposition can considerably decrease feed efficiency. The selection of chickens for leanness is one of main directions of poultry breeding (Fouad & El-Senousey, 2014). Abdominal fat weight and abdominal fat percentage are major phenotypic indices of fat traits.
has three distinct isoforms (α, β/δ, γ) (Michalik et al., 2006). Among the PPARs, PPARG has an important role in adipose tissue development and function, as it is involved in insulin sensitivity (Chistiakov et al., 2010), lipid storage, energy dissipation, and adipokine secretion (Dahlman & Arner, 2010). Therefore, the
PPARG gene participates in the regulation of fat metabolism in many ways (Heikkinen et al., 2007). Adipogenesis is regulated by many transcription factors, such as CCAAT/enhancer-binding protein factors (C/ EBPa, C/EBPb), sterol regulatory element-binding protein 1 (SREBP1), and peroxisome proliferator-activated receptors (PPARa and PPARg). PPARγ is the main regulator of adipogenesis. SREBP1 and C/ EBPb, expressed in the early stages of adipogenesis, induce the expression of PPARg at later stages of cell differentiation (Peter & Bruce, 2008).
The level of PPARG expression is high in chicken adipose tissues (Mandrup & Lane, 1997), and its expression is correlated with fat deposition, which suggests that PPARG is a main factor regulating fat accumulation in the abdominal fat pad of chickens (Sato et al., 2009). In broilers, fat acid synthesis occurs mainly in the liver, and the adipose tissue is the primary site of storage of fat as triglycerides (Huang
et al., 2008; Fouad & El-Senousey, 2014). Previously, we showed that PPARG was upregulated (3.34-fold) in the liver of fat chickens. Its expression significantly is significantly correlated both with relative abdominal fat content (0.55, p<0.05) and abdominal fat weight (0.57, p<0.01) (Larkina et al., 2011).
The aim of the study was to investigate the expression of PPARG transcript variants in the liver of the lean and fat chicken strains, sequencing and comparison of 5’-flanking sequences, estimation of putative transcription factor binding sites and correlation between expression of PPARG transcript variants and chicken fatness.
MATERIALS AND METHODS
Birds
The experimental procedures were approved by the Ethics Committee of the Polish Academy of Science, under protocol number 27/2009 within the project “BIOFOOD innovative, functional products of animal origin”.
This study was conducted with slow-growing chickens derived from a cross between Cobb (C) males and females of an indigenous Polishchicken breed, the Green-legged Partridge (GP). Cobb broilers present excellent feed conversion ratio, fast growth rate, and
the ability to thrive on low-density, low-cost feeds, whereas GP chickens are well adapted to extensive management, are able to graze and are resistant to diseases. Crossbred C x GP chickens are characterized by low body weight, typical for slow growing chicken, and good muscling, especially of the breast.
For the first two weeks, the chickens were kept indoors under a head radiator and received 24 h of light/day. Afterwards, they were allowed to use free ranges (2 birds/m2) and provided 18 h of light inside
the shed. All birds were kept in the same controlled environmental conditions until 63 days of age and received the same diets.
A four-phase feeding system was applied, with the supply of starter (0-2 weeks), grower 1 (3-4 weeks), grower2 (4-5 weeks) and finisher (from 6 weeks) feeds. The starter diet contained 3080 kcal ME/kg and 21.3% CP, the grower 1 diet contained 3160 kcal ME/kg and 20.8% CP, the grower 2 diet contained 3180 kcal ME/ kg and 19.9% CP, and the finisher diet contained 3200 kcal ME/kg and 19% CP. Feed and drinking water were offered ad libitum.
At 63 days of age, the chickens were electrically stunned in a water bath (120 mA, 50 Hz) for 2 s, and then slaughtered by severing the cervical blood vessels and bled for ca.3-4min. Out of the 425 total birds slaughtered, 92 birds were randomly selected and divided into two groups with similar abdominal fat percentage and body weight.The “fat” group, including 48 individuals, was characterized by high abdominal fat content (4.00-6.60%), and the “lean” group, with 44 birds, was characterized by low abdominal fat content (0.88-2.54%).The characteristics of the two groups of birds are presented in Table 1. Liver tissue samples(about 100 mg) from were collected the left lobes, immediately frozen in liquid nitrogen and then stored at -80°C until further analysis.
Table 1 – Characteristics of the two groups of birds
Trait “fat group” “lean group” Live body weight, g (LBW) 2840 ± 215.40 2516 ± 241.55 Carcass weight, g (CW) 2102 ± 211.55 1862 ± 254.65 Abdominal fat, g (AF) 89 ± 20.9 41 ± 10.1 Abdominal fat yield, % 4.2 ± 0.79 2.2 ± 0.43
Isolation of nucleic acids
2000 spectrophotometer (Thermo Scientific, Waltham, MA, USA) (Malewski et al., 2010). Extracted DNA was stored at -20°C.
Total RNA was extracted with a TRI Reagent (Sigma-Aldrich, St. Louis, MO, USA) according to the manufacturer’s instructions (Farrell, 1998). Briefly, about 100 mg of liver tissue were homogenized in 1 mL of TRI Reagent and incubated for 5 minutes at room temperature for complete dissociation of nucleoprotein complexes. After the addition of 0.2 mL chloroform, the samples were vortexed and incubated at room temperature for 15 minutes. The resulting mixture was centrifuged at 12,000 g for 15 minutes at 4°C. The water phase was transferred to a fresh Eppendorf tube and RNA precipitated with isopropanol. The obtained RNA was stored at -80°C. The amount of total RNA extracted was measured with a NanoDrop 2000 spectrophotometer (Thermo Scientific, Waltham, MA, USA). RNA integrity was electrophoretically checked in 1.5% agarose gel stained with ethidium bromide (Malewski et al., 2015). Only samples with high integrity were used for further analyses.
cDNA synthesis
In order to prevent probe contamination by genomic DNA, the total RNA was treated with RNase free DNase I (Sigma-Aldrich, St. Louis, MO, USA). One µg of RNA was treated with 1U of DNase I for 15 min
at room temperature. The reaction was stopped by adding the stop solution, and DNase I was inactivated at 70°C for 10 min. cDNA synthesis was carried out using Enhanced Avian HS RT-PCR Kit (Sigma-Aldrich, St. Louis, MO, USA), according the manufacturer’s instructions. Briefly, 1 µL of anchored oligo (dT)23 was added to 1 µg of DNase-treated RNA and incubated for 10 min at 70°C. After that, all remaining components were added and the reaction was run at 45°C for 50 min. The cDNA was used immediately in the PCR or stored at -20°C (Ciechanowska et al., 2008).
Primer design
Transcript-specific primers were designed using data information from the chicken genome assembly Gallus_gallus-5.0 (GenBank Acc NC_006099.4) using the software PRIMER 3 http://bioinfo.ut.ee/ primer3-0.4.0 (Koressaar & Remm, 2007; Untergasser
et al., 2012). The primer sequences are presented in Table 2.GAPDH was used as reference gene as in our previous experiments (Larkina et al., 2011). We applied the following primers for GAPDH expression profiling: GAPDHfw, CCTCTCTGGCAAAGTCCAAG and GAPDHrv, CATCTGCCCATTTGATGTTG. PCR primers were supplied by Sigma-Aldrich (Sigma-Aldrich, Milwaukee, WI, USA). Three pairs of primers were designed for sequencing the 5’-flanking region of NM_001001460 from -1944 to +15 (Table 3).
Table 2 – Primers used for gene expression analysis
Transcript Sequence Tm PCR product size (bp)
XM_015292931.1 FW: TATCCCACCAGAAGGGAACA 60.31 136 RV: ATGATCATCCATCGCAGACA 60.04
XM_015292932.1 FW: ACATTCACATTATGGTGCAATCA 58.56 153 RV: TGAAATCCAGAGGCCTTGTC 60.20
XM_015292933.1 FW: CGGCTGTCGGGAGATTACA 58.62 159 RV: TGTGGTGAAGAAATGCTTGAA 59.31
NM_001001460.1 FW: CAAGCTCCAGGATTGCCAAAG 59.80 159 RV: TGAAATCCAGAGGCCTTGTC 60.20
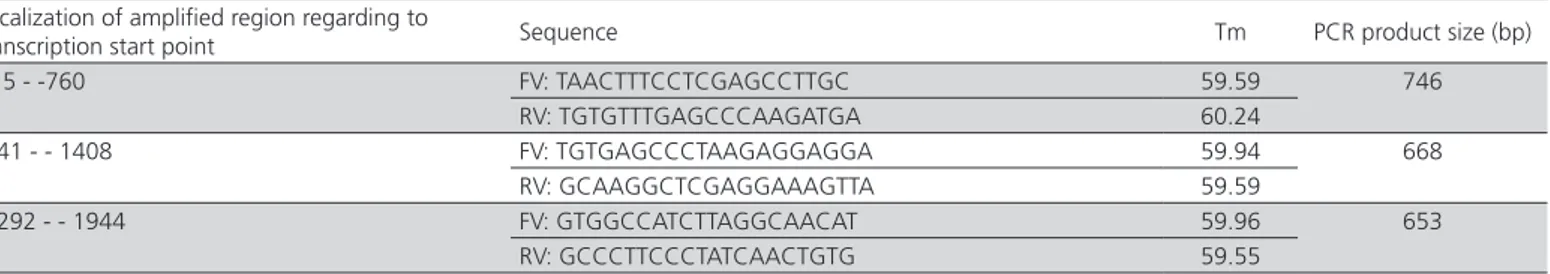
Table 3 – Primers used for amplification and sequencing of NM_001001460 5’-flanking region
Localization of amplified region regarding to
transcription start point Sequence Tm PCR product size (bp)
+15 - -760 FV: TAACTTTCCTCGAGCCTTGC 59.59 746
RV: TGTGTTTGAGCCCAAGATGA 60.24
-741 - - 1408 FV: TGTGAGCCCTAAGAGGAGGA 59.94 668 RV: GCAAGGCTCGAGGAAAGTTA 59.59
-1292 - - 1944 FV: GTGGCCATCTTAGGCAACAT 59.96 653 RV: GCCCTTCCCTATCAACTGTG 59.55
qPCR
The expression of PPARG transcript variants was measured by qPCR with the primers presented in Table 2. The obtained amplicons had a single melting peak
qPCR Master Mix (Sigma-Aldrich, Milwaukee, WI, USA). qPCR reactions (final volume of 20 µL) consisted of 1 µL of cDNA sample, 2.0 µL of the primer mix (5 µM of each primer), 10 µL of the 2x LuminoCt SYBR Green qPCR Master Mix, and 7 µL of H2O. The assay was performed in triplicate. All PCR reactions were performed as follows: an initial denaturation step at 95°C for 3 min, followed by 40 cycles at 95°C for 30 sec, 55°C for 30 sec, and 72°C for 30 sec. The analysis of the amplification melting-curve was then performed as follows: initial denaturation at 95°C for 60 sec, cooling to 72°C, and then gradual raising of temperature to 95°Cat0.5°Cincrements in each step. Fluorescence data were analyzed using the Tm calling module in the RotorGene 6000 software. The qRT-PCR analysis was performed in triplicate.
The 2DDCt method (Schmittgen & Livak, 2008) was
used to calculate the relative ratio, with correction for amplification efficiency. The efficiency of the PCR re-action was estimated by the noise-resistant iterative nonlinear regression algorithm (Real-time PCR miner; Zhao & Fernald, 2005). Intergroup differences in target gene expression were estimated applying two-tailed unpaired Student t-tests. Pearson’s correlation coeffi-cient was estimated for the linear relationship between gene expression and abdominal fat content using Excel 2010 software (Microsoft, United States). Results with
p<0.05 were considered statistically significant, and those with p<0.01 were considered highly significant.
Amplification and sequencing of 5’-flanking region of NM_001001460.1 PPARG gene transcript
A fragment of the PPARG gene 5’-flanking region (from -1944 to + 15 according to transcription start point) was amplified using three pairs of primers (Table 2).
Amplification was performed using reactions containing 20 μL RedTaq Ready Mix (Sigma-Aldrich), 3 μL of the corresponding primer (5 μM), 2 μL DNA template, and H2O to a total volume of 40 μL. All PCR reactions were performed in Veriti 96-Well Thermal Cycler (Applied Biosystems, Foster City, CA, USA) as follows: an initial denaturation step at 94°C for 3 min, followed by 35 cycles at 94°C for 30 s, 60°C for 30 s and 72°C for 1 min with a final incubation for 5 min at 72°C.
Excess dNTPs and unincorporated primers were removed from the PCR product using the Clean-Up Purification Kit (A&A Biotechnology, Gdynia, Poland). As a final step, the purified DNA was eluted in 40 μL H2O.
Sequencing PCR reactions consisted of 1 μL BigDye Terminator v. 3.1 Ready Reaction Mix (ThermoFisher Scientific, Waltham, MA, USA), 2 μL BigDye sequencing buffer (ThermoFisher Scientific), 1 μL (5 μM) forward or 1.6 μL (10 μM) reverse primer and H2O to 10 μL total volume. The thermal profile for sequencing reactions consisted of an initial denaturation step at 96°C for 1 min followed by 25 cycles at 96°C for 10 s, 50°C for 5 s and 60°C for 105 s. PPARG gene 5’-flanking region was sequenced with an ABI 3500xL genetic analyser (Applied Biosystems).
In-silico analysis of 5’-upstream sequences
The 5’-flanking regions (2.0 kb) upstream of the transcripts XM_015292931.1; XM_015292932.1; XM_015292933.1 and NM_001001460.1 of the PPARG (GenBank accession no. NC_006099.4) were analysed for putative transcription factor binding sites using the program LASAGNA2 (Lee and Huang, 2013), based on TRANSFAC database matrices for vertebrates. Localization of analyzed 5’-upstream sequences: XM_015292931.1 - 4827225-4829225; XM_015292932.1 - 4827447-4829447; XM_015292933.1 - 4857857-4859857 and NM_001001460.1 - 4858927-4860927.A cut-of p-value of 0.001 was applied. The CpG islands were predicted using the CpG Finder (http://www.softberry. com) program.
RESULTS
Expression of PPARG transcript variants
Based on the genomic structure of PPARG given in GenBank NC_006099.4 record, four variant-specific primer pairs (Table 2) were designed. Using these primers, we performed PCR on the cDNA synthesized on total RNA extracted from chicken livers. The obtained amplicons yielded a single product band with the expected size (136, 153, 159 and 159 bp for transcripts XM_015292931.1, XM_015292932.1, XM_015292933.1, and NM_001001460.1, respecti-vely) on agarose gel electrophoresis. The amplified PCR products were sequenced and their proving amplification of the of PPARG gene transcript.
variants was higher in the “fat” group; however, only one (NM_001001460.1) was statistically significant. The NM_001001460.1 transcript was upregulated in the liver with ratio of means of 4.26 (p≤0.01) in the
“fat” group relative to the “lean” group. The results showed a highly significant correlation between the expression level of the PPARG transcript variants in the liver and carcass fatness, as shown in Table 4.
Table 5 – Putative transcription factor (TF) binding sites in PPARG gene transcripts of the 5’-upstream sequences
Transcription factors
Common for all 5’-upstream sequences
AP-1, AP-2alpha, AP-2rep, AREB6, ARP-1, Barbie Box, C/EBP, CdxA, Myb, Myc, deltaEF1, Evi-1, Freac, GATA, GR, Hand1:E47, HOXA3, HSF, IRF, Max, MEF, NF-kappaB, NRSF, Oct-1, Pax-2, Sox-5, SRY, STAT, TGIF, USF, XFD-1 and YY1
TF shared by some transcript
AP-4, Arnt, ATF, Bach1, Brachyury, BSAP, cap(M00253), Cart-1, CCAAT box(M00254), Cdc5, CDP, c-Ets-1, CP2, CREB, E2F, Elk-1, FAC1, FOXD3, GCNF, HFH-1, HNF-1, HTF, Ik-2, Lhx3, Lmo2 complex, Lyf-1, Maf, MEIS1, MRF-2, MyoD, MZF1, Ncx, NF-1, NF-AT, NF-E2, NF-Y, Nkx2-2, NKX3A, NRF-2, Olf-1, p300p53, Pbx-1, POU6F1, RORalpha1, RP58, S8, Sp1, Spz1, SREBP-1, SRF, Tal-1alpha:E47TCF11, Tst-1, VBP, Xvent-1, Zic1 and ZID TF found in XM_015292931.1 only POU3F2
TF found in XM_015292932.1 Brn-2; Clox; COMP1; HLF; RFX1 and XBP-1 TF found in XM_015292933.1 Not found
TF found in NM_001001460.1 E4BP4; ER; Gfi-1; HEN1; MIF-1; PPARalpha:RXR-alpha and RSRFC4
Table 4 – Correlation of the expression of PPARG transcript variants in the liver of chickens
Transcript Ratio of means fat/lean
Correlation
With abdominal fat weight With relative abdominal fat content
XM_015292931.1 2.16 0.36 0.31
XM_015292932.1 1.63 0.41 0.37
XM_015292933.1 0.96 0.11 0.16
NM_001001460.1 4.26** 0.71** 0.59*
Figure 1 – Expression of PPARG gene transcripts in “lean” and “fat” broilers.
The expression of this gene was highly correlated with relative abdominal fat content (0.71, p≤0.01) and abdominal fat weight (0.59, p≤0.01). This is the first report on the correlation between transcript variants of PPARG in the liver and fatness in chickens.
Characterization of PPARG 5’-upstream sequences
The analysis of four PPARG 5’-upstream flanking regions for putative transcription factor binding sites showed that these sites can be divided into three groups: group I – putative binding sites present in all analyzed 5’-upstream sequences - 32 transcription factors, group II - putative binding sites shared by several 5’-upstream sequences - 59 transcription factors, and group III - putative binding sites unique for 5’-upstream sequence of particular transcript (Table 5). The results showed putative binding sites for several transcription factors important for adipogenesis, lipogenesis and lipolysis: CCAAT/enhancer binding protein (C/ EBP), (from -877 to -891 and from -1965 to -1979), hepatocyte nuclear factor 4 (HNH-4) (from -231 to -244; from -1569 to -1582 and from -1682 to -1695), PPAR:RXR (from -983 to -1002, from -1461 to -1475 and from -1685 to -1699), sterol regulatory element
binding transcription factor (SREBP) (from -473 to -484). Especially interesting was the presence of three putative binding sites of PPAR:RXR. These transcription factors putative binding sites were found only in the 5’-upstream sequence of NM_001001460.1, which may suggest the existence of a PPARG autoregulatory feedback loop. In addition, PPAR:RXR putative binding
sites for other six transcription factors (E4BP4, ER, Gfi-1, HEN1, MIF-1 and RSRFC4) were found at 5’-upstream sequence of NM_001001460.1 only.
(73.2% CG). Transcripts CpG islands were not found in the 5’-upstream sequence ofXM_015292933.1 and NM_001001460.1
Resequencing of 5’-flanking region of NM_0010 01460.1 showed the presence of four SNPs: G>A at position -353, C>T at -884, C>A at -991 and A>C at 1348. Two of them change putative transcription factor binding site: mutation -991C>A disrupts PPAR, while mutation -884C>T disrupts C/EBP putative binding site. Two other mutations, -353G>A and -1348A>C, did not affect transcription factors binding sites.
DISCUSSION
Lipogenesis occurs both in the adipose tissue and liver in mammals, whereas in avian species, the liver is the main lipogenic site. Gene expression analysis shows that the expression patterns of adipogenic transcription factors are different between mammals and avian species both in vitro and in vivo (Matsubara
et al., 2005).
Previous analysis showed that PPARG expression is more than 3-fold upregulated in “fat”chickens. The primer pairs used in that analysis, however, measured the expression of all gene transcripts (Larkina et al.,
2011). The design of transcript specific primers allowed us to measure the expression of each transcript reported for the PPARG gene (GeneID:373928). The expression of three PPARG gene transcript variants was upregulated in the liver of the “fat” chickens relative to the “lean” chickens; however, only the expression of thNM_001001460.1 transcript was statistically significant (4.26-fold,p≤0.01). Its expression is significantly correlated both with abdominal fat weight (0.59, p≤0.05) and relative abdominal fat content (0.71, p≤0.01) (Table 3). Alternative splicing of pre-mRNA plays an important role in regulating gene expression in higher eukaryotes. Alternative splicing of several genes has been reported to be important in adipogenic pathways: PPARγ (Mueller et al., 2002), Pref-1 (Mei et al., 2002), MC2R (Noon et al., 2006), ACBP (Ludewig et al., 2011). The three alternative splicing isoforms α, δ, and γ of the PPAR gene were detected in laying hens liver, and the isoform γ was significantly down regulated in 30-week-old compared with 20-week-old hens, while isoforms α and δ were not differentially expressed (Li et al., 2015). Differences in the expression of PPARG in chicken were reported by Duan et al. (2015); however, the transcripts described by them differ from transcripts reported in GeneID:373928.
The correlation between PPARG expression and obesity was reported in humans (Hindle et al., 2009). Chen et al. (2009) reported that mutations in ESR1
and PPARG were genetically linked with obesity in Han Chinese. In mammals, PPARG is present in two isoforms, PPARG1 and PPARG2, generated by alternative promoter usage. PPARG mediates the expression of fat-specific genes and activates adipocyte differentiation (Matsubara et al., 2005). The expression of both γl and γ2 mRNAs was abundant in mouse adipose tissue (Vidal-Puig et al., 1996). At lower levels,PPARG1 expression was also detected in heart, liver and spleen, while γl and γ2 mRNA were found in the skeletal muscle, and fasting reduced PPAR gamma protein levels in adipose tissue. Wang et al.
(2008) have shown that the transfection of in-vitro
synthesized small-interference PPARG RNA (siPPARG) in cultivated preadipocytes of 12-d-old chickens significantly inhibited the differentiation and stimulated the proliferation of preadipocytes. Sato et al. (2004) also reported a correlation between PPARG expression and fat deposition in broilers. Different amounts of PPARG proteins were found in the adipose tissue of divergently selected broilers (Wang et al., 2009). Li
et al. (2005) showed that PPARG affects chicken fat metabolism and that SNPs can be used in molecular assistant selection as a genetic marker for the chicken fatness traits. Our investigations of PPARG transcript variant expression in the liver of chickens showed that the expression of only one transcript variant is correlated with carcass fat content (Table 4).
Despite the importance of PPARG expression for adipogenesis and lipid metabolism, there are few data on its gene promoter analysis. Deletion analysis of NM_001001460.1 transcript 5’-upstream sequence (Ding et al., 2011) showed that the promoter is long and consists of positive and negative regulatory elements. Deletion of the − 1261 - − 1026 region significantly decreased promoter activity while the deletion of the region between − 1985 and − 1261 nucleotides increased promoter activity. Ding et al.
C/EBP binding sites were found in all transcripts, while ATF, HNF and SREBP only insome transcripts of the 5’-upstream sequence (Table 5). The presence of three putative PPAR binding sites at 5’-upstream region of NM_001001460.1 transcript suggests that one activated transcription of this transcript variant can be maintained throughout the chicken’s lifespan. Unfortunately, there is no information about other transcription factors (E4BP4; ER; Gfi-1; HEN1; MIF-1; PPAR, RSRFC4) specific for this transcript 5’-upstream sequence in the chicken liver (Table 5). In chickens, Hu
et al. (2010) reported an association of SNP in PPARG promoter with abdominal fat weight. A significant effect of PPARG promoter polymorphisms on the intramuscular fat content of the longissimus dorsi muscle was reported for Erhualian pigs (Wang et al.,
2013).
CONCLUSION
Excessive adiposity has become a major drawback in meat-type chicken production, and fat is currently considered a by-product of very little commercial value. The analysis of the expression the PPARg gene showed that the expression of its transcripts (NM_001001460.1) is more than four times higher in fat chickens than in lean chickens. Based on these results, we suggest that the PPARG NM_001001460.1 transcript is a potential candidate gene that highly influences the level of abdominal fat deposition in chickens.
ACKNOWLEDGEMENTS
The authors thank the National Science Centre for financing these studies of the first author (grant n.: 2012/07/B/NZ9/02206).
REFERENCES
Baeza E, Le Bihan-Duval E. Chicken lines divergent for low or high abdominal fat deposition: a relevant model to study the regulation of energy metabolism. Animal 2013;7(6):965–973.
Bourneuf EF, Hérault C, Chicault W, Carré S, Assaf A, Monnier S, et al. Microarray analysis of differential gene expression in the liver of lean and fat chickens. Gene 2006;10(372):162-170.
Cai Y, Song Z, Zhang X, Wang X, Jiao H, Lin H. Increased de novo lipogenesis in liver contributes to the augmented fat deposition in dexamethasone exposed broiler chickens (Gallus gallusdomesticus). Comparative Biochemistry Physiology- Part C: Toxicology & Pharmacology 2009;150(2):164–169.
Chen HH, Lee WJ, Fann CSJ, Bouchard C, Pan WH. Severe obesity is associated with novel single nucleotide polymorphisms of the ESR1 and PPAR gamma locus in Han Chinese. The American Journal of Clinical Nutrition 2009;90(2):255–262.
Chistiakov DA, Potapov VA, Khodirev DS, Shamkhalova MS, Shestakova MV, Nosikov VV. The PPARgamma Pro12Ala variant is associated with insulin sensitivity in Russian normoglycaemic and type 2 diabetic subjects. Diabetes Vascular Disease Research 2010;7(1):56-62.
Ciechanowska M, Łapot M, Malewski T, Mateusiak K, Misztal T, Przekop F. The central effect of –endorphin and naloxone on the expression of
GnRH gene and GnRH receptor (GnRH–R) gene in the hypothalamus, and on GnRH-R gene in the anterior pituitary gland in follicular phase ewes. Experimental and Clinical Endocrinology and Diabetes 2008;116(1): 40–46.
Cogburn LA, Wang X, Carre W, Rejto L, Aggrey SE, Duclos MJ, et al. Functional genomics in chickens: development of integrated systems microarrays for transcriptional profiling and discovery of regulatory pathways. Comparative and Functional Genomics 2004;5(3):253–261.
Dahlman I, Arner P. Genetics of adipose tissue biology. Progress in Molecular Biology Translational Science 2010;94:39-74.
Ding N, Gao Y, Wang N, Li H. Functional analysis of the chicken PPARγ gene 5’-flanking region and C/EBPα-mediated gene regulation. Comparative Biochemistry and Physiology Part B 2011;158(4):297–303.
Duan K, Sun Y, Zhang X, Zhang T, Zhang W, Zhang J, et al. Identification and characterization of transcript variants of chicken peroxisome proliferator-activated receptor gamma. Poultry Science 2015;94(10):2516-2527. Farrell RE Jr. RNA Methodologies. 2nd ed. New York: Academy Press; 1998.
Fouad AM, El-Senousey HK. Nutritional Factors Affecting Abdominal Fat Deposition in Poultry: A Review. Asian-Australasian Journal of Animal Science 2014;27(7):1057–1068.
Havenstein GB, Ferket PR, Qureshi MA. Carcass composition and yield of 1957 versus 2001 broilers when fed representative 1957 and 2001 broiler diets. Poultry Science 2003;82(10):1509–1518.
Heikkinen S, Auwerx J, Argmann AC. PPARγ in human and mouse physiology. Biochimica et Biophysica Acta 2007;1771(8):999–1013. Hindle AK, Koury J, McCaffrey T, Fu SW, Brody F. Dysregulation of
gene expression within the peroxisome proliferator activated receptor pathway in morbidly obese patients. Surgical Endoscopy 2009;23(6):1292-1297.
Hu G, Wang SZ, Wang ZP, Li YM, Li H. Genetic epistasis analysis of 10 peroxisome proliferator-activated receptor γ-correlated genes in broiler lines divergently selected for abdominal fat content. Poultry Science 2010;89(11):2341-2350.
Huang J, Yang D, Gao S, Wang T. Effects of soy-lecithin on lipid metabolism and hepatic expression of lipogenic genes in broiler chickens. Livestock Science 2008;118:53-60.
Kim JB, Wright HM, Wright M, Spiegelman BM. ADD1/SREBP1 activates PPARă through the production of endogenous ligand. Proceedings of the National Academy of Sciences of the United States of America 1998;95(8): 4333–4337.
Koressaar T, Remm M. Enhancements and modifications of primer design program Primer 3. Bioinformatics 2007;23(10): 1289-91.
Larkina TA, Sazanova AL, Fomichev KA, Barkova OY, Malewski T, Jaszczak K, et al. HMG1A and PPARG are differently expressed in the liver of fat and lean broilers. Journal of Applied Genetics 2011;52(2):225-228.
Lee C, Huang CH. LASAGNA-Search: an integrated web tool for transcription factor binding site search and visualization. BioTechniques 2013;54(3):141–153.
Li H, Wang T, Xu C, Wang D, Ren J, Li Y, et al. Transcriptome profile of liver at different physiological stages reveals potential mode for lipid metabolism in laying hens. BMC Genomics 2015;16:763.
Ludewig AH, Klapper M, Wabitsch M, Döring F, Nitz I. Differential expression of alternative Acyl-CoA binding protein (ACBP) transcripts in an inducible human preadipocyte cell line. Hormone and Metabolic Research 2011;43:440–442.
Malewski T, Draber-Mońko A, Pomorski J, Łoś M, Bogdanowicz W. Identification of forensically important blowfly species (Diptera: Calliphoridae) by high–resolution melting PCR analysis. International Journal of Legal Medicine 2010;127(4):277–285.
Malewski T, Bogdanowicz W, Durska E, Łoś M, Kamiński M, Kowalewska K. Expression profiling of heat shock genes in a scuttle fly Megaseliascalaris (Diptera, Phoridae). The Journal of Experimental Zoology Part A 2015;323A:704–713.
Mandrup S, Lane MD. Regulating adipogenesis. Journal of Biological Chemistry 1997;272(9):5367-5370.
Matsubara Y, Sato K, Ishii H, Akiba Y. Changes in mRNA expression of regulatory factors involved in adipocyte differentiation during fat acid induced adipogenesis in chicken. Comparative Biochemistry and Physiology Part A 2005;141(1):108–115.
Mei B, Zhao L, Chen L, Sul HS. Only the large soluble form of preadipocyte factor-1 (Pref-1), but not the small soluble and membrane forms, inhibits adipocyte differentiation: role of alternative splicing. Biochemical Journal 2002;364(pt1):137–144.
Michalik L, Auwerx J, Berger JP, Chatterjee VK, Glass CK, Gonzalez FJ, et al. International union of pharmacology. LXI. peroxisome proliferator-activated receptors. Pharmacological Reviews 2006;58(4):726–741.
Mueller E, Drori S, Aiyer A, Yie J, Sarraf P, Chen H, et al. Genetic analysis of adipogenesis through peroxisome proliferator-activated receptor gamma isoforms. Journal of Biological Chemistry 2002;277(44):41925– 41930.
Noon LA, Bakmanidis A, Clark AJ, O’Shaughnessy PJ, King PJ. Identification of a novel melanocortin 2 receptor splice variant in murine adipocytes: implications for post-transcriptional control of expression during adipogenesis. Journal of Molecular Endocrinology 2006;37(3):415– 420.
O’Hea EK, Leveille GA. Lipogenesis in isolated adipose tissue of the domestic chick (Gallus domesticus). Comparative Biochemistry and Physiology 1968;26(1):111–120.
Peter T, Bruce MS. Fat and beyond: the diverse biology of PPARgamma. Annual Review of Biochemistry 2008;77:289-312.
Richards MP, Poch SM, Coon CN, Rosebrough RW, Ashwell CM, McMurtry JP. Feed restriction significantly alters lipogenic gene expression in broiler breeder chickens. Journal of Nutrition 2003;133(3):707–715.
Royan M, Navidshad B. Peroxisome proliferator-activated receptor gamma (PPARγ), a key regulatory gene of lipid metabolism in chicken. World’s Poultry Science Journal 2016;72(4):773-784.
Sambrook J, Fritsch EF, Maniatis T. Molecular cloning: a laboratory manual. 2nd ed. New York: Cold Spring Harbor; 1989.
Sato K, Abe H, Kono T, Yamazaki M, Nakashima K, Kamada T, et al. Changes in peroxisome proliferator activatedreceptor ă gene expression of chicken abdominal adipose tissue with different age, sex and genotype. Animal Science Journal 2009;80(3):322–327.
Sato K, Fukao K, Seki Y, Akiba Y. Expression of the chicken peroxisome proliferator-activated receptor-gamma gene is influenced by aging, nutrition, and agonist administration. Poultry Science 2004;83(8):1342– 1347.
Schmittgen TD, Livak KJ. Analyzing real-time PCR data by the comparative C-T method. Nature Protocols 2008;3:1101–1108.
Untergasser A, Cutcutache I, Koressaar T, Ye J, Faircloth BC, Remm M, et al. Primer3 - new capabilities and interfaces. Nucleic Acids Research 2012;40(15):115.
VidaL-Puig A, Jimenez-Liñan M, Lowell BB, Hamann A, Hu E, Spiegelman B, et al. Regulation of PPAR gamma gene expression by nutrition and obesity in rodents. Journal of Clinical Investigation 1996;97(11):2553-2561.
Wang Y, Mu Y, Li H, Ding N, Wang Q, Wang Y, et al. Peroxisome proliferator-activated receptor-gamma gene: a key regulator of adipocyte differentiation in chickens. Poultry Science 2008;87(2):226-32.
Wang D, Wang N, Li N, Li H. Identification of differentially expressed proteins in adipose tissue of divergently selected broilers. Poultry Science 2009;88(11):2285-92.
Wang SZ, Hu XX, Wang ZP, Li XC, Wang QG, Wang YX, et al. Quantitative trait loci associated with body weight and abdominal fat traits on chicken chromosomes 3, 5 and 7. Genetic and Molecular Research 2012;11(2):956–965.
Wang H, Xiong K, Sun W, Fu Y, Jiang Z, Yu D, et al. Two completely linked polymorphisms in thePPARG transcriptional regulatory region significantly affect gene expression and intramuscular fat deposition in the longissimus dorsi muscle of Erhualian pigs. Animal Genetics 2013;44(4):458-62.