Rev Bras
Cineantropom
Hum
DOI: http://dx.doi.org/10.5007/1980-0037.2018v20n2p172
original article
Technical Indicators registered as a function of
the playing time in Brazilian basketball
Indicadores de desempenho registrados em função do
tempo no basquetebol brasileiro
Yura Yuka Sato dos Santos1
Lucas Antônio Monezi1
Milton Shoiti Misuta2
Luciano Allegretti Mercadante2
Abstract – Basketball performance analysis using technical indicators dissociated from the moment they occurred in the game seems to no longer respond to emerging issues of the game as it does not identify the periods when a team’s offensive efficiency has increased or decreased. The aim was to characterize and compare the technical indicators in the positive and negative periods and in the whole game of winning and losing teams in men’s professional basketball. Fourteen games of professional men’s teams of the “Novo Basquete Brasil” Championship in the regular 2011/2012 season were filmed and analyzed. The Kolmogorov-Smirnov test was used to verify data normality. The independent T test was used for variables with normal distribution and the Mann-Whitney test for vari-ables that did not present normal distribution, in order to compare teams’ performance. Analysis in the whole game showed that winning teams had significantly higher averages in successful 3-point field goals but in the positive periods, they showed higher averages for successful free throws, successful layups, defensive rebounds and defensive fouls, and in negative periods, losing teams made more defensive and offensive fouls. The teams’ performance in the whole game may not elucidate the determinant indicators for building the difference in the scoreboard. It is suggested that coaches should identify the periods of best and worst teams’ performance in the game and the indicators involved, preparing teams to overcome the negative periods and obtain more positive periods in the game.
Key words: Basketball; Statistical analysis; Time series studies.
Resumo – A análise de desempenho no basquetebol a partir de indicadores técnicos dissociados do momento em que ocorreram no jogo parece não mais responder às questões emergentes do jogo, pois não se identificam os períodos em que a eficiência ofensiva de uma equipe aumentou ou diminuiu. O objetivo foi caracterizar e comparar os indicadores técnicos nos períodos positivos, negativos e no jogo todo, entre equipes vencedoras e perdedoras no basquetebol profissional masculino. Foram filmados e analisados 14 jogos de equipes profissionais masculinas do Novo Basquete Brasil, na temporada regular de 2011/2012. Recorreu-se ao teste de Kolmogorov-Smirnov para verificar a normalidade dos dados. Para as variáveis com distribuição normal recorreu-se ao teste T de amostras independentes e para as variáveis que não apresentaram distribuição normal ao teste de Mann-Whitney, a fim de comparar o desempenho das equipes. A análise no jogo todo mostrou que as equipes vencedoras tiveram médias significativamente maiores em arremessos de três pontos certos, já nos períodos positivos tiveram em lances livres certos, bandejas certas, rebotes defensivos e faltas defensivas. Nos períodos negativos as equipes perdedoras fizeram mais faltas defensivas e ofensivas. O desempenho das equipes no jogo todo pode não elucidar os indicadores determinantes para a construção da diferença no placar. Sugere-se que os treinadores identifiquem os períodos de melhor e pior desempenho das equipes no jogo e os indicadores neles envolvidos, para preparar
1 University of Campinas. School of Physical Education. Campinas, SP. Brazil.
2 University of Campinas. School of Applied Sciences. Limeira, SP. Brazil.
Received: October 28, 2017
As a collective invasion sport, basketball has cooperative-opposition char-acteristics, involving phases of attack, defense and transition in the game1.
By being a dynamic, unpredictable and competitive game, understanding the technical indicators involved in victory and defeat has been the great mission of different groups, such as coaches, sports media and sports re-searchers5. Several indicators are investigated in the basketball game6-8, in
positioned attacks or counterattacks9-11, with technical performance being
the preferred factor of scientific investigation12. The performance in the
different technical indicators allows concluding on the quality of individual and collective actions 13. However, in most studies, the frequency of these
indicators is recorded considering the whole game4,5,13, presenting
limita-tions to answer some emerging queslimita-tions, such as the periods in which the technical performance of a team increases or decreases and which indicators are involved in these periods.
In the perspective of sequential and temporal analyses, methods for characterizing the game in different moments, called critical moments (CM) have emerged in literature. Ferreira, Volossovitch and Jaime Sam-paio14 defined CM as the time interval in which the difference in the
scoreboard varies between 6 and 10 points, scored in 4 to 8 ball possession (BP). “Balance” was characterized by a difference of up to 3 points in the scoreboard for the four quarters of the game and “imbalance” by a differ-ence of over 15 points in the first three quarters and above 10 points in the last quarter. Ferreira and Gomes15 proposed to determine and analyze
CM through the coefficient of variation of the difference in the scoreboard (CVDIFP), counted every minute of the game and every 6 BP. In this study, CMs were defined as CVDIFP values equal to or higher than the 95th percentile, which means that the CM value varies according to points
scored every 6 BP. However, these analyses do not allow identifying the times when each action was performed and their performance throughout the game. In addition, the critical periods that occur in the game in a period shorter than 4 and 6 ball possessions, as proposed by the authors, may not be identified. In this sense, the registration of the technical indi-cators according to the playing time allows characterizing the actions and periods involved in the construction of the difference in the scoreboard, establishing two types of periods in the game: a) periods of balance, in which teams alternatively score points or miss attacks, and the difference in the scoreboard does not vary by more than 3 points14 and b) positive/
negative periods, in which one team scores points and the other accumu-lates successive errors, and that the difference in the scoreboard increases (for the winning team) or decreases (for the losing team) by four or more points, considering that a difference of up to three points can be reversed in a single attack, such as successful free throws and/or technical fouls5.
Technical Indicators in Brazilian basketball Santos et al.
in the scoreboard, characterizing the winning and losing team. Thus, it is possible to plan trainings in order to optimize the positive periods and minimize the negative ones. Therefore, the overall aim was to characterize and compare technical indicators in the positive and negative periods, and in whole game of winning and losing teams in professional male basketball.
METHODOLOGICAL PROCEDURES
The non-participatory observational method proposed by Anguera et. al.16
was used. The sample was composed of 14 games of professional men’s teams that participated in the “Novo Basquete Brasil” (NBB) in the 2011/2012 regular season. The selection of the sample was intentional, due to the agreement with one of the participating teams and to the authorization of the NBB League. The 14 games were of the same team against all the other 14 participating teams. All procedures were approved by the Research Ethics Committee of the University of Campinas.
Procedures
The games were filmed by four digital cameras (JVC, model GZHD10, 30 Hz) set in the same conditions of focus, shutter and white adjustment. The images were analyzed with a sampling frequency of 7.5 Hz17. For the synchronization
and calibration of cameras and record of technical indicators and number of attacks, the DVideo software18,19 was used. The temporal synchronization of
cameras was performed using the 24-second ball possession clock20.
Among the technical indicators (TI) most used in scientific research, successful and unsuccessful free throws, successful and unsuccessful two- and three-point field goals, defensive and offensive rebounds, blocks, defensive and offensive fouls and turnovers2-4,21, in addition to successful and
cessful layups, successful and unsuccessful domains, successful and unsuc-cessful passes, sucunsuc-cessful and unsucunsuc-cessful ball replacements, ball possession recoveries, interceptions, violations, technical fouls, right and wrong dribbles, and technical time-outs, in order to describe any game. The frequency of the technical indicators was recorded as a function of playing time and normal-ized by the number of attacks (ATs) of each team, and multiplied by 100 (TI Normalized = TI / ATs x 100) in order to distinguish the game rhythm2,8,21.
Considering that in a period of game balance, the score does not change more than three points14, the positive period (PP) in this work was
considered as the time interval in which a team scored four or more points and the opponent scored no point, and the negative period (NP) as the corresponding to the positive period of the opponent. The number of PPs and NPs, and the number of attacks, scored points and duration of those periods, of winning and losing teams were recorded.
Data reliability
ability, with 3,804 TIs in 2 games, representing 14.3% of the total sample, in accordance with literature recommendations24. Reliability was verified
using the Cohen Kappa index26 and the results obtained (0.93 and 0.97
for intra-observer and 0.91 for inter-observer) were classified as “perfect”27.
Data analysis
The Kolmogorov-Smirnov test was used to verify data normality. For variables that presented normal distribution, the t test for independent samples was used and for variables that did not present normal distribu-tion, the Mann-Whitney test was used to compare the average frequency of TIs in the whole game (JT) in PPs and NPs, the duration and points per PP, and points per minute in PP, between winning and losing teams. The significance level was set at p≤0.05.
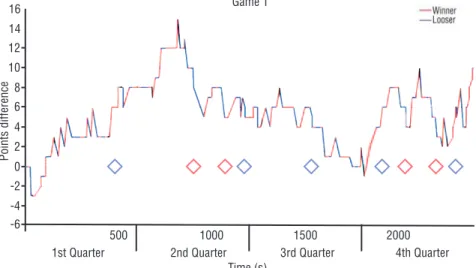
Figure 1 shows the dynamics of the difference in the scoreboard as a function of time of one of the games analyzed, each attack represented by a straight line with length given by the attack duration, the red color cor-responding to PP of the winning team and the blue color, the losing team. Technical time-outs are represented by triangles. The positive difference of scores is a function of the winning team. Figure 2 represents the dynam-ics of scores of the same example game, with PPs in black rectangles and NPs in orange rectangles, highlighted as a function of the winning team.
Figure 1. Example of the dynamics of point variation (Y axis) as a function of playing time in seconds (X axis)
Technical Indicators in Brazilian basketball Santos et al.
Figure 2. Example of the dynamics of point variation (Y axis) as a function of playing time in seconds (X axis), with positive periods (PPs) and negative periods (NPs) as a function of the winning team, respectively.
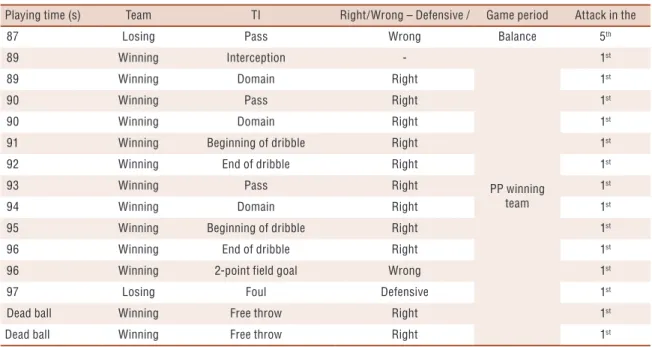
Table 1. Example of the sequence of TIs of the first attack of the winning team’s first PP.
Playing time (s) Team TI Right/Wrong – Defensive / Game period Attack in the
87 Losing Pass Wrong Balance 5th
89 Winning Interception
-PP winning team
1st
89 Winning Domain Right 1st
90 Winning Pass Right 1st
90 Winning Domain Right 1st
91 Winning Beginning of dribble Right 1st
92 Winning End of dribble Right 1st
93 Winning Pass Right 1st
94 Winning Domain Right 1st
95 Winning Beginning of dribble Right 1st
96 Winning End of dribble Right 1st
96 Winning 2-point field goal Wrong 1st
97 Losing Foul Defensive 1st
Dead ball Winning Free throw Right 1st
Dead ball Winning Free throw Right 1st
Technical indicator (TI), positive period (PP).
RESULTS
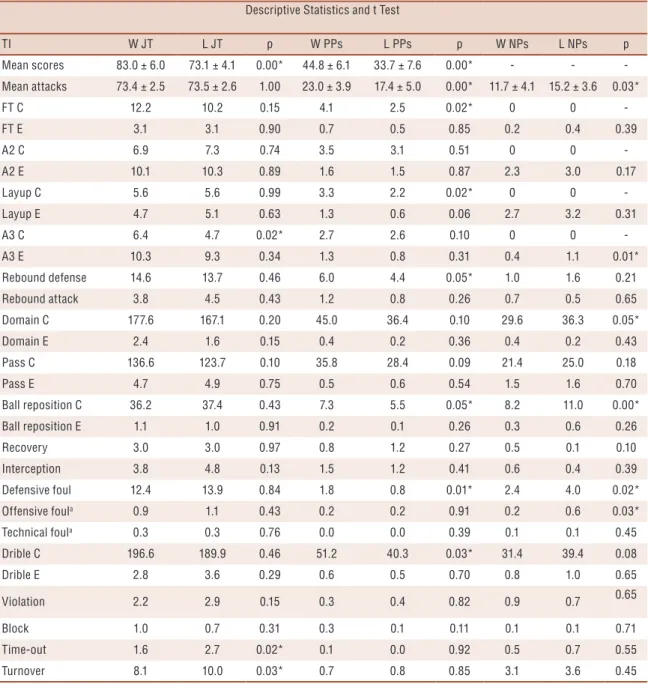
In the 14 games, 2,057 attacks, 26,603 TIs and 198 PPs/NPs were regis-tered. Table 2 shows the characterization of normalized TIs in the JT, in the PPs and NPs, with the results of the comparison between the means of scored points and number of attacks, as well as the average frequency of each TI of winning and losing teams in the 14 games.
layups, successful dribbles, defensive rebounds and successful ball repositions. In the negative periods, losing teams obtained significantly higher averages in unsuccessful 3-point field goals, defensive fouls, attack fouls, average number of attacks in NPs, right domains and successful ball repositions.
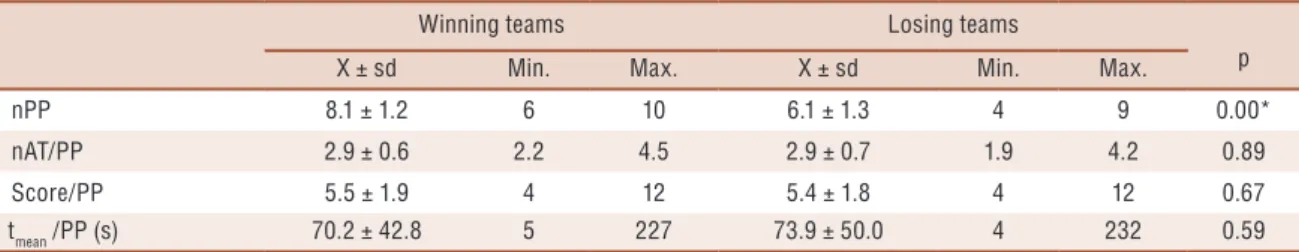
Table 3 presents the characterization and comparison of PPs between winning and losing teams, considering the number of attacks, scored points and duration.
Table 2. Technical indicators in the JT, PPs and NPs of winning and losing teams. Descriptive Statistics and t Test
TI W JT L JT p W PPs L PPs p W NPs L NPs p
Mean scores 83.0 ± 6.0 73.1 ± 4.1 0.00* 44.8 ± 6.1 33.7 ± 7.6 0.00* - -
-Mean attacks 73.4 ± 2.5 73.5 ± 2.6 1.00 23.0 ± 3.9 17.4 ± 5.0 0.00* 11.7 ± 4.1 15.2 ± 3.6 0.03*
FT C 12.2 10.2 0.15 4.1 2.5 0.02* 0 0
-FT E 3.1 3.1 0.90 0.7 0.5 0.85 0.2 0.4 0.39
A2 C 6.9 7.3 0.74 3.5 3.1 0.51 0 0
-A2 E 10.1 10.3 0.89 1.6 1.5 0.87 2.3 3.0 0.17
Layup C 5.6 5.6 0.99 3.3 2.2 0.02* 0 0
-Layup E 4.7 5.1 0.63 1.3 0.6 0.06 2.7 3.2 0.31
A3 C 6.4 4.7 0.02* 2.7 2.6 0.10 0 0
-A3 E 10.3 9.3 0.34 1.3 0.8 0.31 0.4 1.1 0.01*
Rebound defense 14.6 13.7 0.46 6.0 4.4 0.05* 1.0 1.6 0.21
Rebound attack 3.8 4.5 0.43 1.2 0.8 0.26 0.7 0.5 0.65
Domain C 177.6 167.1 0.20 45.0 36.4 0.10 29.6 36.3 0.05*
Domain E 2.4 1.6 0.15 0.4 0.2 0.36 0.4 0.2 0.43
Pass C 136.6 123.7 0.10 35.8 28.4 0.09 21.4 25.0 0.18
Pass E 4.7 4.9 0.75 0.5 0.6 0.54 1.5 1.6 0.70
Ball reposition C 36.2 37.4 0.43 7.3 5.5 0.05* 8.2 11.0 0.00*
Ball reposition E 1.1 1.0 0.91 0.2 0.1 0.26 0.3 0.6 0.26
Recovery 3.0 3.0 0.97 0.8 1.2 0.27 0.5 0.1 0.10
Interception 3.8 4.8 0.13 1.5 1.2 0.41 0.6 0.4 0.39
Defensive foul 12.4 13.9 0.84 1.8 0.8 0.01* 2.4 4.0 0.02*
Offensive foula 0.9 1.1 0.43 0.2 0.2 0.91 0.2 0.6 0.03*
Technical foula 0.3 0.3 0.76 0.0 0.0 0.39 0.1 0.1 0.45
Drible C 196.6 189.9 0.46 51.2 40.3 0.03* 31.4 39.4 0.08
Drible E 2.8 3.6 0.29 0.6 0.5 0.70 0.8 1.0 0.65
Violation 2.2 2.9 0.15 0.3 0.4 0.82 0.9 0.7 0.65
Block 1.0 0.7 0.31 0.3 0.1 0.11 0.1 0.1 0.71
Time-out 1.6 2.7 0.02* 0.1 0.0 0.92 0.5 0.7 0.55
Turnover 8.1 10.0 0.03* 0.7 0.8 0.85 3.1 3.6 0.45
Technical Indicators in Brazilian basketball Santos et al.
The results showed that winning teams had the highest average PPs per game compared to losing teams. There were no significant differences in relation to the mean of PP attacks, average scores per PP and average PP duration.
DISCUSSION
This study allowed identifying PPs and NPs in the games and TIs involved in them, evidencing differences in relation to the JT analysis. According to table 2, the average difference in the scoreboard between winning and losing teams in the JT (average of 9.9 points) is approximately the same difference in the scoreboard in PPs (average of 11.1 points). This result sug-gests that the other points that contributed to the construction of the final score are involved with the balance periods. Therefore, the performance in the different technical actions of the teams when analyzed in JT, may not present the same results when analyzing through specific moments that led to the construction of the difference in the scoreboard.
The JT analysis showed that winning teams had significantly higher averages in successful 3-point field goals. This result differs from some studies that have analyzed the JT performance in other championships, and found defensive rebounds, successful 2 and 3-point field goals, free throws and assists as discriminating of winning teams3,8,9.
In PPs, winning teams presented significantly higher averages of suc-cessful free throws, sucsuc-cessful layups, defensive rebounds and defensive fouls. The defensive rebound favors the accomplishment of the counterat-tack and the corresponding approach to the hoop9, as by layups or free
throws, after faults are committed by a destabilized defense. Layups are not separated from 2-point field goals in studies2-4; however, although
they have the same score, they have a particular characteristic, since they are finalizations with the progression of the player very next to the target, from one or two rhythmic times. Thus, to perform a layup, teams must explore the perimeter close to the target, which requires a large destabi-lization of the opponent’s defense, often in counterattack. In relation to fouls, although they are related to an unbalanced defense21, in PPs, they
may have the function of preventing an easy progression of the opponent to the target, making it difficult to score, and thus, the team maintains its
Table 3. Characterization and comparison of PPs between winning and losing teams
Winning teams Losing teams
p
X ± sd Min. Max. X ± sd Min. Max.
nPP 8.1 ± 1.2 6 10 6.1 ± 1.3 4 9 0.00*
nAT/PP 2.9 ± 0.6 2.2 4.5 2.9 ± 0.7 1.9 4.2 0.89
Score/PP 5.5 ± 1.9 4 12 5.4 ± 1.8 4 12 0.67
tmean /PP (s) 70.2 ± 42.8 5 227 73.9 ± 50.0 4 232 0.59
throws and guarantees defensive rebounds8.
In NPs, losing teams made significantly more defensive and offensive fouls, and missed more 3-point throws. In general, the less defense fouls, the better the defensive performance of a team21 thus, winning teams seem
to have a better defensive organization even in their NPs. When a foul is committed at the moment of the throw or when the team has already reached the limit of collective fouls, fouls benefit the opponents with free throws, corroborating those found in PPs. In addition, unsuccessful 3-point throws can also be the consequence of organized and aggressive defense. Turnovers were not considered significant in NPs, as they may be involved in balance periods. As a result, not all attacks that did not have basket attempts negatively influenced the construction of the difference in the scoreboard.
PPs were characterized by a variation between 4 and 12 points in ap-proximately 2 to 5 attacks, lasting from 1 to 4 minutes, for both winning and losing teams. These results differ from data of perception on CM reported by experienced coaches14. In addition, the study contrasts the
identification method from the CVDIFP value equal to or above the 95th
percentile15, since the results showed, in different games, that PPs have a
specific characteristic. In this way, coaches should be aware when the op-ponent team scores 4 or more points of difference, and possibly interrupt the PP requesting a more aggressive defense and/or technical time-out. On the other hand, to generate a PP, coaches must invest in a defense that makes throws difficult and guarantees defensive rebounds, and builds at-tacks or counteratat-tacks that facilitate infiltration into the three-point line in order to finish with layups and / or receive fouls that generate free throws.
Dividing PPs into categories for the stages of balance and imbalance of the game based on the score difference14,15 can be an important alternative
Technical Indicators in Brazilian basketball Santos et al.
CONCLUSION
Recording the technical indicators according to playing time in basketball was important to identify positive and negative periods, showing that the indicators that determine the final score difference, that is, those involved in the positive periods, are different from the indicators identified in the whole game.
Winning teams performed better on three-point throws, while losing teams committed more turnovers, according to JT analysis. However, the time-based analysis showed that in PPs, winning teams performed better in free throws, layups and defensive rebounds, and generated more PPs. In NPs, losing teams committed more fouls. Therefore, in the decisive periods for the construction of the difference in the scoreboard, winning teams had better offensive organization to search for approaching the target and a better defensive organization to make it difficult for the opposing throws and to guarantee defensive rebounds.
It is important for coaches to differentiate the performance analyses of teams according to the playing time to identify the team’s best and worst performance periods, as well as the players involved in mistakes and suc-cesses, guiding decision-making in the aim of overcoming negative periods and obtain more positive periods in the game.
REFERENCES
1. Lamas L, Barrera J, Otranto G, Ugrinowitsch C. Elementos estruturais de um modelo formal dos esportes coletivos de invasão. Rev Bras Educ Fís Esporte 2012; 26(4): 741-53.
2. Ibáñez SJ, Sampaio J, Feu S, Lorenzo A, Gomez M, Ortega E. Basketball game-related statistics that discriminate between teams’ season-long success. Eur J Sport Sci 2008; 8(6): 369-72.
3. García J, Ibáñez SJ, De Santos RM, Leite N, Sampaio, J. Identifying Basketball Performance Indicators in Regular Season and Playoff Games. J Hum Kinet 2013; 36: 161-8.
4. Puente C, Del Coso D, Salinero JJ, Abián-Vicén J. Basketball performance indica-tors during the ACB regular season from 2003 to 2013. Int J Perform Anal Sport 2015; 15(3): 935-48.
5. Santos YYS, Monezi LA, Misuta MS, Mercadante LA. Análise dos períodos positivos e negativos em jogos de basquetebol. Rev Min Educ Fís 2013; 9(1): 804-9.
6. Nunes JA, Costa EC, Viveiros L, Moreira A, Aoki MS. Monitoramento da carga interna no basquetebol. Rev Bras Cineantropom Desempenho Hum 2011; 13(1): 67-72.
7. Ibáñez SJ, Santos, JA, García J. Multifactorial analysis of free throw shooting in eliminatory basketball games. Int J Perform Anal Sport 2015; 15(3): 897-912.
8. Gómez AM, Lorenzo A, Sampaio J, Ibáñez SJ, Ortega E. Game-related statistics that discriminated winning and losing teams from the Spanish Men’s Professional Basketball Teams. Coll Antropol 2008; 32(2): 451-6.
9. Pojskić H, Šeparovic V, Užičanin E. Differences between successful and unsuc-cessful basketball teams on the final olympic tournament. Acta Kinesiol 2009; 3(2): 110-4.
CORRESPONDING AUTHOR
Yura Yuka Sato dos Santos Rua Pedro Zaccaria, 1300, Jardim Santa Luzia, Limeira, SP, Brasil. CEP 13484-350
E-mail: [email protected]
A, Ibañez S, Ortega, E, organizadores. Aportaciones teoricas y practicas para el baloncesto del futuro. Sevilla: Waceulen Editorial Deportiva; 2009. p.151-170.
13. Hughes M, Barllet RM. The use of performance indicators in performance analysis. J Sports Sci 2002; 20(10): 739-54.
14. Ferreira APP, Volossovitch A, Sampaio J. Towards the game critical moments in basketball: a grounded theory approach. Int J Perform Anal Sport 2014; 14(2): 428-442.
15. Ferreira APP, Gomes F. A casualidade da diferença pontual: uma possibilidade metodológica para o estudo dos momentos críticos no basquetebol. Rev Española Educ Fís Deportes 2011; 395(1): 29-46.
16. Anguera MT, Villaseñor AB, López JL, Mendo AH. La metodología observacional en el deporte: conceptos básicos. Lecturas Educ Fís Deportes 2000; 5(24): edf24b.
17. Barros RML, Misuta MS, Menezes RP, Figueroa PJ, Moura FA, Cunha SA, et al. Analysis of the distances covered by first division Brazilian soccer players ob-tained with an automatic tracking method. J Sports Sci Med 2007; 6(2): 233-42.
18. Moura FA, Martins LEB, Anido RO, Ruffino PRC, Barros RML, Cunha SA. A spectral analysis of team dynamics and tactics in Brazilian football. J Sports Sci 2013; 31(14): 1568-77.
19. Pereira TJC, Nakamura FY, Jesus MT, Vieira CL, Misuta MS, Barros RM, et al. Analysis of the distance covered and technical actions by professional tennis players during oficial matches. J Sports Sci 2017; 35(4): 361-8.
20. Monezi LA, Mercadante LA, Misuta MS. Reconhecimento automático do tempo de jogo no Basquetebol baseado em Processamento de Imagens. Proceedings of the SPS. Campinas: 2011.
21. Sampaio J, Janeira M. Statistical analyses of basketball team performance: under-standing teams’ wins and losses according to a different index of ball possessions. Int J Perform Anal Sport 2003; 3(1): 40-49.
22. Medina J, Delgado MA. Metodología de entrenamiento de observadores para investigadores sobre E. F. y Deporte en las que se utilice como método la obser-vación. Eur J Hum Mov 1999; 5(1): 69-86.
23. Hopkins WG. Measures of Reliability in Sports Medicine and Science. Sports Med 2000; 30(1): 1-15.
24. Tabanick BG, Fidell LS. Using multivariate statistics. New York: Allyn and Bacon; 2001.Hill M, Hill A. Investigação por questionário. Lisboa: Edições Sílabo; 2002.
25. Cohen, J. A Coefficient of Agreement for Nominal Scales. Educ Psychol Meas 1960; 20: 37-46.
26. Landis JR, Koch GG. The measurement of observer agreement for categorical data. Biometrics 1977; 33: 159-174.