Department of Finance
CORPORATE VALUATION: BNP PARIBAS CASE STUDY
Inês Sousa Marques
Project submitted as partial requirement for the conferral of Master in Finance
Supervisor:
Professor António Gomes Mota, Professor, Full professor, ISCTE Business School Department of Finance
II Abstract:
There are several methods that can be used to do a precise and accurate valuation. In this project, it will be made the valuation of an international company, BNP Paribas.
In order to evaluate BNP Paribas, the most recognized methods were chosen: the discounted cash flows, in firm’s optic, and the multiples.
The period considered for the analysis took place between 2014 and 2020, thus requiring assumptions for future evolution of the company.
The results obtained in this project points out towards the undervaluation of market price of the company. Two of the models used show a fair value per share higher than the current market value. Accordingly, there is a reasonable possibility that, in the short term, the bank's shares will appreciate.
Taking into account all factors presented and data obtained, this project conclusion recommends and supports a decision of buying (or holding) shares of BNP Paribas.
Keywords: BNP Paribas; Valuation methods; Discounted cash flow; Multiples
III Resumo:
Existem diversos tipos de metodologias que podem ser utilizadas para realizar uma avaliação precisa e adequada. Neste projeto será feita a avaliação de uma empresa internacional, o BNP Paribas.
Para avaliar o BNP Paribas foram escolhidos os métodos que tem mais reconhecimento entre os analistas: os fluxos de caixa descontados, na ótica da empresa, e os múltiplos.
O período considerado para a análise decorre entre 2014 e 2020, requerendo assim previsões para o desempenho futuro da empresa.
Os resultados obtidos ao longo deste trabalho apontam para uma subvalorização do preço de mercado da empresa. Dois dos modelos utilizados apontam um valor justo por ação superior ao valor de mercado. Querendo isto significar que existe uma elevada possibilidade de, a curto prazo, o valor das ações subir.
Tendo em conta todos os fatores apresentados e os dados obtidos, o projeto recomenda e apoia a decisão de compra (ou participação) de ações do BNP Paribas.
Palavras-chave: BNP Paribas; Métodos de avaliação; Fluxos de caixa descontados; Múltiplos.
JEL Sistema de Classificação: G30 (Finanças Corporativas); O20 (Plano de
IV Acknowledgements:
I would like to say a special word to all those who have been with me the last two years filled with so many changes and adventures.
I would like to thank my parents and my sister for all the support they have given me and for never let me give up, as well as for all the motivation they have given me.
I would also like to thank my supervisor, Professor António Gomes Mota for having accepted this adventure with me and for all the availability shown as well as for the suggestions and opinions he gave me so that we could do the best work possible.
To all my friends and family who understood my absence and who gave me strength, my thanks. Without you it would not have been possible.
Last but not leastI would also like to thank BNP Paribas for giving me the time necessary to carry out this project and especially my team for all the support.
My thanks to you all!
Agradecimentos:
Gostaria de deixar uma palavra especial a todos os que estiveram comigo durante estes últimos dois anos recheados de tantas mudanças e aventuras.
Gostaria de fazer um agradecimento especial aos meus pais e à minha irmã por todo o apoio que me deram e por nunca me terem deixado desistir, assim como por toda a motivação que me transmitiram.
Gostaria também de agradecer ao meu Orientador, o Professor António Gomes Mota por ter aceite entrar nesta aventura comigo e por toda a disponibilidade mostrada assim como pelas sugestões e opiniões que me deu para que conseguíssemos fazer o melhor trabalho possível. A todos os amigos e familiares que compreenderam a minha ausência e que me transmitiram força, o meu obrigada. Sem vocês também não teria sido possível.
Por fim, mas não menos importante, gostaria também de deixar um agradecimento especial ao BNP Paribas por me ter concedido o tempo necessário para a realização deste projeto e em especial à minha equipa por todo o apoio.
V Abbreviations:
BBVA: Banco Bilbao Vizcaya Argentaria
DCF: Discounted Cash Flow
DPS: Dividends per Share
CAGR: Compounded Annual Growth Rate
CAPEX: Capital Expenditure
CAPM: Capital Asset Pricing Model
CIB: Corporate Institutional Banking
COGS: Cost of Goods Sold
EBIT: Earnings before Interests and Taxes
EBITDA: Earnings before Interests, Taxes, Depreciations and Amortizations
EPS: Earnings per Share
EQV: Equity Value
EV: Enterprise Value
FCFE: Free Cash Flow to the Equity
FCFF: Free Cash Flow to the Firm
GDP: Gross Domestic Product
MVD: Market Value of Debt
MVE: Market Value of Equity NWC: Net Working Capital
VI PPE: Property Plant and Equipment
PV: Present Value
RBS: Retail Banking & Services
ROA: Return on Assets
ROE: Return on Equity
RV: Relative Valuation
VII Index: Abstract: ... II Resumo: ... III Acknowledgements: ... IV Agradecimentos: ... IV Abbreviations: ... V Index ... VII Table Index: ... IX Figure Index: ... X I. Introduction ... 11
II. Literature Review ... 12
2.1. Discounted Cash-flow methodology ... 13
2.1.1. Free Cash Flow to the Firm ... 14
2.1.1.1. Weighted Average Cost of Capital ... 15
2.1.1.2. Capital Asset Price Model ... 17
2.1.2. Free Cash Flow to the Equity ... 19
2.2. Relative Valuation – Multiples ... 20
III. Company Overview ... 22
3.1. Brief History and Company’s characterization ... 22
3.2. Shareholder Structure ... 24
3.3. Vision, Strategy and Values ... 25
IV. Financial Analysis ... 27
4.1. Key Indicators... 27
4.1.1. Return on Equity (ROE) ... 27
4.1.2 Return on Assets (ROA) ... 28
VIII
V. Corporate Valuation ... 31
5.1. Key Drivers for Projections ... 31
5.2. Discounted Cash Flow ... 32
5.2.1. Weighted Average Cost of Capital (WACC) ... 33
5.2.2. Free Cash Flow (Firm Approach) ... 34
5.3. Relative Valuation (Multiples) ... 35
5.4. Sensitive Analysis ... 37
5.4.1. Free Cash Flow to the Firm ... 37
5.5. Comparison of results from valuation methods ... 38
VI. Conclusions and Recommendation ... 39
VII. Appendixes ... 40
7.1. Balance Sheet ... 40
7.2. Income Statement ... 42
7.3. Cash Flow Statement ... 43
7.4. P&L Accountancy ... 44
7.5. Changes in Liabilities ... 45
7.6. Beta Regression ... 46
7.7. BNP Paribas Market Structure ... 46
7.8. WACC – Cost of Equity ... 47
7.9. Yield to Maturity of BNP Paribas Bonds ... 47
IX Table Index:
Table 1: Multiples – Fermandez’s Proposal ... 20
Table 2: Multiples – Damodaran’s Proposal ... 21
Table 3: Return on Equity – BNP Paribas and Competitors ... 27
Table 4: Return on Assets – BNP Paribas and competitors ... 28
Table 5: Estimation of WACC ... 33
Table 6: Cash Flows of BNP Paribas using FCFF ... 34
Table 7: Estimation of Enterprise value, Equity value and Value per share - FCFF ... 35
Table 8: Peer Group - Multiples ... 36
Table 9: Valuation using Multiples ... 36
Table 10: Sensitive Analysis - FCFF ... 37
Table 11: Fair value using different methods ... 38
Table 12: Balance Sheet ... 40
Table 13: Income Statement ... 42
Table 14: Cash Flow Statement ... 43
Table 15: P&L Account ... 44
X Figure Index:
Figure 1: Share Ownership of BNP Paribas ... 24
Figure 2: BNP Paribas Share Price ... 30
Figure 3: Value per share using the different methods ... 38
Figure 4: Beta Regression ... 46
Figure 5: BNP Paribas Capital Struture ... 46
Figure 6: Cost of Equity ... 47
11 I. Introduction
Corporate valuation is a matter of great interest for companies and investors. With corporate valuation is possible to achieve a fair price of an asset or of an enterprise and it allows to take sound investment and divest decisions in the business world.
There are several methods to perform corporate valuation since the simplest to the more complex ones. However, the more used in practice are the discounted cash flow (DCF) and multiples.
These methodologies require assumptions and forecasts and there are also subjective factors. In order to make a solid evaluation, it is advisable to know deeply the firm that is being analysed and ensure that all the relevant information is integrated into the analysis.
In the next chapter, both methods will be presented in detail. In chapter III, it is presented the BNP Paribas’s history, shareholder structure, vision, strategy and values.
In chapter IV, it will be presented the main competitors of BNP Paribas and their performance, as well as the performance of BNP Paribas shares' over the last ten years. The computations regarding BNP Paribas and the application of valuation methods are included in chapter V.
Lastly, chapter VI presents the conclusions concerning the results obtained and the project’s final recommendation.
12 II. Literature Review
One of the most important concepts to understand is the concept of value. But what is value? Contrary to what is generally believed, value is not the price in the markets, value is, instead, how much an asset is worth. In other words, it is not the price we pay but the price at which we are willing to pay, ensuring that an investor does not spend more than its value.
Brealey, Myers, and Allen (2011) defined value as a measure of performance and, in fact, valuation is not more than an analysis of performance of a company during a given period and a forecast for the future.
Perez and Famá (2003) described value of a company as a reflection of its utility for those who evaluate it. However, there are factors that cannot be forgotten, namely the utility and human preference. These two factors are not directly measureable causing a degree of subjectivity when computing the company’s fair price. According to the authors, price is unique and exact, it is the precise amount of money involved in a financial transaction of a firm. Following this, the fair price will be considered as a starting price for negotiations between buyers and sellers. However, emotional and speculative factors may also be reflected in the final price.
“Fernandez (2007, p. 21) considered that “the process of valuing the company and its business units helps to identify sources of economic value creation and destruction within the company””. By other words, for Fernandez, valuation allows managers and owners to develop different strategies according to the economic value. For example, a unit that is creating value should have a strategy to expand and, on the other hand, a unit that is destroying value should be extinct, aiming both decisions the maximization of the value of the company for the shareholders. Furthermore, Fernandez affirmed that managers should be evaluated and monetarily compensated accordingly to the value creation of their strategies. In the case of listed companies, the author also adds that corporate valuation is useful for management purposes, it means that is possible to verify if the shares are undervalued or not. And it permits to compare the fair price of a company with the current price of a share on the market and decide what is the best investment decision, from buying to the selling the shares. When talking about public offerings, “The valuation is used to justify the price at which the shares are offered to the public”, Fernandez (2007, p. 23).
13 Although valuation requires the use of quantitative methods, Damodaran (2002) described valuation as a non-exact science, because there is a need to take factors as assumed that can be true or not exactly true. In short, valuation is usually based on subjectivity and assumptions. For instance, when a valuation is being computed for the next 5 years, there are some values that have to be assumed; however the economic or social situation can change and affect some assumed elements such as corporate tax or interest rate.
To conclude this topic, Damodaran (2006) defended that valuing a company is not an objective process, because it depends on the beliefs and expectations of the appraiser.
Damodaran (2006) said that to do an accurate analysis, analysts have to use a large number of models, since the simplest to a more sophisticated one. These models require some assumptions that can impact directly the value of a company.
In fact, and the majority of authors agree, a solid analysis has to be done using several methods simultaneously, as there is not any method that, from a theoretical or practical perspective, shows a dominant power over the other methods. In fact, all authors, agree that there is not any model or method that can be considered as totally correct, unquestionable or exact to value a business. So, there is not an absolute and correct method to valuate a firm, taking into consideration that each one can only provide a referential value generated with some assumptions.
2.1. Discounted Cash-flow methodology
Discounted Cash flow methodology is one of the most used methods to perform corporate valuations, project valuations or even to analyze investment opportunities.
Fernandez (2007) argued that valuation methods, mainly the ones based on discounting cash flows, are becoming more popular. And as these kind of methods analyze a company as a whole, it is measureable as a financial asset.
Brealey, Myers, and Allen (2011) stated that the current value of an asset is equal to the future cash flows generated by the asset, discounted at the opportunity cost of capital. For them, the application
14 of DCF methods is quite simple, it is only needed to estimate the cash flows for the following years, and discounting them at a rate which reflects the risk.
There are two main methods within the discounted cash flow methodology: the discounted cash flow to the firm (FCFF) and discounted cash flow to equity (FCFE).
The FCFF expresses the amount of cash in the firm, available for shareholders and financial creditors after paying all the expenses and reinvestments. And the FCFE reflects the amount of cash available to shareholders paying all expenses, debt contracts inclusive, and making all reinvestments. Both methods will be analyzed in detail below.
Discounted cash flow valuation methods have advantages and disadvantages. For Damodaran (2006), when the methods are applied properly, they imply an analysis in order to understand the business, as well as, a deep research to ascertain the sustainability of cash flows and risk. In Damodaran’s opinion, the DCF analysis should be focused on the fundamentals that drive value instead of market perceptions. On the other hand, as Damodaran defended, if the analysis is done by “sloppy hands” the DCF can be easily manipulated generating values without any intrinsic value relationship. DCF is also a methodology that requires more information, because there is a need to estimate cash flows, discount and growth rates.
2.1.1. Free Cash Flow to the Firm
The free cash flow to the firm is designated as a measure of financial accomplishment. It is a way to measure the profitability of the company and is a good representation of its performance.
The FCFF values the business of the company and not the capital itself as it happens with the FCFE.
The value of the business is obtained through the discount of operational cash flows, deducting the investment needs at a rate that reflects the company’s risk, the weight average cost of capital - WACC.
15 FCFF = EBITDA × (1 – t ) + (Depreciations / Amortizations) × t – Capex – Changes in Net
Working Capital (1) Where:
t – Corporate tax rate
In FCFF optic, the company’s value is find out through the formula:
𝐂𝐨𝐦𝐩𝐚𝐧𝐲′𝐬 𝐕𝐚𝐥𝐮𝐞 = 𝐅𝐂𝐅𝐅𝟏 (𝟏+𝐖𝐀𝐂𝐂)𝟏 + 𝐅𝐂𝐅𝐅𝟐 (𝟏+𝐖𝐀𝐂𝐂)𝟐 + ⋯ + 𝐅𝐂𝐅𝐄𝐧 (𝟏+ 𝐖𝐀𝐂𝐂)𝐧 + 𝐅𝐂𝐅𝐅𝐧×(𝟏−𝐠) 𝐖𝐀𝐂𝐂−𝐠) (𝟏+ 𝐖𝐀𝐂𝐂)𝐧 (2) Where:
WACC - Weight average cost of capital (discounted rate) FCFFn- Free cash flows generated by the company on period n g - Growth rate
FCFFn x (1-g) – From year g, cash flows will increase at a constant rate (g)
The FCFF does not include the cash flows from financial nature; it reflects only the movements generated by the operations and which are available to repay / remunerate all the capital holders.
If a firm has a FCFF positive, it allows to conclude that the company is able to save money after all expenses. On the other side, if a company has a negative FCFF, it means that revenues were not enough to cover all the costs and reinvestments.
2.1.1.1. Weighted Average Cost of Capital
Modigliani and Miller (1958) created the theoretical framework behind the concept of WACC. For them, the cash flows generated by a company should be discounted at a rate that reflects the risks of the business. They further stated that the goal of a firm is to maximize its value, and to do it, the level of debt and the level of equity have to be determined in order to get a WACC as lower as possible.
16 Vernimmen et al. (2014) defended that the weighted average cost of capital (WACC) is the required rate of return by shareholders or investors to finance the company’s projects.
Briefly, WACC is the discount rate that will be used to discount the future cash flows available to all investors. It is also considered as the minimum required rate of return by shareholders investors.
The formula that will be used to compute WACC is the following:
𝑊𝐴𝐶𝐶 = 𝐸
𝐸+𝐷 × 𝑅𝑒+ 𝐷
𝐸+𝐷 × 𝑅𝑑 × (1 − 𝑡) (3)
Where:
E - Market value of equity D - Market value of debt Re - Cost of equity Rd - Cost of debt t - Corporate tax rate
𝐸
𝐸+𝐷 - Percentage of equity in capital structure 𝐷
𝐸+𝐷 - Percentage of debt in capital structure
The market value of equity (E) is basically the market capitalization, and that value can be obtained through the multiplication of the company’s current stock price per the number of outstanding shares. The market value of debt (D) is the value of long term liabilities of the firm.
The cost of debt (Rd) should be the current rate that the company is paying for its debt, and it can be calculated though the formula:
𝑅𝑑 = (𝑟𝑓+ 𝑐𝑟𝑒𝑑𝑖𝑡 𝑠𝑝𝑟𝑒𝑎𝑑) × (1 − 𝑡) (4) Where:
rf - Risk free rate
credit spread – rate that firm has to pay due to its rating notation t - Corporate tax rate
17 The computation of the cost of debt (Rd) may varies according to the type of financing. For instance, if the debt comes from bonds, the coupon rate can be used as the cost of debt, if those bonds are quoted to nominal value.
The cost of equity (Re) can be computed using the capital asset pricing model (CAPM).
A company’s WACC can increase or decrease over time, for example, if the rate of return on equity increase, the WACC will rise. And an increase in WACC means a higher risk for investors.
In theory, the most appropriate approach would be to calculate a WACC for each year, however, in practice the value used is often the same for all years, assuming that the variables will not suffer changes throughout the valuation horizon.
2.1.1.2. Capital Asset Price Model
According to Perold (2004), the capital asset price model was developed in 1960s by William Sharpe (1964), Jack Treynor (1962), John Lintner (1965) and Jan Mossin (1966).
The CAPM responds to a fundamental question in finance: how the risk of an investment should affect its expected return. The CAPM model is based on the idea that asset prices should not be affected by all risks. The capital asset pricing model reflects the relation among the risk and the expected return on an investment.
Usually, CAPM is used to decide the price to pay for a specific unit of stock. For instance, if there are two different units of stock, stock A and stock B, where stock A is riskier than stock B, in theory, the value of stock A should be lower than stock B as a way to compensate the investors for choose an asset with a higher risk.
Brealey, Myers, and Allen (2011) suggested two assumptions for CAPM theory:
1 – The investment in US treasury bills is considered as a risk-free investment; 2 – Investors can lend or borrow cash at the same interest rate.
18 However, the authors, also considered that these two assumptions have some limitations. For example, in the case of United States of America, the probability of default is not zero but is almost null, so the treasury bills are not 100% risk-free, but as the percentage of default is very low, it is assumed as risk-free. They also affirmed that the assumptions can be reformulated in order to become more realistic. For them, Brealey, Myers, and Allen (2011), the aim is to prove that investors are pleased to invest their money in limited number of benchmark portfolios.
The CAPM formula is:
𝑅𝑒 = 𝑟𝑓 + 𝛽 × (𝑅𝑚 − 𝑅𝑓) (5) Where:
Re - Cost of equity Rf - Risk-free rate β - Beta of the asset
(Rm – Rf ) - Market risk premium
The main idea behind CAPM theory is that an investor needs to be compensated taking in consideration two factors: the time value of money and the risk. The time value of money is present in the formula through the risk-free (rf) and it represents the compensation to the investor for placing money for a period of time. By other words, the risk free is the minimum rate than an investor can obtain on investments without associated risk such as US treasury bills or German Bonds. The other part of the CAPM formula expresses the risk and it represents the additional compensation that an investor needs for taking that risk. The risk measure is represented by Beta (β) and it provides the comparison between the return on an asset to the market over a specific period of time with the return on an asset to the market premium (rm – rf). It means that this formula defines the return of the market in excess of the risk-free rate.
The Beta (β) reveals how risky an asset is when compared with the market risk. It is a measure of systematic risk and it is a function of the volatility of the price of a company’s stock and the market. The β can be equal to 1, higher than 1 or lower than1. If β = 1, the price of the company’s stock will change with the market. If β > 1, the company’s stock price is more volatile than the market. And if β < 1 imply that the price of the company’s stock is less volatile than the market.
19 Summing up, the CAPM model demonstrates that the expected return on a company’s stock or on a portfolio equals the rate on a risk-free asset plus the risk premium. If this expected return does not meet or exceed the required return, the investment should not be realized.
2.1.2. Free Cash Flow to the Equity
According to Damodaran (2006), the free cash flow to the equity method (FCFE) expresses the available value to be distributed to the shareholders after paying all expenses, tax and interest obligations, as well as making all the reinvestments.
The FCFE can be computed through the discounting of total cash flows generated by the company, deducting the investment needs, at the cost of equity rate.
FCFE = Net Income + (Depreciations / Amortizations) – Capex – Changes in Net Working
Capital + (New debt raised – Debt payment)
In FCFE optic, the equity value is figured out by formula:
𝑬𝒒𝒖𝒊𝒕𝒚 𝑽𝒂𝒍𝒖𝒆 = 𝑭𝑪𝑭𝑬𝟏 (𝟏+𝑹𝒆)𝟏 + 𝑭𝑪𝑭𝑬𝟐 (𝟏+𝑹𝒆)𝟐 + 𝑭𝑪𝑭𝑬𝟑 (𝟏+𝑹𝒆)𝟑+ ⋯ + 𝑭𝑪𝑭𝑬𝒏 (𝟏+𝑹𝒆)𝒏 + 𝑭𝑪𝑭𝑬𝒏×(𝟏−𝒈) 𝑹𝒆−𝒈) (𝟏+𝑹𝒆)𝒏 (6) Where:
Re- Cost of equity
FCFEn- Free cash flows generated by the company on period n g - Growth rate
FCFEn x (1-g) – From year g, cash flows will increase at a constant rate (g)
In FCFE, the discounting rate reflects only the risk of equity and not the risk of debt; so we can assume that the discounted rate is the required rate of return for shareholders.
The limitations of discounted cash flow methods are pretty much linked to how predictable the firm’s cash flows are and to the difficulty of understanding the risk of each company.
20 Koller, Goedhart and Wessels (2010) made a distinction between firm optic and equity optic. For them, the equity optic is harder to implement because the capital structure is embedded in the cash flows, hence is more difficult to perform forecasts. So, the authors recommended the use of the firm optic to perform a company valuation.
2.2. Relative Valuation – Multiples
Damodaran (2006) stated that the purpose of the relative valuation is to evaluate an asset based on how similar assets are valued by the market. The methodology of multiples does not require so many assumptions as discounted cash flow methodology does and it is much simpler to work with. By other words, when this method is used to valuate equity, it is more straightforward, particularly when the number of comparable companies, listed on the market, is large.
Fernandez (2015) considered that multiples are mainly useful in a second stage of valuation, implying that this method should be used as a complement. A comparison between multiples of similar companies allows to perform a valuation and recognize differences among the firm valued and the peer group. A peer group is a group composed by companies with similar characteristics; typically from the same industry and preferably listed on the stock exchange, so their market value is known. Fernandez proposed the segmentation of multiples into three categories: multiples based on capitalization; multiples based on company’s value and growth referenced multiples. The first sub category is the easiest to understand. The second, instead of market capitalization, it uses the sum of the firm’s capitalization and financial debt. This sum is often called as Enterprise value. And the third is used mostly in growing industries, for instance technology or telecommunication.
Please, find hereunder a resume of Fernandez‘s sort of multiples in categories:
→ Price Earnings Ratio = PER → Price to Book Value
→ Price to Sales
→ Enterprise Value to EBITDA → Enterprise Value to Sales
→ PER / growth of earnings per share in the next few years → Enterprise value to EBITDA growth
Multiples based on Company's Value Growth-Referenced Multiples Multiples based on Capitalization
Source: Adptaded - Fernandez (2015) Table 1: Multiples: Fernandez's ProposalTable 1: Multiples – Fermandez’s Proposal
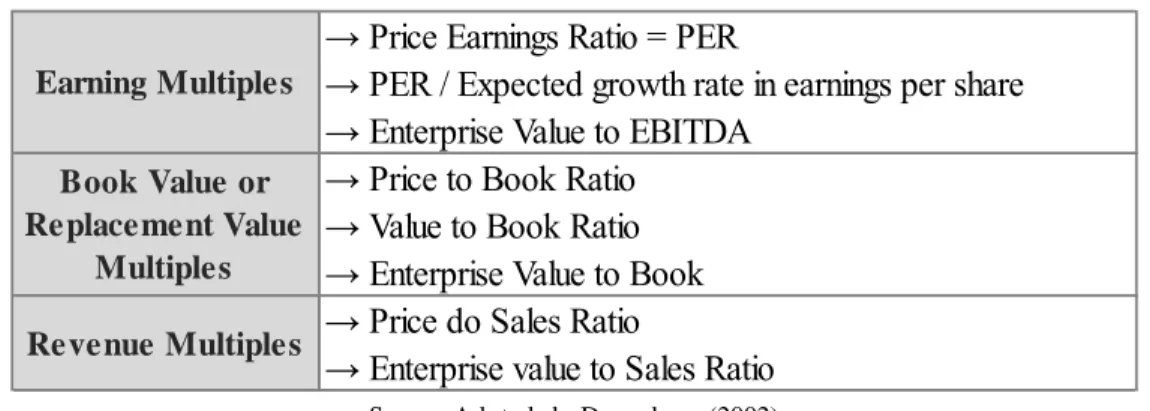
21 On the other side, for Damodaran (2002) was necessary to standardize the results to get a better contrast between identical companies. So, the Damodaran’s Proposal was to split multiples in three categories, as well as Fernandez did, but in different ones. For Damodaran (2002), multiples should be divide in: Earning multiples; Book value or Replacement value multiples and revenue multiples. The first category considers the value of a multiple as the earnings it generates. The standardization of multiples using book value will analyze if the price of the share is undervalued or overvalued comparing with the market price. The last category considers the revenues that an asset generates. This last category has the advantage of allowing to compare companies from different geographies with different accounting systems.
Please, find below a resume of Damodaran‘s division of multiples in categories:
Regardless the model used to do the relative valuation, the important is to ensure that the multiples used are measured in a similar way in the companies that are being evaluated in order to reflect real and accurate values.
There is an extensive list of multiples, the use of each one depends on the industry that is being analyzed, as Fernandez (2002) concluded.
The multiples that are most used to perform valuations are: PER (Price to Earnings ratio); Price / Sales, Price / Book value and Enterprise value / EBITDA.
The multiple PER gives a measure of how much an investor is paying for each unit of net income. For instance, a company with a higher PER, should have also a higher value implicit per share, so is more expensive than a share of a company with a low PER
→ Price Earnings Ratio = PER
→ PER / Expected growth rate in earnings per share → Enterprise Value to EBITDA
→ Price to Book Ratio → Value to Book Ratio → Enterprise Value to Book → Price do Sales Ratio
→ Enterprise value to Sales Ratio
Table 2: Multiples: Damodaran's Proposal
Earning Multiples
Book Value or Replacement Value
Multiples Revenue Multiples
Source: Adptaded - Damodaran (2002)
22 III. Company Overview
3.1. Brief History and Company’s characterization
The history of BNP Paribas began in the 19th century, when France experienced a political revolution, an economic meltdown and, consequently, the economy dropped. BNP Paribas is a global bank established in Paris, France and BNP Paribas shares are listed on CAC 40 Index. BNP Paribas results from the merger between “Banque Nationale de Paris” with “Paribas” on 22nd May, 2000.
Banque Nationale de Paris was created in 1996 through the fusion among “Comptoir national d'escompte de Paris” and “Banque nationale pour le commerce et l'industrie”. Paribas results from the merger between “Banque de Crédit et de Dépôt des Pays-Bas” and “Banque de Paris” in 1872. In 1999, Societe Generale started bidding for Paribas, however, BNP also started bidding for Paribas and one year after, BNP and Paribas got together in the markets becoming only one, BNP Paribas. Starting in 2000, the ambition was to create a genuinely European banking group with a global vocation lead to establish BNP Paribas Group. In the following years, acquisitions have significantly enhanced its strong European presence.
In 2005, the BNP Paribas acquired Türk Ekonomi Bankası (TEB) in Turkey and in 2006 bought Banca Nazionale del Lavoro (BNL) in Italy. In 2008, BNP Paribas bought 75% of Fortis in Belgium and 66% in Luxembourg. In 2009, the acquisition of Fortis was completed, changing the name to BNP Paribas Fortis and BGL BNP Paribas. In order to enter in the Polish market, BNP Paribas purchased a polish division of Rabobank’s bank – that changed the name to BGZ BNP Paribas, in 2013. In United States of America, BNP Paribas operates though BancWest.
Around year 2007, the world faced a financial crisis, and BNP Paribas was one of the few biggest banks to keep a positive performance due to an extensive and solid risk control strategy and implemented monitoring mechanisms. That financial crisis required, later, the compliance with new regulatory constraints that led to the increase of equity funds and segregation and separation of different activities, namely investment banking from commercial banking.
In the first years of the 21st century, the banking sector began to face a digital challenge. Although BNP and Paribas, with the collaboration of Compagnie bancaire (Compagnie bancaire was bought
23 by Paribas in 1998), had been the pioneers in moving to be a multi-channel banking, the growing acceleration of digitalization around the world, the increasing mobility in customer use and the arising of new competitors, were factors that required an increasingly active and innovative bank. These were the reasons that led to the creation of “Hello Bank!”. Hello Bank! was created in 2013 and was the first bank fully developed to be used on a mobile. This bank was made on a European scale and at the same time, it included an adaptation of domestic bank networks to satisfy all the client needs.
Actually, BNP Paribas divides its business into two categories: Retail Banking & Services (RBS) and Corporate Institutional Banking (CIB). RBS contemplates domestic markets and international financial services.
Retail Banking & Services on domestic markets includes French, Belgium, Italian and Luxembourg retail markets, as well as leasing solutions, personal investors and equipment solutions through Arval. Regarding international finance services, BNP Paribas has the following services: International Retail banking (out of Eurozone), Personal Finance, BNP Paribas Cardif, BNP Paribas Wealth Management, BNP Paribas Asset Management and BNP Paribas Real Estate.
Corporate & Institutional banking is composed by BNP Paribas Security Services and Global Markets – corporate banking. This segment of BNP Paribas handles fixed income, equities and derivatives, commodity derivatives, investment banking, structured finance and corporate transactions.
Actually, the challenge is to be an international leader to face the challenges of the digital revolution in a changing world.
BNP Paribas is present in seventy-four countries and provides access to around a hundred markets worldwide.
In terms of numbers, BNP Paribas has about 192.092 employees; 32.000 individual costumers and 1.000 professional costumers. Last year, BNP Paribas had revenues of €42.9 billion.
24 Figure 1: Share Ownership of BNP Paribas
Concerning debt ranking, the outlook provided by the three major agencies of ranking, Moody’s, Fitch and Standard & Poor’s, is cohesive. Both agencies agree that BNP Paribas is a stable company.
BNP Paribas is on track to become one of the world's leading financial institutions.
3.2. Shareholder Structure
The shareholder structure of BNP Paribas is pretty diversified. Banking institutions to single employees are among the bank's owners.
The shareholders hold more than 1 248,4 million of shares, on 30th June, 2017. The biggest owner is European Institutional investors followed by non-European. These Institutional investors keep about 73.8% of BNP Paribas. In 3rd stage, SFPI – “Société Fédérale de Participation et d'Investissement” – representing Belgian Government with 7.7%. 5.1% belongs to an American fund, BlackRock who is a leading global on asset manager. 4.3% of the shares concerns employee’s investments and another 4.3% belongs to others and unidentified companies or individuals. The remaining 3.8% of shares are under representation of retail shareholders.
25 3.3. Vision, Strategy and Values
In a world of constant changes, there is a need to reaffirm the industries, their activities, what they pretend to be in the future and their ambitions.
In BNP Paribas case, the vision, mission and values are what determine their actions and decisions to lead the bank for a changing world.
Concerning BNP Paribas Vision, the bank aspires to be a reference between European banks with a global reach. The bank intends to be a partner to the clients and to be a good contributor to a sustainable and responsible global development.
BNP Paribas pretends to have a positive impact to their stakeholders (clients, employees and shareholders) and to the society.
The BNP Paribas highly committed teams seek to deliver services with high quality as well as solutions to their clients through their integrated model of work. To the employees, BNP Paribas proposes an inspiring and stimulating environmental place to labour.
The above mentioned integrated model is a business model based on cooperation between the business and risk diversification groups. This model provides the company with the stability needed to adapt to changes and to offer innovative solutions to its customers. The BNP Paribas as a group serves about thirty two million of individual clients and more than eight hundred and fifty professional clients, as well as entrepreneurs, and small, medium and large corporate clients in retail banking network. In personal finance, BNP serves about twenty seven million of active clients.
With global reach, the company has specific business lines. BNP Paribas has a complete range of solutions, which are easily adaptable to the needs of each client. These solutions go through payments, cash management, traditional and specialised financing, savings, protection insurance, wealth and asset management as well as real-estate services (BNP Paribas website, 2017).
In corporate and institutional banking area, BNP Paribas offers personalized solutions to the capital markets, securities services, financing, treasury and financial advisory. (BNP Paribas website,
26 2017). BNP is present in seventy-four countries and it aims to help the clients to grow internationally.
In terms of industry, BNP Paribas aims to be among the most trustworthy companies, supported by the intrinsic values and ethics that characterized BNP daily behaviours.
In order for the bank to continue its strategy and growth in the market, there are fundamental values to be followed, such as agility, constant worry with customer satisfaction, compliance culture and openness. These four features can be called as driving forces of BNP Paribas.
Regarding strength, the main highlights by BNP Paribas are stability, expertise, responsibility and good place to work.
27 IV. Financial Analysis
Two of the main significant indicators regarding the performance of a company are ROE and ROA. These indicators will be analysed in detail and will be compared with the principal competitors in Euro zone: Banco Santander (Spain), Credit Agricole (France), Banco Bilbao Vizcaya Argentaria – BBVA (Spain), and ING Group (Netherlands). These indicators are also important when we look at the company as an opportunity to invest.
4.1. Key Indicators
4.1.1. Return on Equity (ROE)
Return on equity is an indicator to analyse the profitability of a firm. The ROE expresses how well a company is using the reinvestment earnings to create additional earnings. By other words, ROE represents the profit that a company is able to create with the investment made by shareholders. It indicates how many euros of profit a firm can generate with each euro invested by shareholders.
Table 3: Return on Equity – BNP Paribas and Competitors Return on Equity in % 2014 2015 2016 BNP Paribas 7,60% 8,3% 9,3% Banco Santander SA 7,69% 7,07% 6,93% Credit Agricole SA 4,91% 6,58% 5,94% BBVA 5,71% 5,48% 7,34% ING Group 1,02% 8,09% 9,53%
According to data available on the Bloomberg platform, the BNP’s ROE is increasing over time and it is expected a positive trend for the future. A positive trend is also visible on ING Group, it shows a significant increase from 2014 until the end of 2016.
However, the same is not happening with the other competitors. Banco Santander shows a drop year after year, nevertheless, the decrease on 2015 were much higher than in 2016.
Source: Bloomberg
28 Credit Agricole had a good growth until 2015 but after presents a small decrease. BBVA shows a similar situation, but in opposite sense. BBVA’s ROE decreased in 2015 but in 2016 it jumped up. For instance, in 2016, BNP Paribas generated €0.093 of profit for each euro invested.
4.1.2 Return on Assets (ROA)
Another significant indicator is the return on assets. ROA measures the profitability of a business related with the total of its assets. This indicator allows to understand the efficiency of management when using the own assets to beget earnings. ROA provides the return generated by each euro invested by the company.
Table 4: Return on Assets – BNP Paribas and competitors Return on Assets in % 2014 2015 2016 BNP Paribas 0,01% 0,33% 0,38% Banco Santander SA 0,48% 0,45% 0,46% Credit Agricole SA 0,15% 0,22% 0,23% BBVA 0,43% 0,38% 0,48% ING Group 0,12% 0,50% 0,50%
On ROA, BNP Paribas keeps a positive trend, as well as Credit Agricole and ING Group. The ROA enables to check whether the profit margin increases or deteriorates: for example, between 2014 and 2015, the BBVA’s profit margin suffered a decrease, in spite of being recovering actually. Banco Santander seems to be roughly equal over time.
In the concrete case of BNP Paribas, for each euro invested on assets on 2016, it created €0.0038 of net income. Source: Bloomberg Figure 1: BNP Paribas Share PriceSource: Bloomberg
29 4.2. Share Performance Analysis
In the below figure is possible to analyse the shares price performance over the last ten years. The lowest value was registered on 23/01/2009 and was €20,78. The possible reasons for that decrease may be associated with the high investment made by the company and the economic situation in the world. The highest record of shares price was on 23/05/2007, before the world economic crisis. The value was approximately €91,59.
From the most recent data, 2012 was the year with lower values. These values were consequence of a capital market crisis. Despite the unfavourable environment, BNP Paribas got goods and solids results. Furthermore, the group was doing a plan to implement in a near future to become simpler and more efficient in order to simplify functions and improving operating efficiency. That plan shows success on 2013 and 2014, indeed, the shares price increased.
In 2016, BNP Paribas faced an external challenge: the interest rates were significantly low. A new business development plan was drawn: that plan is supposed to be launched in 2017 and is applicable until 2020. It aims to accelerate the digital transformation and build up an ambitious policy of corporate social responsibility.
Concerning the total shareholders return, the value of dividends per share is increasing. According to available information in Bloomberg, the dividend adjusted value is being higher than security price since middle of 2014. However, the cumulative total return presents higher values since beginning of 2017.
Regarding 2017, and until now, the price are running well above the average of the last years. For instance, if a shareholder bought a share on 31/08/2016 (€45,605) and sold it on 31/08/2017 (€63.91) he had a profit of about €18, compared with the value spent in 2016, which corresponds to an increase of 28.4% of the share price.
30 Source: Bloomberg
Source: Bloomberg
31 V. Corporate Valuation
5.1. Key Drivers for Projections
Last year, a business plan was drawn with specific guidelines aiming to increase the already solid performance. This business plan was developed taking in consideration the current economic scenario, thus it considers a moderated, gradual and differentiated economic recovery for the following years.
Concerning the macroeconomic environment, the group expects an increase in interest rates until 2020 as well as a moderate growth of gross domestic product (GDP) in America and also in Eurozone and on emerging markets.
The model supports an integrated and diversified business model. By other words, the group pretends to have a well-balanced model divided in three classes: domestic markets, international financial services and corporate and institutional banking. Retail banking & services will be the responsible for more than 50% of the equity in 2020.
Until 2020, BNP Paribas proposes to itself to become more effective and digital, improving the procedures and platforms and attracting more clients.
At sales level, the group wants to strengthen the sales and marketing in a gradually improving atmosphere. The bank expects to have a favourable environment in the next years allowing a significant growth until 2020.
The financial targets in 2020 are also more stringent. The group intends to have an increase in growth higher than 2.5% and a drop on costs of more than €2.7 billion showing a rise on efficiency, accoding to data available in business plan. In terms of profitability, the bank expects to reach a return on equity of 10%. Related to capital, the group pretends to increase the pay-out ratio to 50%. This plan is ambitious, but the objective is to have a rise of 6.5% in net income per year until 2020. This goal is a challenge for the whole group but that is achievable with effort and dedication of all who form the BNP Paribas.
In terms of assumptions made for the valuation exercise, the revenues until the end of 2017 will increase 4.0% when compared with the previous year. In 2018 is expected a rise of 3.5%. And from
32 2019, revenues should maintain a growth of 3%. As an increase is expected in revenues, the most likely to happen with COGS (cost of goods sold) and other costs are also an increase, however in a different proportion. In 2017, for both items, the values should rise 20%. From 2018, a drop to 10% is expected, and that value sould remain in the following years. An identical situation will occur with depreciation: it will increase 5% in 2017 and after it will drop to 3% until 2020.
Regarding net operation cost, this item will also increase. In 2017 is waited a raise of 14%, and a decrease of 2% each year, meaning that in 2018 will be 12%, in 2019 will be 10% and in 2020 will be 8%.
Concerning capital gains, it is expected a constant increase of 3.5% until 2020. Towards taxes, it is assumed that will maintain the same value of 2016, 27.6%. Summing up, these assumptions cause a positive impact EBITDA until 2020.
The amount related to variation of working capital and capex the amounts will remain constant from 2017 until the end of the considered period.
With all these assumptions, it is important to ensure that the group will be able to comply with the business plan developed. After 2020, the perpetuity assumes a growth rate of 3%.
5.2. Discounted Cash Flow
The FCFF method is the most used method in practice. And FCFE is more conceptual, requiring a greater number of assumptions and it is less used. Thus, in this valuation, only FCFF will be presented.
33 5.2.1. Weighted Average Cost of Capital (WACC)
For WACC computation, there was a need to make some assumptions:
- Risk free Rate - value extracted from Bloomberg (check appendix 7.8).
- Equity Market Risk Premium - country spread and risk premium estimated by Bloomberg (consult appendix 7.8).
- β - adjusted beta for BNP Paribas group valued by Bloomberg (see appendix 7.6).
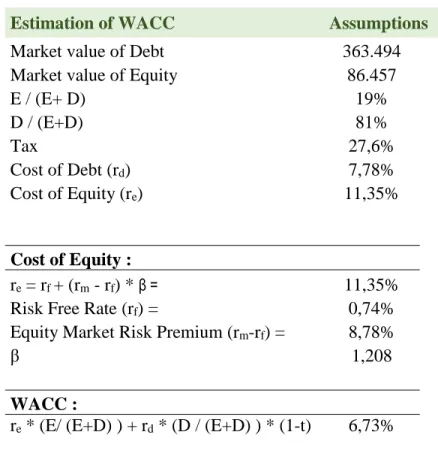
- Cost of debt – Assuming a yield to maturity of a BNP Paribas bond for 7 years (with beginning on 26/09/2013 until 27/09/2021) estimated by Bloomberg (verify appendix 7.9). Taking in consideration the assumptions made, the WACC used to discount the cash flows is 6.73%. (Check table 5)
Table 5: Estimation of WACC
Estimation of WACC Assumptions
Market value of Debt 363.494
Market value of Equity 86.457
E / (E+ D) 19%
D / (E+D) 81%
Tax 27,6%
Cost of Debt (rd) 7,78%
Cost of Equity (re) 11,35%
Cost of Equity :
re = rf + (rm - rf) * β = 11,35%
Risk Free Rate (rf) = 0,74%
Equity Market Risk Premium (rm-rf) = 8,78%
β 1,208
WACC :
re * (E/ (E+D) ) + rd * (D / (E+D) ) * (1-t) 6,73%
Source: Bloomberg
34 5.2.2. Free Cash Flow (Firm Approach)
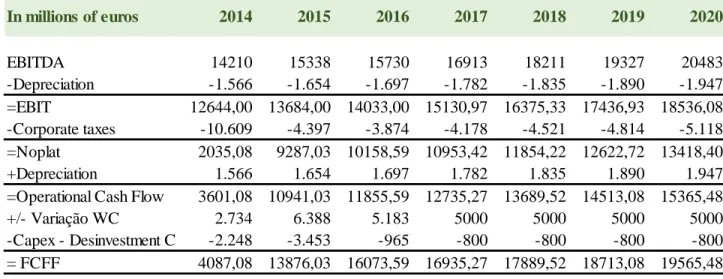
Considering the data available above, the cash flows generated using the firm approach are the following:
A first and simple analysis can be done only looking to the cash flows. The values are positive over the considered period and they are increasing year after year. It allows to conclude that the company is creating value and it is able to pay its investments.
Applying the formula (2), it is possible to find the enterprise value, considering a growth rate of 3%. Enterprise Value = 𝟒𝟎𝟖𝟕.𝟎𝟖 (𝟏+𝟔.𝟕𝟑%)𝟏 + 𝟏𝟑𝟖𝟕.𝟎𝟔 (𝟏+𝟔.𝟕𝟑%)𝟐 + 𝟏𝟔𝟎𝟕𝟑.𝟓𝟗 (𝟏+𝟔.𝟕𝟑%)𝟑+ 𝟏𝟔𝟗𝟑𝟓.𝟐𝟕 (𝟏+𝟔.𝟕𝟑%)𝟒+ 𝟏𝟕𝟖𝟖𝟗.𝟓𝟐 (𝟏+𝟔.𝟕𝟑%)𝟓+ 𝟏𝟏𝟖𝟕𝟏𝟑.𝟎𝟖 (𝟏+𝟔.𝟕𝟑%)𝟔 + 𝟏𝟗𝟓𝟔𝟓.𝟒𝟖 (𝟔.𝟕𝟑%−𝟑%) (𝟏+𝟔.𝟕𝟑%)𝟔 (7)
Enterprise Value =
€
422.726,35 MillionSource: Bloomberg Source: Bloomberg In millions of euros 2014 2015 2016 2017 2018 2019 2020 EBITDA 14210 15338 15730 16913 18211 19327 20483 -Depreciation -1.566 -1.654 -1.697 -1.782 -1.835 -1.890 -1.947 =EBIT 12644,00 13684,00 14033,00 15130,97 16375,33 17436,93 18536,08 -Corporate taxes -10.609 -4.397 -3.874 -4.178 -4.521 -4.814 -5.118 =Noplat 2035,08 9287,03 10158,59 10953,42 11854,22 12622,72 13418,40 +Depreciation 1.566 1.654 1.697 1.782 1.835 1.890 1.947
=Operational Cash Flow 3601,08 10941,03 11855,59 12735,27 13689,52 14513,08 15365,48
+/- Variação WC 2.734 6.388 5.183 5000 5000 5000 5000
-Capex - Desinvestment Capex-2.248 -3.453 -965 -800 -800 -800 -800
= FCFF 4087,08 13876,03 16073,59 16935,27 17889,52 18713,08 19565,48 FREE CASH FLOW OF THE FIRM (FCFF)
35 Table 7: Estimation of Enterprise value, Equity value and Value per share - FCFF (in € Million)
Estimation of Equity Value
Enterprise Value = 422.726,35
+ Non Business Assets 447.160,35 - Financial Debt 363.494,00
Equity Value = 83.666,35
Number of shares 1.248,43
Implied Value per
Share € 67,02
In order to compute the company’s market value, it is necessary to add up the non-business assets and subtract the financial debt. And finally, the equity value over the total number of outstanding shares give us the implied value per share.
Applying the FCFF method, the fair price of a BNP Paribas share is € 67.02.
5.3. Relative Valuation (Multiples)
Relative valuation is used to estimate the value of a company’s share based on companies with similar characteristics traded in stock exchanges.
The companies to integrate the peer group were selected using the suggestion of Bloomberg. The peer group of banking sector is composed by four European banks with identical profiles.
Taking into account the specificities of the industry in question, the most appropriate multiples for the evaluation are:
Entreprise Value EBITDA Entreprise Value
Revenues
PER – Price to Earnings Ratio
Source: Bloomberg
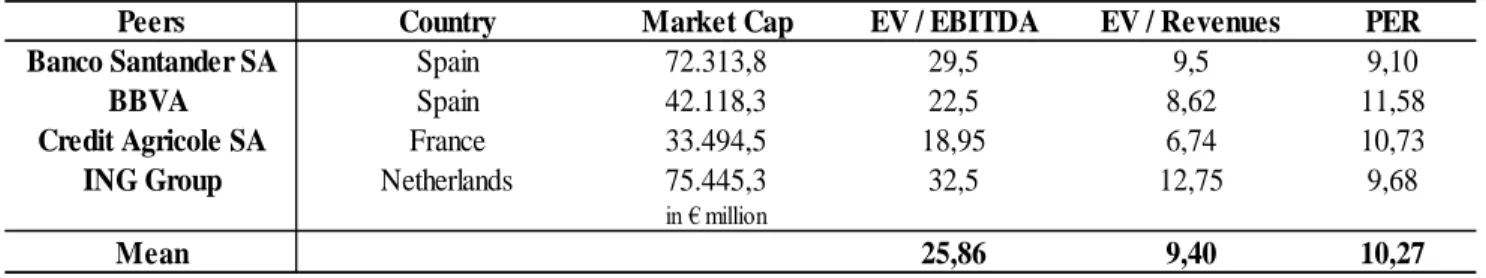
36 Considering the values obtained in table 8, it was computed the mean for each multiple, as it is possible to verify in the last line of that table.
The multiples EV / EBITDA and EV / Revenues allowed the computation of enterprise value through the multiplication of the mean obtained in peer group times BNP Paribas EBITDA or Revenues, accordingly. After, the addition of the non-business assets and the subtraction of debt to the EV, it led to the computation of the equity value.
Concerning the PER multiple, the equity value was found by multiplying the company´s net income by the peer average multiple.
Summing up, with this methodology is possible to verify that the implied value per share using the three different multiples differs in almost € 13. The multiples EV / EBITDA and EV / Revenues got lower values than PER. However, the value of a share using PER is closer to reality when compared with the current market value.
Source: Bloomberg
Source: Bloomberg Source: Bloomberg
Table 10:Valuation using MultiplesSource: Bloomberg
Peers Country Market Cap EV / EBITDA EV / Revenues PER
Banco Santander SA Spain 72.313,8 29,5 9,5 9,10
BBVA Spain 42.118,3 22,5 8,62 11,58
Credit Agricole SA France 33.494,5 18,95 6,74 10,73
ING Group Netherlands 75.445,3 32,5 12,75 9,68
in € million
Mean 25,86 9,40 10,27
EV / EBITDA EV / Revenues PER
Peer Group (Average) 25,86 9,40 10,27
BNP Paribas 15.730 43.411 8.115
Enterprise Value 406.817 408.172 N.A.
Non-business Assets 24.434 24.434
Debt 363.494 363.494
EQV = 67.757 69.112 83.353
Shares Outstanding 1.248 1.248 1.248
Implied Value p/ share 54,27 55,36 66,77
Table 9:Peer Group - Multiples
Table 9:Valuation using Multiples
37 5.4. Sensitive Analysis
The sensitive analysis aims to understand how the price per unit of stock change when some factors increase or decrease.
5.4.1. Free Cash Flow to the Firm
In FCFF approach, the two factors that can easily suffer changes due to market fluctuations are: discounted rate (WACC) and growth rate. These two factors have a big impact on enterprise value and consequently on the price per share.
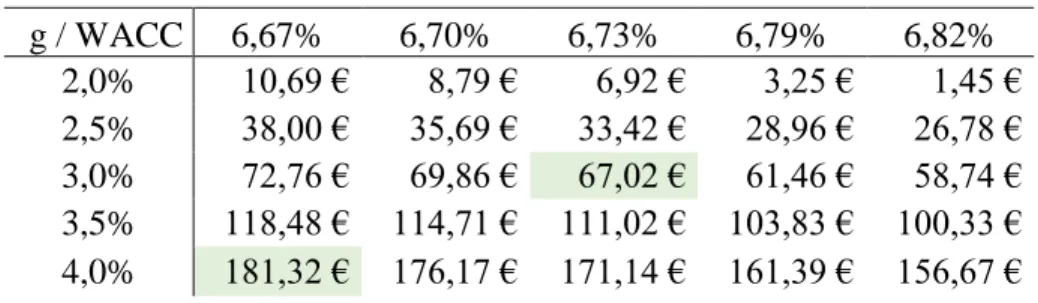
Table 10: Sensitive Analysis - FCFF
g / WACC 6,67% 6,70% 6,73% 6,79% 6,82% 2,0% 10,69 € 8,79 € 6,92 € 3,25 € 1,45 € 2,5% 38,00 € 35,69 € 33,42 € 28,96 € 26,78 € 3,0% 72,76 € 69,86 € 67,02 € 61,46 € 58,74 € 3,5% 118,48 € 114,71 € 111,02 € 103,83 € 100,33 € 4,0% 181,32 € 176,17 € 171,14 € 161,39 € 156,67 €
A change of only 1% in growth rate, for example, has a substantial impact on the price per share because the cash flows of BNP Paribas are quite high.
In table 10, is possible to verify that when growth rate increased and WACC decrease the value rises. The highest price for one unit of BNP Paribas stock could be achieved if g=4% and WACC=6.67%.
38 €67,02
€54,27 €55,36
€66,77 €65,85
FCFF EV / EBITDA EV / Revenues PER Market Price
20/09/2017
Figure 3: Value per share using the different methods
5.5. Comparison of results from valuation methods
Table 11: Fair value using different methods
Methodology Value p/ Share
FCFF € 67,02 EV / EBITDA € 54,27 EV / Revenues € 55,36 PER € 66,77 Market Price 20/09/2017 65,85 €
After performing the valuation using all the presented methodologies, it is possible to take some conclusions.
Discounted cash flow technique allowed to compute an implicit value per share higher than relative valuation. The computations provided a price range between €54.27 and €67.02. The values differ due to the assumptions made in each computation.
The market value of a unit of BNP Paribas stock is lower than the fair prices estimated and it means that the stock price is undervalued.
DCF DCF DCF DCF DCF DCF DCF DCF Relative Valuation
Table 1: Balance SheetRelative Valuation
Table 2: Balance Sheet
Table 3: Balance SheetRelative Valuation
Table 4: Balance SheetRelative Valuation
Figure 2: Value per share using
the different methodsRelative Valuation
39 VI. Conclusions and Recommendation
Throughout this thesis project, a company valuation was performed. However, valuation is a topic quite subjective. It requires some assumptions and it can be done through several approaches.
The goal of this project was to evaluate BNP Paribas’ stock price. Therefore, there was a need to choose some methods. There is not a perfect process to do valuations. There are several methods that require different assumptions. Some of them are simpler and others more complex, but all of them have limitations.
On this project, the valuation was made taking into account two methodologies: discounted cash flows (free cash flows to the firm) and multiples.
DCF is a method that requires some assumptions and it can be very subjective. On the other hand, multiples use a peer group composed by companies with similar features and, sometimes, the mean or the median of the peer group may not have the most appropriate results.
Regarding the results, independently of the method used, all values are closer to the current market price.
The recommendation is to hold or to buy BNP Paribas shares. According to the results presented above, the DCF proved, that the fair price is higher than the current market price. Regarding multiples, only PER suggested a higher fair value. As the fair price is higher than the market price, it is possible to conclude that the stock is undervalued.
The methodology which provided a higher value was FCFF and it proposed a price 1.78% higher than market price.
40 VII. Appendixes
7.1. Balance Sheet
In millions of euros Year to 31
Dec. 2013 Year to 31 Dec. 2014 Year to 31 Dec. 2015 Year to 31 Dec. 2016 ASSETS
Cash and amounts due from central banks 117.473 134.547 160.400
Financial instruments at fair value through profit or loss
Trading securities 156.546 133.500 123.679
Loans and repurchase agreements 165.776 131.783 152.242
Instruments designated as at fair value through profit or loss 78.827 83.076 87.644
Derivative financial instruments 412.498 336.624 328.162
Derivatives used for hedging purposes 19.766 18.063 18.133
Available-for-sale financial assets 252.292 258.933 267.599
Loans and receivables due from credit institutions 57.545 43.348 43.427 47.411 Loans and receivables due from customers 612.455 657.403 682.497 712.233 Remeasurement adjustment on interest-rate risk hedged portfolios 5.603 4.555 4.664
Held-to-maturity financial assets 8.965 7.757 6.100
Current and deferred tax assets 8.628 7.865 7.966
Accrued income and other assets 110.088 108.018 115.967
Equity-method investments 7.371 6.896 6.910
Investment property 1.614 1.639 1.911
Property, plant and equipment 16.929 18.032 21.593 22.523
Intangible assets 2.537 2.951 3.104 3.239
Goodwill 9.846 10.577 10.316 10.216
TOTAL ASSETS 1.810.522 2.077.758 1.994.193 2.076.999
LIABILITIES
Due to central banks 1.680 2.385 233
Financial instruments at fair value through profit or loss
Trading securities 78.912 82.544 70.326
Borrowings and repurchase agreements 196.733 156.771 183.206 Instruments designated as at fair value through profit or loss 57.632 53.118 54.076
Derivative financial instruments 410.250 325.828 318.740
Derivatives used for hedging purposes 22.993 21.068 19.626
Due to credit institutions 90.352 84.146 75.660
Due to customers 641.549 700.309 765.953
Debt securities 187.074 159.447 153.422
Remeasurement adjustment on interest-rate risk hedged portfolios 4.765 3.946 4.202
Current and deferred tax liabilities 2.920 2.993 3.087
Accrued expenses and other liabilities 87.722 88.629 99.407
Technical reserves of insurance companies 175.214 185.043 193.626
Provisions for contingencies and charges 12.337 11.345 11.801
Subordinated debt 13.936 16.544 18.374
TOTAL LIABILITIES 1719567 1.984.069 1.894.116 1.971.739
BALANCE SHEET AT 31 DECEMBER 2016 Table 12: Balance Sheet
Table 12: Balance Sheet
Table 13: Balance Sheet
41
Working Capital 90.955 93.689 100.077 105.260
Variation of Working Capital 2.734 6.388 5.183
Capex 2.248 3.453 965
CONSOLIDATED EQUITY
Share capital, additional paid-in capital and retained earnings 83.210 82.839 86.794 Net income for the period attributable to shareholders 0.157 6.694 7.702 Total capital, retained earnings and net income for the period attributable to shareholders 83.210 89.533 94.496 Changes in assets and liabilities recognised directly in equity 6.091 6.736 6.169
Shareholders' equity 89.301 96.269 100.665
Retained earnings and net income for the period attributable to minority interests 4.098 3.691 4.460 Changes in assets and liabilities recognised directly in equity 133 117 95
Total minority interests 4.231 3.808 4.555
TOTAL CONSOLIDATED EQUITY 90.955 93.532 100.077 105.220
TOTAL LIABILITIES AND EQUITY 1.810.522 2.077.601 1.994.193 2.076.959
Source: BNP Paribas Annual Report
Table 501: Income StatementSource: BNP Paribas Annual
Report
Table 502: Income Statement
Table 503: Income StatementSource: BNP Paribas Annual
Report
Table 504: Income StatementSource: BNP Paribas Annual
Report
Table 505: Income Statement
Table 506: Income Statement
Table 507: Income Statement
Table 508: Income StatementSource: BNP Paribas Annual
Report
Table 509: Income StatementSource: BNP Paribas Annual
42 7.2. Income Statement
In millions of euros Year to 31
Dec. 2014 Year to 31 Dec. 2015 Year to 31 Dec. 2016 Year to 31 Dec. 2017 Year to 31 Dec. 2018 Year to 31 Dec. 2019 Year to 31 Dec. 2020 Revenues 39.168 42.938 43.411 45.147 46.728 48.129 49.573 -COGS -14.801 -16.061 -16.402 -16.730 -16.897 -17.066 -17.237 - Other Costs -10.157 -11.539 -11.279 -11.505 -11.620 -11.736 -11.853 - Depreciation -1.566 -1.654 -1.697 -1.782 -1.835 -1.890 -1.947 = EBIT 12.644 13.684 14.033 15.131 16.375 17.437 18.536
- Net Operational Cost -9.705 -3.897 -3.262 -3.718,68 -4.164,92 -4.581,41 -4.947,93
Capital Gains 211 592 439 530 573 610 649
= EBT 3.150 10.379 11.210 11.942 12.784 13.466 14.237
- Taxes -2.643 -3.335 -3.095 -3.297 -3.529 -3.718 -3.931
= Net Income 507 7.044 8.115 8.645 9.254 9.748 10.306
INCOME STATEMENT 2014 - 2020
Source: BNP Paribas Annual Report
Table 1073: Cash Flow StatementSource: BNP Paribas Annual
Report
Table 1074: Cash Flow Statement
Table 1075: Cash Flow StatementSource: BNP Paribas Annual
Report
Table 13: Income Statement
Table 19: Income Statement
Table 20: Income Statement
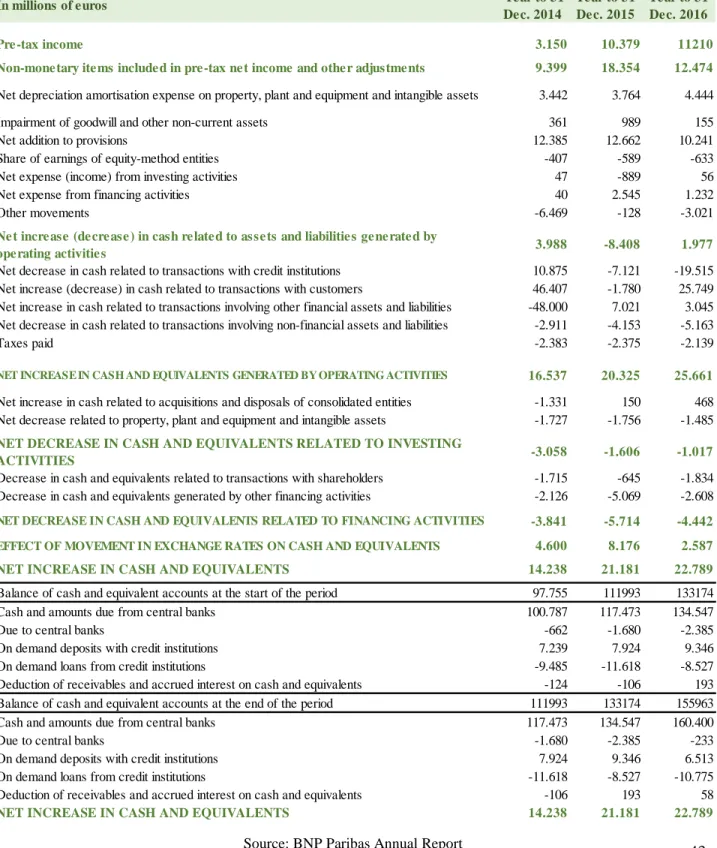
43 7.3. Cash Flow Statement
In millions of euros Year to 31
Dec. 2014 Year to 31 Dec. 2015 Year to 31 Dec. 2016 Pre-tax income 3.150 10.379 11210
Non-monetary items included in pre-tax net income and other adjustments 9.399 18.354 12.474
Net depreciation amortisation expense on property, plant and equipment and intangible assets 3.442 3.764 4.444
Impairment of goodwill and other non-current assets 361 989 155
Net addition to provisions 12.385 12.662 10.241
Share of earnings of equity-method entities -407 -589 -633
Net expense (income) from investing activities 47 -889 56
Net expense from financing activities 40 2.545 1.232
Other movements -6.469 -128 -3.021
Net increase (decrease) in cash related to assets and liabilities generated by
operating activities 3.988 -8.408 1.977
Net decrease in cash related to transactions with credit institutions 10.875 -7.121 -19.515 Net increase (decrease) in cash related to transactions with customers 46.407 -1.780 25.749 Net increase in cash related to transactions involving other financial assets and liabilities -48.000 7.021 3.045 Net decrease in cash related to transactions involving non-financial assets and liabilities -2.911 -4.153 -5.163
Taxes paid -2.383 -2.375 -2.139
NET INCREASE IN CASH AND EQUIVALENTS GENERATED BY OPERATING ACTIVITIES 16.537 20.325 25.661
Net increase in cash related to acquisitions and disposals of consolidated entities -1.331 150 468 Net decrease related to property, plant and equipment and intangible assets -1.727 -1.756 -1.485
NET DECREASE IN CASH AND EQUIVALENTS RELATED TO INVESTING
ACTIVITIES -3.058 -1.606 -1.017
Decrease in cash and equivalents related to transactions with shareholders -1.715 -645 -1.834 Decrease in cash and equivalents generated by other financing activities -2.126 -5.069 -2.608
NET DECREASE IN CASH AND EQUIVALENTS RELATED TO FINANCING ACTIVITIES -3.841 -5.714 -4.442
EFFECT OF MOVEMENT IN EXCHANGE RATES ON CASH AND EQUIVALENTS 4.600 8.176 2.587
NET INCREASE IN CASH AND EQUIVALENTS 14.238 21.181 22.789
Balance of cash and equivalent accounts at the start of the period 97.755 111993 133174
Cash and amounts due from central banks 100.787 117.473 134.547
Due to central banks -662 -1.680 -2.385
On demand deposits with credit institutions 7.239 7.924 9.346
On demand loans from credit institutions -9.485 -11.618 -8.527
Deduction of receivables and accrued interest on cash and equivalents -124 -106 193
Balance of cash and equivalent accounts at the end of the period 111993 133174 155963
Cash and amounts due from central banks 117.473 134.547 160.400
Due to central banks -1.680 -2.385 -233
On demand deposits with credit institutions 7.924 9.346 6.513
On demand loans from credit institutions -11.618 -8.527 -10.775
Deduction of receivables and accrued interest on cash and equivalents -106 193 58
NET INCREASE IN CASH AND EQUIVALENTS 14.238 21.181 22.789
CASH FLOW STATEMENT FOR THE YEAR ENDED 31 DECEMBER 2016
Source: BNP Paribas Annual Report
Source: BNP Paribas Annual Report
Table 14:Cash Flow Statement
Table 26:Cash Flow Statement
Table 27:Cash Flow Statement
44 7.4. P&L Accountancy
In Millions of euros Year to 31
Dec. 2014 Year to 31 Dec. 2015 Year to 31 Dec. 2016 Interest income 38.707 41.381 40.894 Interest expense -18.388 -18.828 -18.518 Commission income 12.661 13.335 12.765 Commission expense -5.273 -5.720 -5.563
Net gain on financial instruments at fair value through profit or loss 4.631 6.054 6.189
Income from other activities 35.760 38.289 36.532
Expense on other activities -30.899 -33.058 -31.099
REVENUES 39.168 42.938 43.411
Salary and employee benefit expense -14.801 -16.061 -16.402
Other operating expenses -10.157 -11.539 -11.279
Depreciation. amortisation and impairment of property. plant and equipment (PPE) and
intangible assets -1.566 -1.654 -1.697
GROSS OPERATING INCOME 12.644 13.684 14.033
Cost of risk -3.705 -3.797 -3.263
Costs related to the comprehensive settlement with US authorities -6.000 -100 1
OPERATING INCOME 2.939 9.787 10.771
Share of earnings of equity-method entities 407 589 633
Net gain on non-current assets 155 996 -12
Goodwill -351 -993 -182
PRE-TAX INCOME 3.150 10.379 11.210
Corporate income tax -2.643 -3.335 -3.095
NET INCOME 507 7.044 8.115
Net income attributable to minority interests -350 -350 -413
NET INCOME ATTRIBUTABLE TO EQUITY HOLDERS 157 6.694 7.702
Basic earnings /(losses) per share -70 5.140 6.000
Diluted earnings (losses) per share -70 5.130 6.000
(1) Restated according to the IFRIC 21 interpretation (see notes 1.a and 2).
PROFIT AND LOSS ACCOUNT FOR THE YEAR ENDED 31 DECEMBER 2016
Net gain on available-for-sale financial assets and other financial assets not measured at fair
value 1.969 1.485 2.211
Source: BNP Paribas Annual Report
Table 1645: P&L AccountSource: BNP Paribas Annual Report
Table 1646: P&L Account
Table 1647: Statement of Net income and Changes in Assets and
LiabilitiesTable 1648: P&L AccountSource: BNP Paribas Annual Report
Table 15: P&L Account
Table 29: Statement of Net income and Changes in Assets and LiabilitiesTable 30: P&L Account
Table 31: Statement of Net income and Changes in Assets and Liabilities
Table 32: Statement of Net income and Changes in Assets and LiabilitiesTable 33: P&L Account