IUL School of Social Sciences
Department of Political Economy
Dynamic Competition in the Portuguese Banking Sector:
An Analysis of Product Innovation through a New Indicator
André Filipe Domingues João
A dissertation submitted in partial fulfilment of the requirements for the degree of
Master in Monetary and Financial Economics
Supervisor:
Prof. Dr. Sandro Mendonça, Assistant Professor
Outubro 2014 D yna mic Com p et itio n in th e Po rt u gu ese B an kin g Se ct o r: An alysis o f P ro d u ct In n o va tion th ro u gh a N ew In d ic at o r A n d ré Fi lip e D omin gu e s João N o me d o Can d id at o - Lombada -
i Acknowledgements
During the last year, several people were on my side and helped me to achieve my academic objectives, at the same time that I was working. To them I need to thank.
First of all, my special thanks and appreciation to my supervisor Professor Sandro Mendonça for suggest me the study of this topic and for all the support and counselling during the preparation of this dissertation.
I would like to thank to my girlfriend the daily motivation and the constant support, as well as to my mother, father and brother who during my life transmitted me the values which made me who I am.
I also would like to thank Emanuel Gonçalves, my partners Francisco Campos and Rodolfo Santos for understanding my absences to work and Bernardo Fonseca, Cláudia Patrício and Raquel Vilão for helping me to accomplish my project within the established deadline.
ii Resumo
Esta dissertação pretende estudar a evolução da banca comercial portuguesa entre 1993 e 2013. Propomo-nos estudar as alterações no setor bancário português da perspetiva da inovação económica. Em particular, usamos as marcas comerciais como novo indicador de inovação de serviços neste setor central do capitalismo financeiro contemporâneo usando o caso nacional como ilustração. Assumimos que será possível, através deste indicador, averiguar a existência de competição dinâmica (no sentido Schumpeteriano) no setor bancário em Portugal, considerando que este indicador poderá ser capaz de mensurar e captar situações de diferenciação vertical (aumento de qualidade), horizontal (diferentes funções) ou ambas (combinação das duas anteriores). A criação de uma base de dados própria com informação de todas as marcas registadas por bancos comerciais (que concedem crédito e recebem depósitos) a atuar em Portugal no período em análise, permitiu-nos encontrar evidências de competição dinâmica no sector e uma preferência pela diferenciação horizontal, bem como, perceber e mapear o fenómeno de internacionalização da banca nacional e entender a resposta do sector tanto a adversidades, de que são exemplo crises financeiras, como a oportunidades, como foi o caso da revolução tecnológica ocorrida em 2000.
Palavras-chave: inovação; serviços financeiros; marcas; competição dinâmica.
iii Abstract
This dissertation aims to study the evolution of Portuguese commercial bank between 1993 and 2013. We study the changes in the banking sector in Portugal from the perspective of innovation economics. In particular, we use trademarks as a new indicator of service innovation in this central industry of the contemporary financial capitalism using Portugal as case study. We assume it will be possible to ascertain if there is dynamic competition (in a Schumpeterian sense) in this sector in Portugal, since the new indicator yields a promise of measuring vertical (higher quality) and horizontal (different functions) differentiation (or a combination of both) in concrete markets in real time. Our database, grouping information about trademarks applied by Portuguese commercial banks (provisioning credit and receiving deposits) from 1993 to 2013, allow us to get evidence of dynamic competition in this sector and a preference by horizontal differentiation in order to achieve larger market share. It was also possible clearly understand and map the level of internationalization of the sector and the strategy practised in this sense as well as the reaction to economic negative events, such as financial crisis, or positive events like technological booms.
Key words: Innovation; financial services; trademarks; dynamic competition. JEL code: O30; G20; L80
v Table of Contents Acknowledgements ... i Resumo ... ii Abstract ... iii Table of Contents ... v
List of Tables ... vii
List of Figures ... viii
List of abbreviations and terms ... ix
1. Introduction ... 1
2. Empirical and theoretical perspectives in a Schumpeterian view ... 5
2.1. Innovation and dynamic competition in a Schumpeterian perspective ... 5
2.2. Types of innovation ... 6
2.3. The evolution of innovation research in services ... 8
2.3.1.Reverse product cycle ... 9
2.3.2.Specificities of innovation in service sectors ... 11
2.3.3.The impact of ICT in service innovation ... 13
2.4. Preliminary conclusions ... 16
3. Metodology ... 17
3.1. Trademarks: An economic perspective ... 17
3.2. Trademarks: The legal perspective ... 17
3.3. Trademark as innovation indicator ... 19
3.4. Trademarks in numbers ... 20
3.5. The creation of a new database ... 22
3.6. Preliminary conclusions ... 23
4. Data and Findings ... 25
4.1. Broad patterns in the Portuguese banking sector between 1993 and 2013 ... 25
4.1.1. Type of trademark registered ... 27
4.2 Trademark creation and destruction ... 27
4.3 Focus on the three banks with more Trademarks registered ... 29
4.4 Trademarks per Bank ... 31
4.5 Banking trademarking and economic indicators ... 32
vi
4.5.2. Gross Domestic Product ... 34
4.6 Trademarks per Nice class ... 35
4.6.1. The structure of banking trademarks ... 36
4.6.2. The dynamics of banking Nice classes ... 37
4.6.3. Active and expired in Nice classes ... 38
4.6.4. Focus on CGD ... 39
4.8 Competitive advantages analysis ... 41
4.9. Creative destruction ... 43
4.10. The process of internationalization ... 45
4.10.1. Patterns and internationalization ... 45
4.10.2. Trademarks and Assets and Debts towards non-residents ... 49
4.11. Dynamic Competition in close inspection ... 50
4.12. Preliminary conclusions ... 52
5. Conclusions ... 55
6. References ... 59
vii List of Tables
Table 2.1: Types of innovation introduced in innovating service sectors ... 13
Table 2.2: Sources of ICT-based versions of banking services ... 14
Table 3.1: Trademarks under analysis ... 23
Table 4.1: RMA 1999-2003 ... 42
Table 4.2: RMA 2009-2013 ... 42
Table 4.3: Analysis of trademarks applications in Nice Classes 9, 16, 35, 36 and 38 per year (1993-2013) ... 44
viii List of Figures
Figure 2.1: Interactive innovation process in services ... 10
Figure 2.2: Sectoral patterns of technological change in service sectors ... 12
Figure 4.1: Number of trademarks registered 1993-2013 (analysis per year) ... 25
Figure 4.2: Type of Trademark registered (1993-2013) ... 27
Figure 4.3: Active and expired Trademarks (1993-2003) ... 29
Figure 4.4: Proportion of active and expired Trademarks 1993-2003 ... 29
Figure 4.5: Three banks with more Trademarks registered (1993-2013) ... 30
Figure 4.6: Trademarks per capita (1993-2013) ... 31
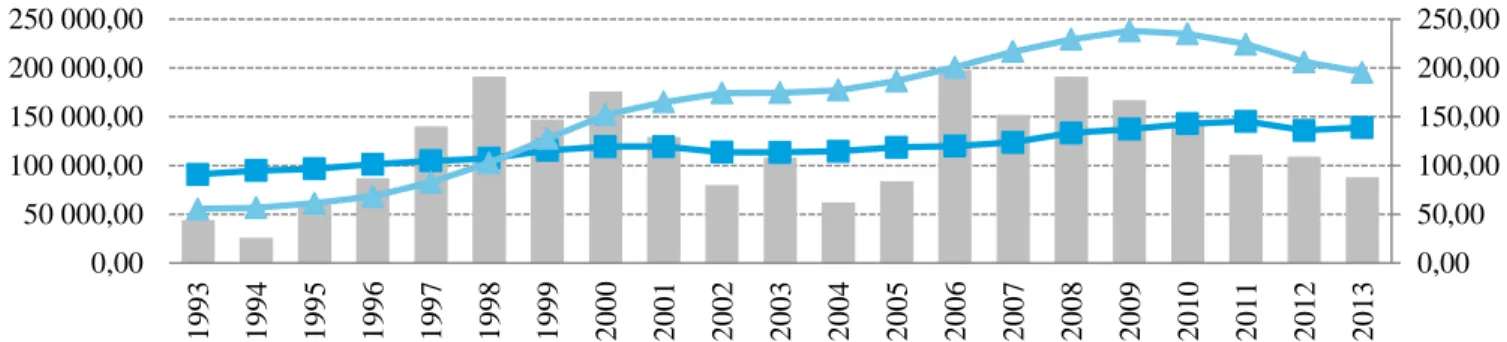
Figure 4.7: Trademarks registered, Deposits and Credit level at constant prices (1993-2013) ... 33
Figure 4.8: Trademarks registered and GDP (1993-2013) ... 35
Figure 4.9: Structure trademarks by Nice classes for the whole period ... 37
Figure 4.10: Evolution of Trademarks by Nice Class (1993-2013) ... 38
Figure 4.11: Analysis of Nice Class 36 (1993-2003) ... 39
Figure 4.12: CGD - Trademarks by Nice Class (1993-2013) ... 40
Figure 4.13: CGD - Nice Classes 9, 16, 35, 36 and 38 (1993-2013) ... 41
Figure 4.14: Trademarks registered in Portugal and outside Portugal (1993-2013) ... 45
Figure 4.16: Trademarks registered in OHIM and WIPO (1993-2013) ... 46
Figure 4.17: Trademarks registered in France and Spain ... 46
Figure 4.15: Division of trademarks registered in an year per territory ... 46
Figure 4.18: Trademarks registered outside Portugal, OIFM's Assets and Debts towards non-residents (1993-2013) ... 49
ix List of abbreviations and terms
BCP – Banco Comercial Português
BERD – Business enterprise expenditure on R&D
BES – Banco Espírito Santo
BPI – Banco Português de Investimento
CTM – Community Trademark
CGD – Caixa Geral de Depósitos GDP – Gross Domestic Product
GERD – Gross domestic expenditure on R&D
ICT – Information and communication technology
INPI – Portuguese Institute of Industrial Property IPC – Industrial Portuguese Property Code
IT – Information Technology
OECD – Organisation for Economic Co-operation and Development OHIM – Organisation for the Harmonization of the Internal Market OMFI – Other Monetary Financial Institutions
R&D – Research and Development S&T – Science and Technology SME – Small and Medium Enterprises TPP – Technological Product and Process
USPTO – United States Patent and Trademark Office WIPO – World Intellectual Property Organization
1. Introduction
Economic globalisation and the Information Revolution propelled innovation to a truly central issue in decisions concerning public policy and business strategy. In the economic literature the concept of innovation appears the first half of the twentieth century, introduced by Schumpeter, and diffuses with his followers of the evolutionary and neo-Schumpeterian schools of thought (Fagerberg, 2004). This dissertation follows this research line.
Innovation studies are, indeed, more than just an academic enterprise. Since the 1960s institutions like Organisation for Economic Co-operation and Development (OECD) have contributed to monitor this key process in developed economies. The work invested into developing quantitative yardsticks of technical change, thus, stretches well in time. All of the proposed indicators have advantages as well limitations. Today these indicators are part of the empirical toolbox of economist and include statistics like Research and Development expenditures (R&D) the patents (Smith, 2004). The addition of trademarks to this portfolio is fairly recent (Schmock, 2003; Mendonça et al., 2004). Trademarks are a form intellectual property that protects the unique commercial identity characteristics of products and firms. Their application reveals entrepreneurial initiative and marketing efforts undertaken by organisations to position themselves before their target-audiences and distinguish themselves from competition. Such decisions concerning products (tangible or intangible products) seek differentiation because of competitive pressure and the need to attract the consumers. The interest in these property rights may be taken as indicating the search for promised benefits, in particular demand inelasticity, customer loyalty and higher profits. Hence, trademarks have been a way of measuring non-technological innovation, showing more advantages than others in the particular field of service innovation (Godinho, 2007). Our agenda is motivated by this methodological potential.
In a global perspective, the number of trademark applications increased significantly after the Second War, with more than three million of applications in 2004 (Millot 2009). A study on this matter (Myers, 2013) shows that in United States of America the number of trademarks applications has been growing over the past 25 years, with the real Gross Domestic Product (GDP) growing 2,8% (average annual growth rate) during this period, while the number of
trademarks applications increasing at an average year rate of 6,5% during the same period. In Europe, in the period from 1996 to 2008, the economy grew 30,5%, while in the same period the number of Community trademarks (CTM) grew 167% (Mendonça and Fontana, 2011). Modern economies are becoming more trademark intensive, a phenomenon that motivates the present research work.
The focus of this dissertation is in the service sector, in particular in the finances services. This is due to the well-known phenomenon of growth of services sector being associated to economic development in modern economies. Services sector nowadays represent around 75% of the value added and employment in advanced economies of OECD (Salter e Tether, 2006). However, the OECD (2007) has highlighted that the importance of innovation in services sector goes well beyond its proportion of GDP. One reason is the fact that this sector presents greatly connects with other sectors of economy (Evagelista, 2000). Another reason is that innovation activities in the services sector may present higher intensity when compared to manufacturing; this is the case, for instance, of Portugal (see the Community Innovation Survey, 2012). Notwithstanding its importance, it remains the case that difficulties in understating and measuring the innovation process in services are difficult since its output is intangible (Gallouj, 2000). This dissertation offers a way to address this research challenge.
The technological and regulatory context shapes the incentive structures of the banking sector (Bos et. al, 2012). On the one hand, information and communication technology (ICT) allows for increased potential in innovation via home-banking or apps for mobile banking. On the other hand, regulation creates pressures for innovation to flow in particular directions. Slumps like the New Economy in the early 2000s or the Subprime crisis in the late 2000s had innovation as a central factor. The interplay between technology and finance was instrumental in the dynamics of this “double bouble” (Pérez, 2009). Understanding the commercial banking sector lived through these turbulent foundational years of the 21st century is a key challenge, both for economic analysis and for sectoral regulation.
There is no established database about trademarks applications for the retail banking sector in Portugal. In our research we make use of official statistics of intellectual property offices to generate a new and original empirical resource for research. The data was compiled from the
Portuguese national institute of industrial property (INPI), the Office for Harmonization of the Internal Market (OHIM), and from the World Intellectual Property Office (WIPO). A new database was built containing 2,493 trademark validated applications for the period between 1993 and 2013. Data collection was limited to the banks that the Bank of Portugal classified as able to receive deposits, i.e. institutions authorised for act in commercial banking. This allows us to study the behaviour and dynamics of financial services sector in Portugal from a unique and fresh perspective.
On the basis of this empirical material we wish to argue that trademarks are a reliable and useful indicator for understanding the structure and the evolution of the competition in financial markets. In particular, we aim at showing that the image that emerges is one of dynamic competition, that is, one in which players jokey for distinct market positionings, struggle to stay ahead of competition, practice a wealth of differentiation strategies, and engage in processes that Joseph Schumpeter termed “creative destruction”.
The dissertation is organized in five chapters. Chapter 2 carves the theoretical framework from the bedrock of innovation studies and evolutionary economics. Chapter 3 describes the methodology deployed in this research, highlighted how the evidence of raised from primary sources and how it may be interpreted. Chapter 4 analysis the trademark data in search of major stylised facts using year of application, products classes, countries of application, and a number of other variables. Finally, Chapter 5 offers some conclusions, stresses the limitations of our study, fleshes out a few policy implications and proposes avenues for future research.
2. Empirical and theoretical perspectives in a Schumpeterian view 2.1. Innovation and dynamic competition in a Schumpeterian perspective
Joseph Alois Schumpeter is well-known for having introduced the concept of innovation in economic theory. He presented “dynamic competition” as a process and the essence of market competition itself. In this historical process, a phenomenon taking place in real-time, innovation is to be understood as the prime strategy that companies employ to attain advantage and remain competitive. Innovation, for Schumpeter (1942, p. 84), “strikes not at the margins of the profits and the outputs of existing firms but at their foundations and very lives”. In the Schumpeterian view, competition mainly occurs through product and quality improvements instead of prices or quantity changes. This process is characterized by the introduction of new products and processes in the market, yielding a temporary monopoly to the innovator which in consequence attracts new costumers. This movement, however, also attracts competitors, which detect the success, choose follow the same path and create a similar business propositions. Advantages achieved by the first-mover are eroded by the swarm of imitators and profits slide down to “normal” levels while the innovation gets diffused widely across a large set of users.
According to Schumpeter, innovation is the basis of economic evolution (Schumpeter, 1942: 81-86; 1947), that is, structural change, while interplay between innovation-diffusion is at the origin of business cycles (see Schumpeter 1912, 1939). Schumpeter defines innovation, not as pure novelty, but as a “new combination” of resources already known. Innovation may be materialized as the introduction of a new or improved good, a new method of production, opening up of a new market not yet explored, a new source of supply of raw materials or the implementation of a new form of organization. In a Schumpeterian light it is important to distinguish the concepts of invention and innovation: invention is the moment in which a new idea arises, but it is only its injection in the market which makes it an all-important economic event (Fagerberg, 2004).
In other words, innovation is about the possible re-writing of the productive system at a variety of levels. When agents are engaged in this activity they are bringing about “creative destruction”, that is, making some practices obsolete while some replacing these with others. Intendedly or
unintendedly, entrepreneurial individuals and organization are transforming the economic system from within and making capitalism a dynamic, evolving process (McGraw 2007, p. 169).
Since the 1950s Schumpeter’s concepts have been studied and developed by number of economists. These have focused on their empirical application (Freeman and Soete, 1997; Fagerberg et al., 2004, Hanusch and Pyka, 2007), but also on its more profound theoretical implications (Nelson and Winter, 1982). His constructs have been adopted and revised, adapted and expanded, as well as tested against evidence on stylised facts (Salter and Alexy, 2013).
Currently it is natural to assume, moreover, that the introduction of innovation in a market generates externalities in the economy. Innovation also gives rise to complementary changes of various which coalesce into broad patters and trends. Many authors have contributed to establish the contours of such patterns of innovation according to a systemic perspective in a sectoral (Marleba, 2002), regional (Cooke et al., 1997) and national scales (Nelson, 1993; Lundvall, 2007). Caraça et al. (2009) argue, for instance, that innovation sources and outcomes depend on broad iterative and interactive dynamics in a variety of micro, meso and macro settings. In the same vein, Laranja (2007) states that such evolutionary dynamics is not only mediated and measurable in market terms.
2.2. Types of innovation
Since business environment matters for innovation and competitiveness Schumpeterian insights have, likewise reached the policy sphere. A good example of this is the OECD, which since the 1960s, influenced Science and Technologic (S&T) policy in the developed countries. The OECD’s approach was inspired by assumptions on the basis of evolutionary theories (Henriques and Larédo, 2013). In the recent S&T policy perspectives by the OECD the influence of Schumpeter is clear enough.
In the latest edition of the Oslo Manual, the OECD distinguishes between key types of innovation. Here the OECD (2005, p. 46) refers to innovation as “the implementation of a new or
significantly improved product (good or service), or process, a new marketing method, or a new organizational method in business practices, workplace organization or external relations”. In
other words, product innovation, process innovation, organisational innovation and marketing innovation:
product innovation refers to the creation of a new good or service as well as to improvements in already existing products, which may be, for example, new components, attributes, etc.;
process innovation is related with the change of procedures adopted to produce the good or provide service such as new manufacturing methods, new equipment allowing to produce the same output at a lower cost or more for the same cost, etc.;
organisational innovation implies new ways of managing a company in order to reduce administrative costs or improve employee satisfaction at work;
marketing innovation is the implementation of new promotion or selling strategies, which can involve improvements at the design or distribution level to better meet consumers’ needs.
It may be noted that the four categories of innovation presented above distinguish technological innovation from non-technological innovation. Technological innovation mostly includes product and process innovation (present in earlier works of the OCDE, such as OECD/Eurostat, 1997), but organisational and marketing innovation allows the analysis to extend to virtually all sectors of an economy.
In a different perspective, it is also important distinguish the type of differentiation between products in order to understand sector’s dynamic. Chamberlin (1933) considers that product differentiation can be horizontal or vertical. In the first perspective, when a product does not differ in terms of quality but rather in terms of some features not easily ordered in an objective way. The distinction between products in terms of quality is not easily evaluated by costumers, as quality has a mere marginal variation. On the other hand vertical differentiation occurs when in a specific market goods or services can be ordered according their objective quality in a scale and customer choose between two products according its quality preferences.
2.3. The evolution of innovation research in services
The growing importance of services sector in the modern economy, representing about three quarters of employment and value added in advanced countries (Salter and Theter, 2006), have led to an increasing focus on innovation in the services sector. Until 1980 this study area was neglected. Although service innovation has become more popular as a research topic its specificities make it “difficult to investigate and evaluate … with the traditional analytical tools” (Gallouj 2002, p. 19). Hence, work in this are as been hard and as involved both theoretical and empirical developments.
According to Salter and Theter (2006), up to the 1980s there was a notorious scarcity of studies in this area. In published studies innovation was highly related both to technology as well as equipment. Attention is drawn to the work of Fuchs (1968), Bell (1973) and Pavitt (1984) as examples. Fuchs (1968) warned of the need to redefine the economy as a result of the growing importance of services in the economy where the consumer plays a more important role than previously assumed. In the same way, Bell (1973) talks about a post-industrial society as the result of a fast growth in the service sector and development of ICT. Pavitt (1984) initially makes an important contribution to research on innovation and technical change, presenting a classification for industrial sectors (supplier dominated; science-based; scale intensive; and specialized suppliers) to which added a more intangibles-based/information-intensive category, based on ICT (to which he assigned the banking sector; see Pavitt, 1990).
Then, and still according to Ammon and Theter (2006), came a new phase, from the mid-1980s and to the late-1990s. This period was characterised by the attempt to study innovation in services adapting conceptual tools already used for observation of innovation in manufacturing and by focusing on the impact of technology on services. A highlight is the work of Barras (1986 and 1990), which interpreted the product life-cycle for the service sector. Authors like Miozzo and Soete (2001) adapted the Pavitt taxonomy to the services sector. Evangelista (2000), leaning over the concrete case of Italian economy, also classified companies of the service sector in four major clusters. Also the works of Gallouj (1998, 2002) constituted important contributions to this subject during the referred period.
After the 1990s starts the period Ammon and Theter (1996) dub to be of demarcation and differentiation. The key notion is that the service sector has markedly different characteristics from manufacturing resulting in the need to create different approaches. Examples of this line of work are Gallouj and Weinstein (1997), Sundbo and Gallouj (1998), Sundbo and Gallouj (2000), Coombs and Miles (2000), Drejer (2004), among others. Gallouj and Weinstein (1997) point out that the difficulty of studying innovation in services has been largely due to the fact that the analysis was based on the procedures of technological innovation in manufacturing. Drejer (2004) argued that the concept to innovation goes beyond technological change and should encompass organizational change.
More recently, Gallouj and Savona (2010) argue that increasing synthesis and integration may be rising. However, and as these authors argue, more work is still due in order to restore the balance of research toward a sector that accounts for three-quarters of total employment.
2.3.1. Reverse product cycle
This view, presented by Barras (1986a), portrayed service innovation as a dynamic and evolving process. The process in the service sector starts out as an incremental innovation process in a first phase, evolves to a radical innovation process in a second stage, and ends with product innovation. In other words, the first stage is characterised by an initial investment designed to provide lower costs in mature well-known services by applying already available technology (an incremental innovation), which can directly be connected to a progression along learning curve. Moving forward in this process, on the second phase the application of new technology in radical innovation processes try to improve effectiveness (not an efficiency-driven process anymore) by affecting the quality of services provided. On the last phase of this process, the main concern is centred on the creation of new products, instead of improving the features of the established methodologies, and achieves differentiation in the market where the product is commercialised. By applying this view to services the evolution of innovation along the reverse product cycle moves from a strictly supply-push dynamics to a more market-pull sensitiveness. Firstly, innovation is more dependent of the technological possibilities created by the upstream
equipment manufacturers. Finally, the process becomes much more demand-dependent since service characteristics have to fit costumers needs.
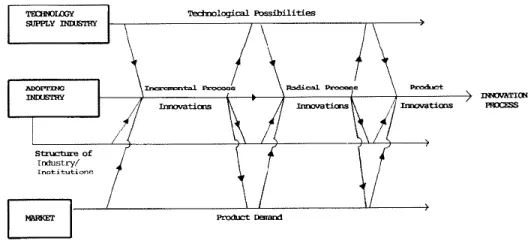
In subsequent work Barras (1990) addressed the topic of innovation in services emphasising more explicitly the supply-demand interplay throughout the reverse product cycle. In this process, new technological possibilities are confronted with market conditions and the institutional context. The cumulative result of this continuous interactive innovation process is at least as sharp as the result of radical product innovation, discontinuous and driven by technology. Moreover, the technological conditions, market and institutional which favour innovation, cannot be considered separately, since these conditions mutually interact. Figure 2.1 illustrates the innovation model interactive services, along the inverted product cycle. Given that technological and market conditions undergo constant change, companies move along possessing imperfect information about these changes. This leads them to take decisions in an unstable and uncertain environment, that is, tentatively judging technological possibilities and evaluating shifting customer needs.
Source: Barras (1990, p. 19)
Barras’ model also takes into account the coexistence of three types of conditions influencing the process of adoption of new technology. In the first level, the technological possibilities that are created by innovations in the sector responsible for the production of capital goods; secondly, the conditions prevailing demand in the markets served by sector adopter; and finally, the organizational and institutional structure of the adopter sector. In other words, this view is one
that stresses the contingency of firm strategy in the shifting environment where different trends co-evolve.
2.3.2. Specificities of innovation in service sectors
Sundbo and Gallouj (1998) made a contribution in which they set apart specific forms of innovation in services. They stress, for instance, that the discovery of new market niches leads firms to alter its behaviour within the environment in which it operates; and the service environment is different. Given that the costumer is an important factor in service business, Gallouj and Weinstein (1997) stress “ad hoc” innovation to be a common stylised fact since customers have idiosyncratic problems many times. In this situation, using the available knowledge and experience accumulated in their activity, firms achieve a solution through an interaction with costumer who has highly participatory roles. Such variability, in turn, raises costs and channels incentives in service innovation to be oriented to formalisation and standardisation. In other words, innovation in services pushes and pulls strategies in directions that may lead to tension and contraction.
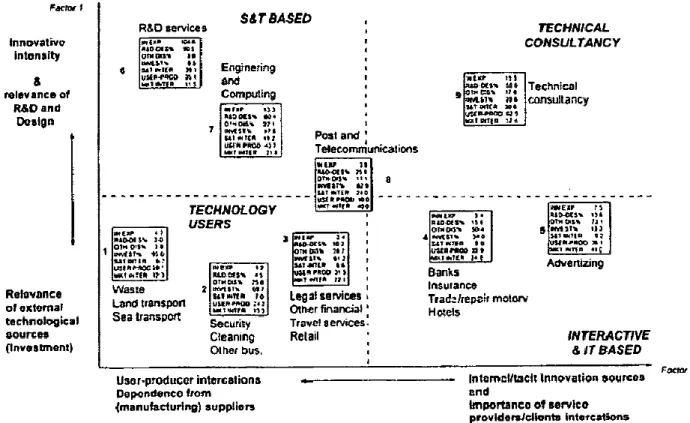
Rinaldo Evangelista (200) considered the innovation phenomenon in services in recognisably neo-Schumpeterian way, that is, he pointed out that innovation is a quite distributed phenomenon in service sectors but also that it differs across sectors (see Fagerberg, 2004). Evangelista (2000) attempted to sort out service sectors into specific clusters of activity. This analysis was seconded by another study, by Miozzo and Soete (2001). Following Pavitt’s taxonomy (1984), see Figure 2.2, Rinaldo Evangelista identified four groups of innovating service firms:
i. technology users, which resembles the group of supplier-dominated firms by being also
considered the least innovative group, especially dependent on upstream industries providing ICT equipment;
ii. science and technology-based, similar to high-tech science-based firms characterised by
Pavitt as being strong in innovation activity since they create technological innovations later adopted by other companies;
iii. interactive and ICT-based sectors, characterized by intensive use of electronic and digital
means of operation, and which are responsible for innovating interactively with customers and users of its products;
iv. technical consultancy, that is, those supplying knowledge-base and technically-intensive
solutions to customer’s highly-specific complex needs.
Figure 2.2: Sectoral patterns of technological change in service sectors
Source: Evangelista (2000, p. 214)
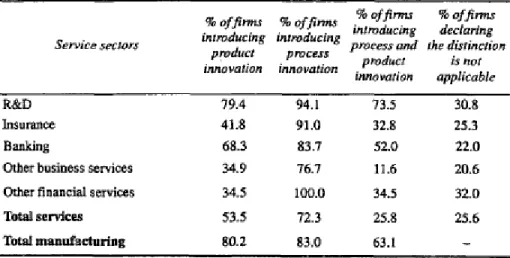
In his survey Evangelista (2000, p. 194) observed that in Banking 61.8% of the firms innovated. This industry came third in his service sector ranking, only after R&D services and insurance. Services, as a whole, were found to rely more on process innovation than manufacturing, which in more balanced between product and service innovation. Notwithstanding, innovating banking firms emerge to have a higher than average intensity in product innovation, when comparing with services in general (Evangelista 2000, p. 196). By far the bulk of innovation spending in banking came in the form of software improvements and in the form of new investment, a trend pushing
banking to the bottom-right quadrant, i.e. a sector display interaction-intensive and ICT-acquiring behaviour.
Table 2.1: Types of innovation introduced in innovating service sectors
Source: Evangelista (2000, p. 196, abridged)
2.3.3. The impact of ICT in service innovation
Bilderbeek et al. (1998) presented an additional interpretation of innovation in services considering that most of the innovations in this sector arise from the introduction of ICT. According to these, service innovation is not just about a change in the characteristics of the services themselves offered, but also a wide range of changes such as interactions with customers, distribution processes, among others. For the authors the intangible and interacting components of service innovation were on the rise even before the heyday of the “New Economy”. In particular, client interfaces were becoming important, whereby consumers can produce criticism and make suggestions made possible by the new technologies making possible the rapid interchange of information.
This perspective is consistent with Tufano’s (2003) view that financial innovation exists to correct inefficiencies or imperfections in the market. Other studies defined financial innovation as arising with the aim of minimizing the agency and transaction costs (Ross, 1989; McConnell and Schwartz, 1992; Grinblatt and Longstaff, 2000) and also for minimising the weight of taxation (tax efficiency) and restrictions imposed by regulators (Miller, 1986; Santangelo and Tuffano,
1986). A great many of these gaps and loopholes are informational in nature. It is then not surprising that these and other authors have recognised that the growth of proficiency of the sector in these technologies during the three last decades is recognized by several authors (Miller, 1986 and 1992; Merton, 1992; Nightingale, 2003; Tufano, 2003; Frame and White, 2004 and 2009; Barata, 2011).
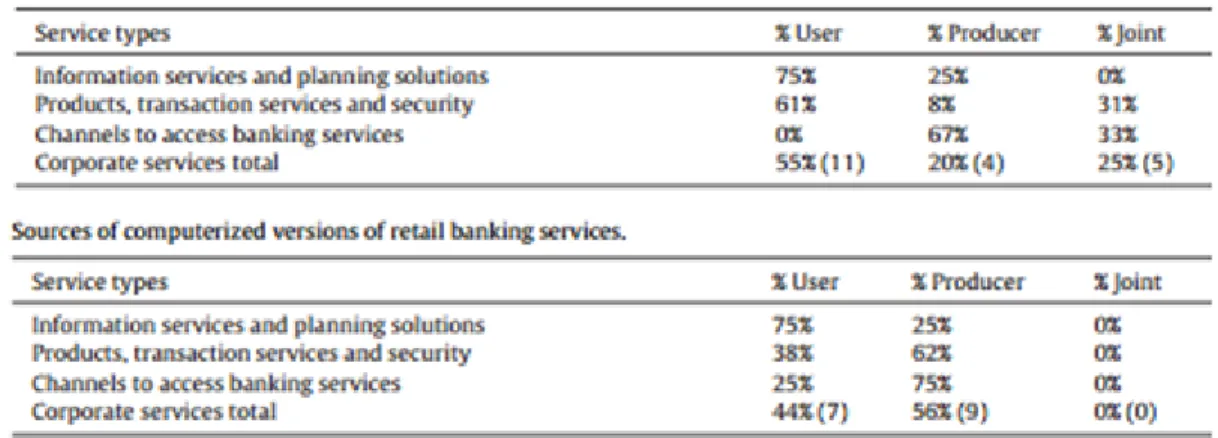
Consoli (2007) has recently contributed to show that progress achieved in terms of information processing technologies has performed an important role in innovation in financial services sector, and the increase of variety in knowledge-base results in a greater interaction between the actors, including conducing to new ways of coordination with users. Likewise, Bátiz-Lazo (2009) has also argued that the adoption of real-time computing and online payment media has been a major driving force behind the overhaul of the sector, namely in the retail finance segment. That new ways of fostering and managing network externalities have mattered has been, indeed, underscored by Oliveira and Hippel (2011), in their first quantitative study about user-innovators in financial services. Users not only are able to access bank records using ATM or electronic banking, they have contributed to shape the service itself. As Oliveira and Hippel (2011) have shown, the proportion of user-led innovation in the finance sector, even in the retail business were costumers tend to be individual consumers has a considerable percentage.
Table 2.2: Sources of ICT-based versions of banking services
Source: Oliveira e von Hippel (2011, pp. 811-2, abridged)
Hence, it is acknowledge that banks are intensive users of ICT and that financial services are today mostly provided using technological, digital-intensive tools. However, empirical studies based in quantitative elements are limited (Beck et. al., 2012). Frame and White (2004, p. 116)
indeed state: “Everybody talks about financial innovation, but (almost) nobody empirically tests hypotheses about it”.
In the last few years studies in the area of innovation in financial services have emerged. On the one hand, for instance, Lerner e Tufano (2011) have claimed that innovation in financial services is different from other sectors because i) financial system is highly interconnected, ii) innovation in finance is very dynamic, iii) regulation of financial sector is more complex than in the other sectors. On the other, Bos et al. (2012) have found evidence that the relation between competition and innovation in the North-American banking sector could be graphically portrayed as an inverted U-curve where innovation is measured in y-axis and competition in x-axis. Considering that banks are at the left-side of the optimal point (maximum innovation level) authors proved that deregulation has a negative impact in innovation. This is justified by the negative effect of deregulation in competition, which consequently moves banks to the left through the mentioned inverted U-curve, meaning a lower level of innovation in the future. Heffernan et al. (2014), concluded that largest companies from the banking sector are more inclined to innovate, although with lower returns, banks with high quality human resources or higher expenses in R&D are more innovative and that companies protecting their innovations obtain betters results.
More to the point, most of this literature seems to be favourable to innovation in finance it is no longer the case that this assumption is unproblematic. The financial crisis which commenced abruptly with the collapse of Lehman Brothers has led to new a debate about the negative aspects of financial innovation (Henderson and Pearson, 2008; Allen, 2011; Beck et. al., 2012). Ben Bernanke, as the head of the FED, noted in his speech dated from 17th April 2009:
“In sum, the challenge faced by regulators is to strike the right balance: to strive for the highest standards of consumer protection without eliminating the beneficial effects of responsible innovation on consumer choice and access to credit. Our goal should be a financial system in which innovation leads to higher levels of economic welfare for people and communities at all income levels”.1
1
In this sense, sometimes financial innovation creates complex products, barely understood by consumers, which is one of the dark sides of the innovation in this sector. However, as Allen (2011) highlights, in the long term the liberalisation of the sector probably had a worse effect than financial innovation. To take an alternative view we can follow Beck et. al. (2012) who see financial innovation as encouraging banks to assume higher risks, granting more credit and diversifying the risk it is taking, which can be positive since it promotes economic development. It has, however, increased volatility in the banking sector, which can be expressed by significant losses in a financial crisis context.
2.4. Preliminary conclusions
Schumpeter established innovation as the core of process “dynamic competition” and “creative destruction” that characterises modern capitalism. His concepts have been completed, revised and extended over the years by evolutionary and neo-Schumpeterian authors as well as global economic institutions like the OECD. During much of time, nevertheless, studies have neglected the phenomenon of innovation in services sector. Recent years have witnesses many efforts to remedy this situation. A number of views relating to innovation patterns have been suggested, and this work constitutes a yardstick to currently study service innovation.
Research about innovation in financial services increased even before the global financial crisis. Change in the financial business has specific characteristics. It may be more complex than in other sectors. Studies of these issues based in quantitative database are yet limited in number and scope. There is, however, evidence that shows that innovation in finance is frequent but highly specific and increasingly ICT-intensive. Even in market segments that retail banking product innovation is common and the role of costumers in influencing the service. There seems overall to persist a lack of fresh research, and aspects such as the impact of social welfare still not well understood. For the purposes of this Dissertation such problems in the literature may be understood as an opportunity for a new approach.
3. Metodology
3.1. Trademarks: An economic perspective
According to the OECD “a trademark is a sign (a word, a logo, a phrase, etc.) that enables people to distinguish the goods or services of one party from those of another” (Millot 2009, p. 17). Although with less detail, this definition is in line with the one presented by intellectual property offices; for these institutions these entities are first and foremost intangible assets that are warranted protection in the marketplace. For the applied economist, however, these symbols may be taken as evidence of differentiation, innovation and industrial change.
Several authors consider trademarks as one of the most important asset in a company, being an essential factor for the company financial success (e.g. Elliot e Lercy, 2006), since it is through them that consumers identify suppliers and distinguish products from a sea of competing stimulate (Schmalensee, 1978; McClure, 1996; Rao, 2005; Aaker, 2007; Fosfuri et al., 2008; Davis, 2009). A specific trademark allows for higher prices, capitalises on reputation, enables costumers’ loyalty, and consequently yields higher margins (Shaked and Sutton, 1982). In the same line, Keller (2008) affirms that a trademark’s final purpose is the market power that differentiation permits to be achieved. A classic example of this is Coca-Cola and the value of this trademark in the market as well as the clients’ loyalty
Flikkema et al. (2014) identify six different motives that are in the origin of a trademark register: (i) the aim of differentiation and demarcation that inhibit imitation and the drive toward lower prices (Economides, 1998; Ramello, 2006; Ramello and Silva, 2006); (ii) companies’ strategic intent such as the entrance in new markets or business lines (Mendonça et al., 2004; Giarratana and Torrisi, 2010); (iii) industrial protection granted with a trademark registration (Greenhalgh and Rogers, 2010); (iv) customer’s loyalty (Keller and Lehmann, 2006; Krasnikov et al., 2009); (v) competitively advantages via new resources’ combination (Hamel and Prahalad, 1993; Hall, 2006); and (vi) organizational motives (DiMaggio and Powell, 1983; Abrahamson, 1996).
3.2. Trademarks: The legal perspective
A Trademark is an industrial property title. In Portugal the rules to applications, prices, validity, etc., of trademarks are defined in the Decree-Law n. º 36/2003, 5th March, which transposed an
EU directives2. The Portuguese Industrial Property Code (IPC) was last time changed in 20113. The IPR Code is applied not only to trademarks but also to other forms of industrial property. In Portugal the public agency in charge of this area is the national industrial property office (or INPI).
In the article o 222.º of IPC, trademark is defined as “a signal or signals susceptible graphic representation, namely words, including names, draws, letters, numbers, sounds, products form or package, since they are adequate in order to distinguish the products and services from a company to another”. Trademark can be also an advertising sentence for goods and services, since they have a distinctive character, independently of the protection recognized by copyright protection. In the origin of the application of a trademark, there is no need of creation of a new product (good or service) but only the existence of a new signal able to distinguish it from the others.
A trademark guarantees an industrial property right to its owner, allowing him to use it with exclusivity (article 224.º IPC) in the territory where it is registered (national, community, or a group of countries individually chosen), during a period of 10 years which can be indefinitely renewed for periods with the same duration (art. 255.º IPC). The trademark is identified by the symbol ® or ™ (article 323.º) which conveys a warning or threat of punishment for counterfeiting or imitation. As any other industrial property right, also a trademark register can be denied, based on the causes disclosed in articles 238.º e 239.º of the IPC (for instance the fact of the trademark tentative applied does not constitute any distinctive element or if it may be mistaken with that of other firm).
In what regards territoriality of a trademark, it could correspond to a country or to several countries. A national trademark, registered on INPI, only gives to the owner the exclusive right to use it in Portugal (the same trademark can be used for instance in Spain). However, a trademark can be registered in other countries’ offices individually. In order to facilitate and accelerate the trademark application process in other countries, the denominated CTM4 arises (article 248.º IPC), registered in the Office for OHIM, which with a single register gives to a company the
2
Directive n.º 98/44/CE, 6th July, on protection of biotechnology inventions and Directive n.º 98/71/CE, 13th October, on legal protection of industrial designs.
3
Law n.º 46/2011, 24th June
4
industrial property right in all European Union territory (27 countries). A trademark can also be registered in the WIPO, which allows a company to register a trademark in all countries that assigned the Paris Convention for the Protection of Industrial Property (1883). In all the options mentioned, the application process is easy and quick, once it can be executed directly in the website of each Intellectual Property Office referred5.
The classification system adopted by WIPO, in what respects to goods and services, for trademarks register purposes, is the Nice Classification, resulted of Nice Agreement (1957). The Nice Classification of goods and services resulted from the international agreement signed in 15th June, 19576, at Nice Diplomatic Conference and was adopted by the countries that constitute the Paris Union for the Protection of Industrial Property, that use this classification not only in the national register of trademarks but also in community and international trademarks, registered in OHIM and WIPO respectively. This classification aggregates the goods and services in 45 classes: from 1 to 34 the classification regards goods, while classes 35 to 45 respects to services. In the moment of a trademark application, the applicant needs to choose the correspondent Nice Class in which the good or service that will use the trademark must be included.
3.3. Trademark as innovation indicator
Section 2 of this dissertation defined the innovation concept and its evolution in theoretical terms. Another concern of the neo-Schumpeterian school has been the discovery of indicators able to measure the innovation degree in a specific industry. Since 1960s the OECD showed its concern on this matter by establishing indicators to quantify economic change. For example, the Frascatti Manual provided the methodology for computing the “Gross domestic expenditure on R&D” (GERD) and the “Business enterprise expenditure on R&D” (BERD). After these early efforts new measurements came by such as scientific production (number of publications) and technological invention (number of patents).
A recent development has been the possibility to use trademarks as innovation indicator. The first criticism to point out to this indicator is the fact that a trademark application, contrary to patents, does not require a product innovation. However, that does not have to be the case but may well be
5
www.marcasepatentes.pt; https://oami.europa.eu/ ; www.wipo.int/
6
the case (Velling, 2002). In fact, trademarks often play a crucial role in the commercialization of new products (Trott 2005). For costumers is easier identify product innovation when it happens associated to a new trademark. For this reason, it is becoming apparent that also marketing innovations and strategies go hand in hand with trademarks (Kuratko, 2009).
Trademarks as tool for innovation measurement and mapping displays strong comparative advantages, vis-à-vis other indicators, in the case of the services sector (Schmoch, 2003, 2009). It is difficult to capture innovation in services, since they their immaterial element is not well covered in other innovation indicators (Kleinknecht, 2000). Trademarks applications also present the advantage of allow the capture of innovation in small companies (Mendonça et al. 2004; Mangani, 2006; Fikkema et al., 2007, 2012). Given the easiness and low cost of a trademark registration they are cheaper than patents there is also a higher volume of empirical information. They are, however, a less informative in their details than patents (these contain a precise description of a technological idea, trademarks do not unambiguously point to new business models).
In addition to Schmock (2003) and Mendonça et al. (2004), considered in the literature as important pioneers of this approach, today exists a lot of new work to support the idea that trademarks are an useful element to join to metrics list that supply relevant information about innovative activity (e.g. Schautschick and Greenhalg, 2013). Several studies have verified by employing different databases of national and international scope the existence of a positive correlation between trademarks register and innovative activities (Millot, 2009), being this correlation particularly significant in the services sector, namely in the industries more intensive knowledge and information (Mendonça, 2012; Mendonça and Fontana, 2013; Flikkema et al., 2014).
3.4. Trademarks in numbers
According to Valentine Millot (2009), the first register of a trademark application goes back to the middle of the 19th Century, with nine offices open for application purposes in 1884 growing to 116 in 2006. In a worldwide perspective, it is interesting note the exponential growing of
trademark applications, increasing significantly after the Second World War, with more than three million applications in 2004 (Millot 2009).
A study on this matter (Myers, 2013) shows that in United States of America the number of trademarks applications is growing robustly. With GDP growing 2,8% annually for the last 25 years he number of trademarks applications increasing at an average yearly rate of 6,5%. In the United States Patent and Trademark Office (USPTO) the number of applications in 2010 nearly reached 300.000. In a European perspective, the economy grew 30,5% between 1996 and 2008 while in the same period the number of community trademarks (CTMs) grew 167%. When comparing the reality of trademarks with patents, is visible than in 2009 there is a general preference for trademarks, with 155.000 (approximately) CTM filings while the number of patents applications did not exceed 61.000 in the same year (Mendonça and Fontana, 2011). Trademark data are also correlated with the business cycle (see Mendonça et al., 2004).
In terms of intrinsic value, it is interesting to analyse the information (collected in November 2013) provided by Forbes7 in the article “The World’s Most Valuable Brands” with Apple and Microsoft being the most valuable trademarks in the world (104.3 and 56.7 billion US Dollar respectively), followed by Coca-Cola, IBM and Google in the TOP 5. It is important to note that in the TOP 5, four of the most valuable trademarks in the world belong to technology companies. In this list, the first trademark from a company acting in Financial Services sector is American Express, appearing on the 26th position.
And brands reflect corporate collapses too. From one day to another the value of a trademark can go from a large amount to zero. It happened in 2014 in Portugal with BES, a trademark evaluated in the beginning of this year in 640 Million Euro8 reduced to zero due to the recent financial scandal and restructuration .
7
http://www.forbes.com/powerful-brands/list/
8
Article written by João Vieira Pereira: http://expresso.sapo.pt/fim-da-marca-bes-custa-640-milhoes=f884923 accessed on 15th
3.5. The creation of a new database
In order to get evidence about dynamic competition, i.e. non-price and innovation-oriented competition, in the Portuguese banking sector we have create a new database by collecting all trademarks registered in Portugal by Portuguese banks between 1993 and 2013. For purposes of this dissertation, we will only taking into account trademarks registration effectively completed, disregarding trademark applications cancelled or abandoned by applicant or refused by the national industrial property office for not fulfil with all the necessary requirements. We considered this as the most prudent scenario to not bias our analysis with tentative applications not concluded.
Our scope is limited to the banks classified by Bank of Portugal, which are financial institutions able to receive deposits. That is, we used the list of the Portuguese financial regulator as a yardstick to compile the populations of economic agents active in the Portuguese retail banking market. We then obtained information of all trademarks applied using TMView’s website9, where all the information is compiled (information about the name of trademark, applicant name, Nice Class, type of trademark, country of exclusivity, among other information). This source contains applications and registrations of trademarks for individual but also information of international trademarks (that is, in the EU via OHIM and worldwide through WIPO). In total information was collected from 35 different Offices (listed in Appendix A).10 Our research was done searching by the applicant name and also by the name of trademark (Annex B displays the list of key words used in our research).
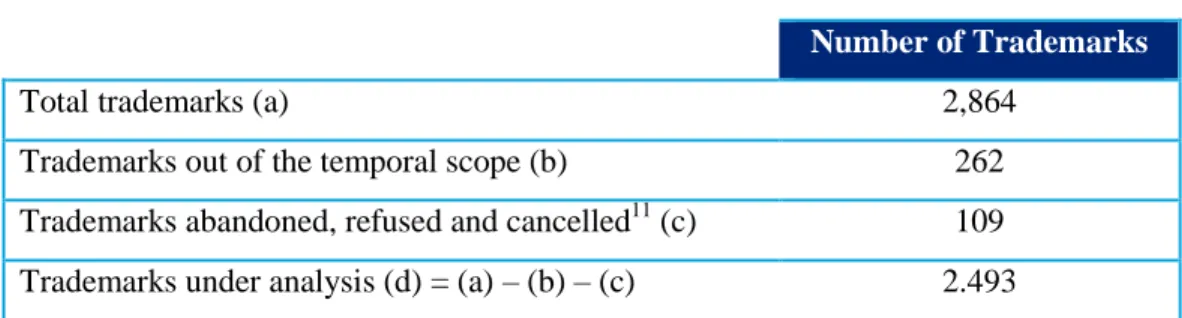
Considering a temporal limitation between 1993 and 2013, 2,864 trademarks registered by Portuguese banks were obtained, divided in the following:
9
https://www.tmdn.org/tmview/welcome.html
10 It is important to mention that our territorial scope analysis is larger than countries listed in Annex A, considering
that when a trademark is registered in OHIM is considered a CTM offering protection throughout all EU Member States with one single registration. Similarly, a trademark registered in WIPO is considered registered in all the States party of Paris Convention for the Protection of Industrial Property, which includes EU and third countries.
Table 3.1: Trademarks under analysis
Number of Trademarks
Total trademarks (a) 2,864
Trademarks out of the temporal scope (b) 262 Trademarks abandoned, refused and cancelled11 (c) 109 Trademarks under analysis (d) = (a) – (b) – (c) 2.493 Source: This thesis
The information collected contain the application number, country of application, application date, type of trademark (Combined/Word), applicant name, address and postal code and Nice Classes registered in each application.
3.6. Preliminary conclusions
In the recent decades, the need emerged of creating quantitative indicators capable to measure innovation in developed economies to all activity sectors, in order to complement the theoretical studies already existents on this matter. However, considering the existence of non-technological changes considered complex and multidimensional, as well as the existence of external strategic and organizational factors, there has being difficult to find a reliable indicator of innovation in services.
Trademarks applications has growing quickly, showing a better performance than some important economies (when comparing growth rates). Trademarks are applied for in both and service areas, and allows the study of competition and innovation in sectors than were understudies before.. Indeed, considering the relevance of the information provided by trademarks (namely the specific product lines they applied for), associated with the availability of data collection, trademarks become an important indicator to study innovation in services sector, including the financial one.
11
Application with the status: application refused, application abandoned, application withdraw, discontinuance of the proceeding, registration cancellation pending, registration cancelled, registration refused, registration revoked/refused, registration surrendered
In our dissertation, we wish to exploit the potential of a newly built database to explore the rate and direction of change in the Portuguese retail banking sector, an industry where innovation and hardship have recently taken place.
4. Data and Findings
4.1. Broad patterns in the Portuguese banking sector between 1993 and 2013
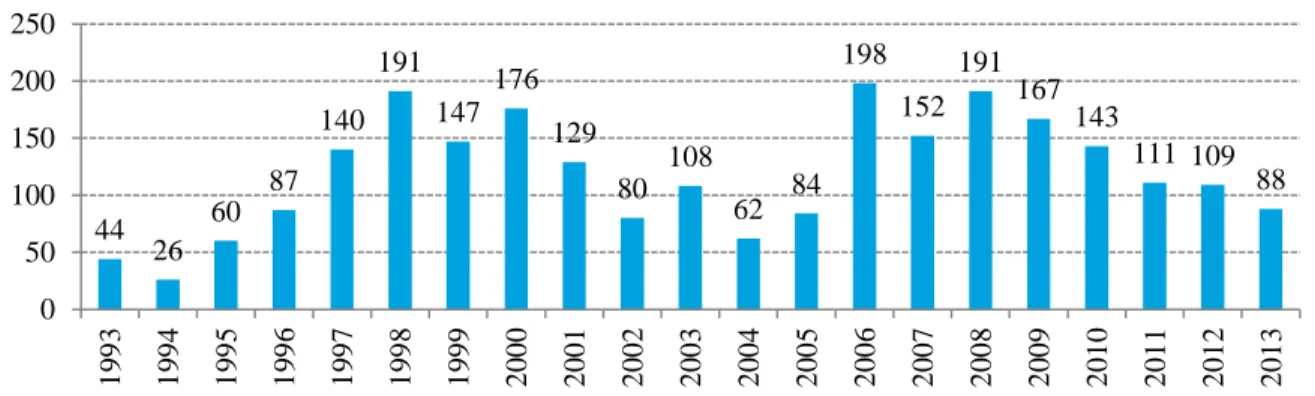
After collecting and grouping all the quantitative information obtained, our first analysis is centred on the evolution on trademarks registration and the way it is related with the evolution of the Portuguese banking sector. As the Figure 4.1 makes clear the number of Portuguese banking trademarks per year is not constant, showing fluctuations during the period under analysis. The year registering a lower number of applications was 1994 (24 applications) and the highest number was 2006 (198 applications). Between 1994 and 1998 the number of trademarks shows a strong growth (approximately 635%) followed by a decrease between 1998 and 2004 (-68%). The second cycle identified is characterized by a period of growth on the number of trademarks registered between 2004 and 2006 (219%) and a decrease period between 2008 and 2013 (-54%). That is to say, the two humps seem to denote the “New Economy” hype and the “Sub-prime crises”, although not direct causation is easily ascribable.
Source: This thesis, from now on all the figures and tables are original material
To put this data into perspective it is important to analyse the dynamics of the banking sector in Portugal during the same period. Firstly, it is important to mention the privatization of the Portuguese banking sector that occurred in 1989, followed, in the beginning of 1990’s, by this deregulation associated with the liberalisation of the international financial markets area (Blommestein, 1995). The increase in the number of banks and the larger operational freedom led to higher competition. 44 26 60 87 140 191 147 176 129 80 108 62 84 198 152 191 167 143 111 109 88 0 50 100 150 200 250 1 9 9 3 1 9 9 4 1 9 9 5 1 9 9 6 1 9 9 7 1 9 9 8 1 9 9 9 2 0 0 0 2 0 0 1 2 0 0 2 2 0 0 3 2 0 0 4 2 0 0 5 2 0 0 6 2 0 0 7 2 0 0 8 2 0 0 9 2 0 1 0 2 0 1 1 2 0 1 2 2 0 1 3
By the mid-1990s banks were vying for stronger market position and at eliminating new competitors, promoting a strong tendency towards concentration in the sector (Serra, 2012). At the end of the decade we observed a technological boom, especially with regards to the use of computing and the internet as working tools able to streamline processes and increase efficiency levels (Musara and Fatoki, 2010). This was also a sub-period characterized by the growth of credit to non-financial corporations and private individuals (Lagoa et al, 2004). Also the Portuguese integration in the Economic and Monetary Union and the consequent adoption of the EURO as the single currency, allowed the integration of financial markets. At this time, we observed a sharp growth of credit, a common phenomenon throughout the euro area. The currency risk disappeared; liquidity increased and banks started issuing very low spreads. Housing loans also grew strongly, due to, among other factors, the increasing competition between banks as a result of liberalization (Serra, 2012). These factors combined may account for the increasing number of trademarks between 1994 and 2000.
Although the concentration process has started in the mid-90’s, the effects of such operations on the levels of concentration are more evident from 2000 onwards, a period marked by a consolidation of banking groups, with the restructuration of groups by merging the different trademarks within a group in a single trademark. The analysis of the evolution of concentration in the Portuguese banking system suggests an increased concentration of all variables, indicating the dominance of the banking groups (Carvalho, 2010). This is likely to have impacted upon the number of trademarks, since the level of competition decreases and the effort of the banks to achieve market share is consequently lower.
Recently, the fall of Lehman Brothers (in September 2008) led to a financial crisis that morphed into a sovereign debt crisis in the peripheral countries in 2011. This cluster of events had a strong impact on the banking sector. Before 2008 the greatest weakness of the Portuguese banking system was the dependence on external financing. The crisis was mostly absorbed by Portuguese banks in two ways: (i) the emergency liquidity concessions of the ECB and the intervention of the “Troika”, and (ii) a shift towards savings capture (Serra, 2012).
4.1.1. Type of trademark registered
The analysis comprised in this sub-section pretends to give us information regarding the type of trademarks predominantly registered by the sector, i.e., do the registered trademarks contain only text, image(s) or a combination of both?
It is noticed in the chart disclosed below that 54% of the registered trademarks by sector are text only, being given importance to the message that is passed, e.g. "Conta rendimento CR 3,25%” (“Account CR 3.25%"), which has the main objective to provide the most important and attractive information to the client. Moreover, 7% of the trademarks that are images are mostly logos registered by the banks. See Figure 4.2.
4.2 Trademark creation and destruction
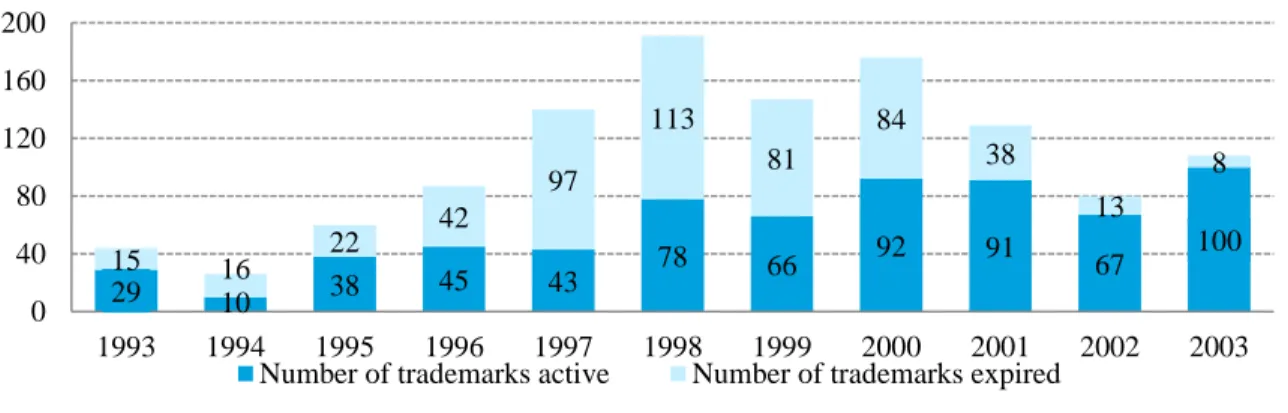
Another perspective is the decomposition of the data presented in Figure 4.1 regarding active and expired trademarks. Based on our database, we considered as expired trademarks all applications indicating the information “Expired”, “Registration Expired” and “registration Lapsed” and the remaining as active trademarks. The expectation is to map the level of “creative destruction” within banking sector. According to the legislation in force regarding industrial property matters12, trademarks are active during 10 years, counted from the date of grant and can be renewed indefinitely for identical periods. After this period, the applicant must analyse and
12
Directive 2008/95/CE, transposed to Portuguese legislation in the Decree-Law n.º 143/2008.
Word 1341 54% Figurative 172 7% Combined 961 39% Word Figurative Combined
decide whether the trademark registered in the past is still important in its present activity or if it has no more utility within the current context.
Considering the already mentioned 10 years’ term, this analysis must be limited, as a trademark registered, for instance, in 2006 will expire in 2016. As such, it is reasonable that the focus of our analysis comprises the period ranging between 1993 and 2003. The percentage of expired trademarks is not constant. In fact, it is possible to identify that, in 1994, 1997, 1998 and 1999, the number of trademarks expired was greater than the number of trademarks active (Figure 4.4). This may point to product substitution: 10 years after the initial register, Portuguese banks opted for non-renewing these trademarks and to create new ones, meaning that these trademarks are no longer deemed as appropriate on its expiration term. On the other hand, it is also important to highlight the evolution of strategy shown in Figure 4.3, as from 1997 to 2003, the percentage of expired trademarks registered in a year, decreased from 69% to 7%. The early 2000s seem to start a new wave of trademarks.
Notwithstanding, it is important to notice that a large percentage of this destruction is not a radical process but rather an incremental one, meaning that it is evident a phenomenon of horizontal differentiation in place of vertical differentiation. Some of trademarks applications are related with deposits and credits. Focusing for example in deposit trademarks, BES applied a trademark named “Conta rendimento 3,25%” which expired. After that, in 2009, a new trademark was applied with the name “De tudo o que se diz sobre mim, apenas 4,25% é garantido”. Looking to both trademarks, we know that it was not a new product created but a change in one of the conditions (interest rate).
Figure 4.3: Active and expired Trademarks (1993-2003)
Figure 4.4: Proportion of active and expired Trademarks 1993-2003
4.3 Focus on the three banks with more Trademarks registered
The analysis performed on the previous section can be seen with more detail in each bank. In order not to be too exhaustive, we will not detail the evolution of trademarks registered in every banking institution considered in this dissertation. In this sense, we have calculated the concentration level of trademarks registered in the banking sector, named Ck, with the necessary adaptations (not considering for this purpose the total turnover of the sector and the turnover of each bank), obtained through the following formula:
(1) 29 10 38 45 43 78 66 92 91 67 100 15 16 22 42 97 113 81 84 38 13 8 0 40 80 120 160 200 1993 1994 1995 1996 1997 1998 1999 2000 2001 2002 2003 Number of trademarks active Number of trademarks expired
66% 38% 63% 52% 31% 41% 45% 52% 71% 84% 93% 34% 62% 37% 48% 69% 59% 55% 48% 29% 16% 7% 0% 20% 40% 60% 80% 100% 1993 1994 1995 1996 1997 1998 1999 2000 2001 2002 2003 Percentage of Trademarks active in an year Percentage of Trademarks expired in an year
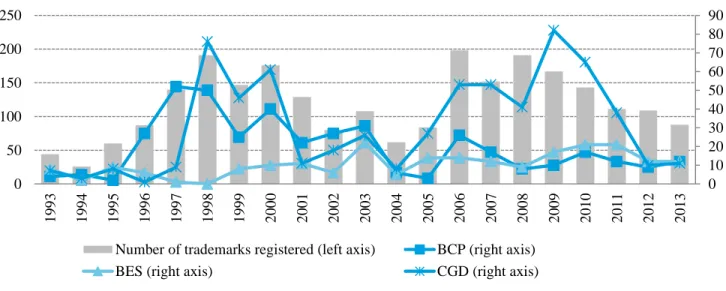
For this purpose, we considered “xi” as the number of trademarks registered by bank I, and “x” the total number of trademarks registered by the sector. The results obtained are explained in Appendix C. Nonetheless, it is important to note that Caixa Geral de Depósitos (“CGD”), Banco Comercial Português (“BCP”) and BES are the three banks with more trademarks registered (C3) representing 51.3% of the total of trademarks registered between 1993 and 2013.
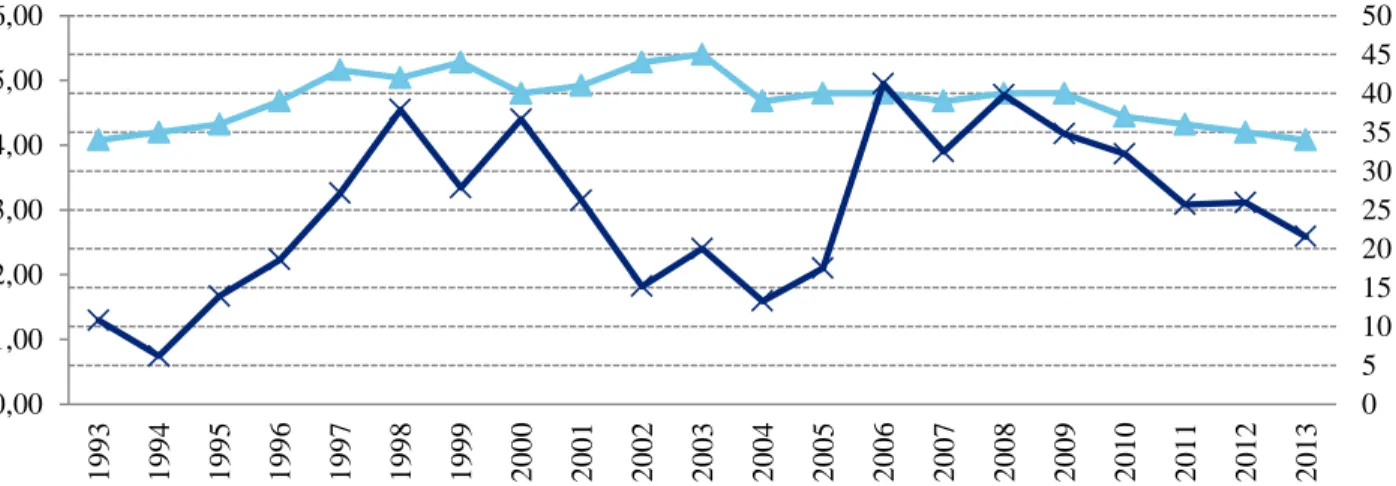
Figure 4.5: Three banks with more Trademarks registered (1993-2013)
As it can be seen by the comparison of trademarks registered by the banking sector and by CGD, BCP and BES (Figure 4.5), it is visible that the two first banks referred, present a similar evolution in the period under analysis, while BES presents a more discreet evolution but still in line with the other two banks.
On the other hand, on a yearly analysis, it is clear that the increasing level of registrations between 1997 and 1998 (51) is justified by the raise of trademarks registered by CGD (67), compensating the decrease in another banks. Additionally, between 2007 and 2008, the increase of trademarks registered (from 152 to 191 per year) occurs when the number of trademarks registered by the three banks focused on this section decreased, meaning that this movement is justified by the activity of the remaining banks, which are outside the scope of this specific analysis. 0 10 20 30 40 50 60 70 80 90 0 50 100 150 200 250 1 9 9 3 1 9 9 4 1 9 9 5 1 9 9 6 1 9 9 7 1 9 9 8 1 9 9 9 2 0 0 0 2 0 0 1 2 0 0 2 2 0 0 3 2 0 0 4 2 0 0 5 2 0 0 6 2 0 0 7 2 0 0 8 2 0 0 9 2 0 1 0 2 0 1 1 2 0 1 2 2 0 1 3
Number of trademarks registered (left axis) BCP (right axis) BES (right axis) CGD (right axis)