_______________________
Received for publication October 1, 2015
Socioeconomic, Personal and Behavioral Correlates
of Active Commuting among Adolescents
Adilson Marques
University of Lisbon, Interdisciplinary Centre for the Study of Human Performance, Faculty of Human Kinetics, Lisbon, Portugal
Miguel Peralta
University of Lisbon, Faculty of Human Kinetics, Lisbon, Portugal
Hugo Sarmento
Centre for the Study of Education, Technologies and Health, CI&DETS, School of Education – Polytechnic of Viseu, Viseu, Portugal University Institute of Maia, Research Center in Sports Sciences, Health Sciences and Human Development, CIDESD, ISMAI, Portugal
João Martins
University of Lisbon, Pedagogy Laboratory, Faculty of Human Kinetics and Investigation and Development in Education and Formation Unity, Institute of Education, Lisbon, Portugal
Lusófona University of Humanities and Technologies, Faculty of Physical Education and Sport, Lisbon, Portugal
Francisco Carreiro da Costa
University of Lisbon, Interdisciplinary Centre for the Study of Human Performance, Faculty of Human Kinetics, Lisbon, Portugal Lusófona University of Humanities and Technologies, Faculty of Physical Education and Sport, Lisbon, Portugal
A B S T R A C T
The aims of this study were to assess the relationships between commuting to and from school (active vs. passive) and their ex-planatory variables. A total of 2653 adolescents (1361 boys, 1292 girls; M age=13.4±2.6) participated in this study. The students were questioned about commuting to and from school, physical activity and school sports participation and perceptions of compe-tence and health. Socioeconomic status and body mass index were calculated. Results show that a minority of the students use acti-ve transportation to and from school. Also, age increasing, participation in school sports and increasing duration were positiacti-vely correlated with active commuting for both routes (to and from school). Given that active commuting may be a simple and effective way to increase physical activity level among youth populations, it is important to promote, improve conditions and create strategi-es in order to increase the number of students that actively commute to and from school.
Key words: Active commuting, passive commuting, students, correlates.
Introduction
Regular physical activity (PA) in adolescence is associated with several health benefits (Janssen & LeBlanc, 2010). In spite of benefits related to PA, research shows that adolescents are not acti-ve enough to benefit their health (Baptista et al., 2012). This high prevalence of physical inactivity is a cause of concern. Walking and cycling to and from school are opportunities to improve child-ren’s and adolescents’ PA levels, as has been previously observed (Tudor-Locke, Ainsworth, & Popkin, 2001). Thus, promoting acti-ve commuting to school not only reduces an inactiacti-ve behavior (pa-ssive commuting), but replaces it with a moderate intensity activity (Alexander et al., 2005). Children who walk to school have higher energy expenditure (Tudor-Locke, Ainsworth, Adair, & Popkin, 2003), engage more in PA (Cooper, Page, Foster, & Qahwaji, 2003), and are more likely to meet PA guidelines (Tudor-Locke, Neff, Ainsworth, Addy, & Popkin, 2002) than children who travel to school by a passive way of transportation.
Influences on the choice to walk or cycle to school are com-plex and include a range of personal, social and environmental factors (Salmon, Salmon, Crawford, Hume, & Timperio, 2007; Timperio et al., 2006). These factors can be systematized as non-modifiable and non-modifiable. The non-non-modifiable factors, such as gender, age and socioeconomic status (SES), help in identifying groups using active transportation. On the other hand, modifiable
factors can be used to guide design intervention programs such as perceptions of competence (Van der Horst, Paw, Twisk, & Van Mechelen, 2007), perception of health (Ledent, Cloes, & Piéron, 1997) and of weight status, and PA participation.
Despite the number of studies about the correlates of active commuting, there is little information about Portuguese adole-scents. To the best of our knowledge, we found only one study on this and it was only focused on girls (Mota et al., 2007). Therefore, the aim of this study was to analyze the correlates of active and passive commuting to and from school.
Methods
Participants
Atkinson, 2011) and the protocol received approval from both the Ethics Committee of the Faculty of Human Kinetics of the University of Lisbon and the Portuguese Minister of Education.
Commuting to and from school
Students reported how they usually travelled to and from school on most days. Four possible responses were provided (walk, bike, car, bus/tram/train). Afterwards, the answers were dichotomized into active traveller (walk or bike), non-active traveller (car, bus/tram/train). The trip duration were classified on 6-points scale from “less than 5 minutes” to “more than 30 minutes” and cut into 5-minute interval.
Physical activity and school sport participation
A questionnaire developed by Piéron et al. (1997) was used to determine students participation in organized PA (OPA), par-ticipation in non-organized PA (NOPA), and parpar-ticipation in school sports (SS). Studies using this questionnaire with Portu-guese students were published previously (Marques & Carreiro da Costa, 2013), as well as were the validation procedures (Mo-ta, Almeida, Santos, Ribeiro, & Santos, 2009)
Body mass index
The measurement of height was made using a stadiometer (re-corded to the nearest 0.5 cm). For the measurement of weight sub-jects were wearing shorts and a t-shirt, without shoes (recorded to the nearest 0.5 kg). Body mass index (BMI) was then calculated di-vided by height (square meters). Adolescents BMI classification was determined based on International Obesity Taskforce criteria (Cole, Bellizzi, Flegal, & Dietz, 2000), with overweight defined as an adult BMI equivalent ≥ 25 according age and sex.
Socioeconomic status
SES was calculated based on parental occupation and edu-cational level. Parents’ occupation titles were regrouped in order to classify the subjects as lower, middle, and higher class. The lower class included skilled and unskilled manual workers, farmers, and fishermen; the middle class included service
occu-pations such as nonprofessional health service workers, office clerks, and sales people; the higher class consisted of business-owners, executives, university-educated specialists and profe-ssionals (Raudsepp & Viira, 2000).
Perceptions
Lintunen’s scale was used to measure students’ perceived physical competence (Lintunen, 1990). The 6-items, using a 5-point Likert scale, displayed a good internal consistency (= 0.9). Perception of health was assessed with a selection on a 4-point scale ranging from ‘‘I am not feeling well’’ (= 1) to ‘‘I am very healthy’’ (= 4).
Data analysis
Descriptive statistics were calculated (means, standard de-viation and percentages) for all variables. Chi-square and Stu-dent t-test were used to assess differences between active and passive commuting to and from school. The effects of each independent variable on the transportation were assessed by a binary logistic regression. Adjusted odds ratio (OR) with 95% confidence intervals (CI) was calculated. Adjustments were performed for all studied variables. An OR greater than 1 re-flects an increased likelihood of active transportation. All stati-stical analyses were performed using IBM SPSS Statistics 22.0. The level of significance was set at 0.05.
Results
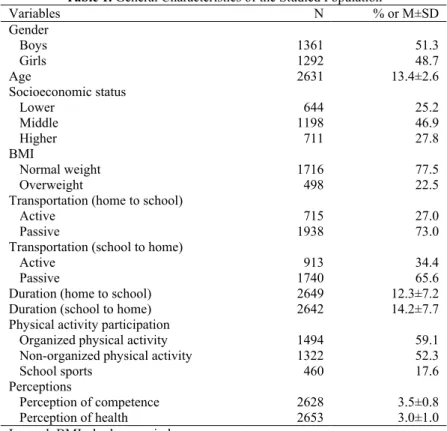
The general sample’s characteristics are presented in Table 1. Overall, 27% and 34.4% of the sample use an active mode of travel to commute to and from school respectively. The mean duration of these trips were 12.3±7.2 minutes from home to school and 14.2±7.7 minutes from school to home. More than half of the respondents were from a middle/high social class (74.7%) and 22.5% were overweight. Table 1 also shows the data regarding perceptions (competence and health) and PA participation in different contexts.
Table 1. General Characteristics of the Studied Population
Variables N % or M±SD
Gender Boys Girls
1361 1292
51.3 48.7
Age 2631 13.4±2.6
Socioeconomic status Lower
Middle Higher
644 1198 711
25.2 46.9 27.8 BMI
Normal weight Overweight
1716 498
77.5 22.5 Transportation (home to school)
Active Passive
715 1938
27.0 73.0 Transportation (school to home)
Active Passive
913 1740
34.4 65.6
Duration (home to school) 2649 12.3±7.2
Duration (school to home) 2642 14.2±7.7
Physical activity participation Organized physical activity Non-organized physical activity School sports
1494 1322 460
59.1 52.3 17.6 Perceptions
Perception of competence Perception of health
2628 2653
Table 2. The Characteristic of Subjects That Use an Active or Passive Commuting from/to School Transportation (home to school) Transportation (school to home)
Explanatory variables
Active n (%)
Passive
n (%) p
Active n (%)
Passive
n (%) p
Gender Boys Girls 344 (48.1) 371 (51.9) 1017 (52.5) 921 (47.5) 0.046 444 (48.6) 469 (51.4) 917 (52.7) 823 (47.3) 0.046
Age 13.4±2.4 13.3±2.6 0.008 13.5±2.4 13.3±2.7 <0.001
Socioeconomic status Lower Middle Higher 185 (27.2) 317 (46.6) 178 (26.2) 459 (24.5) 881 (47) 533 (28.5) 0.302 211 (24.0) 417 (47.4) 252 (28.6) 433 (25.9) 781 (46.7) 459 (27.4) 0.552 BMI Normal weight Overweight 449 (76.5) 138 (23.5) 1267 (77.9) 360 (22.1) 0.492 585 (77.2) 173 (22.8) 1131 (77.7) 325 (22.3) 0.788
Duration 11.1±6.1 12.8±7.5 <0.001 13.1±6.9 14.8±8.1 <0.001
Organized PA No Yes 278 (40.6) 406 (59.4) 758 (41.1) 1088 (58.9) 0.849 353 (40.8) 513 (59.2) 683 (41) 981 (59) 0.891 Non-organized PA No Yes 342 (50.0) 342 (50) 866 (46.9) 980 (53.1)
0.167 408 (47.1)
458 (52.9) 800 (48.1) 864 (51.9) 0.645 School sports No Yes 555 (78.8) 149 (21.2) 1592 (83.7) 311 (16.3) 0.004 717 (79.9) 180 (20.1) 1430 (83.6) 280 (16.4) 0.019 Perceptions
Perception of competence Perception of health
3.5±0.8 3.1±1.0 3.5±0.7 3.0±1.0 0.032 0.557 3.5±0.8 3.1±0.9 3.5±0.7 3.0±1.0 0.199 0.823 Legend: BMI - body mass index; PA - physical activity
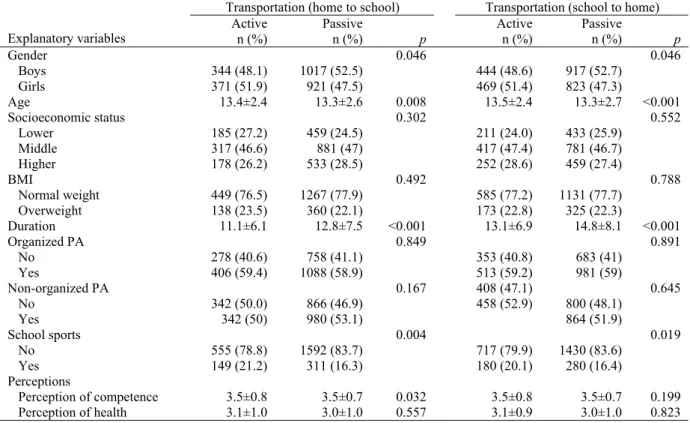
Table 2 shows the relationship between socio-demographic and psychosocial characteristic and commuting to and from school. For the gender, significantly more girls (51.9%) than boys (48.1%) commuted to school actively (p=0.046). The sa-me was also observed from the route school to hosa-me (51.4% vs. 48.6%, p=0.046). The prevalence of active transportation to and from school increases slightly but significantly with age
(p=0.008, p<0.001). The SS participation was also related with commuting to and from school, as the active transportation group had higher percentages of adolescents that participated in SS than the passive transportation group, to school (21.2% vs. 16.3%, p=0.004) and from school (20.1% vs. 16.4%, p=0.019). SES and participating in organized and non-organized PA were not related with active transportation to and from school.
Table 3. Adjusted Odds Ratio for Active Commuting from/to School
Home to school School to home
Explanatory variables Adjusted OR (95% CI) Adjusted OR (95% CI)
Gender Girls Boys 1.00 (ref.) 0.844 (0681-1.046) 1.00 (ref.) 0.82 (0.67-1.01) †
Age 1.06 (1.02-1.11)** 1.08 (1.04-1.12)***
Socioeconomic status Lower Middle Higher 1.00 (ref.) 0.88 (0.68-1.13) 0.72 (0.55-0.96)* 1.00 (ref.) 1.09 (0.86-1.38) 1.02 (0.78-1.32)
BMI 0.89 (0.69-1.15) 0.89 (0.70-1.13)
Duration 0.96 (0.94-0.97)*** 0.96 (0.95-0.98)***
Organized PA participation No Yes 1.00 (ref.) 1.05 (0.84-1.31) 1.00 (ref.) 1.00 (0.81-1.23) Non-organized PA participation
No Yes 1.00 (ref.) 0.93 (0.76-1.14) 1.00 (ref.) 1.08 (0.89-1.31) School sports participation
Yes No
1.00 (ref.) 0.77 (0.58-1.03) †
1.00 (ref.) 0.76 (0.58-0.99)*
Perception of competence 1.19 (1.02-1.39)* 1.10 (0.95-1.28)
Perception of health 0.97 (0.86-1.08) 0.99 (0.89-1.10)
Table 3 presents the results of the regression analysis for the correlates of active commuting. Age (OR=1.06, CI: 1.02-1.11, p<0.01; OR=1.08 CI: 1.04-1.12, p<0.001), participation in SS (OR=0.77 CI: 0.58-1.03, p<0.1; OR=0.76 CI: 0.58-0.99, p<0.05) and duration (OR=0.96, CI: 0.94-0.97, p<0.001; OR=0.96, CI: 0.95-0.98, p<0.001) were found as correlates of active commuting for both routes (to and from school). In fact, being older and participating in SS increases the probability of engaging in active commuting, while longer travel durations decreases the probability of engaging in active commuting, to and from school. Concerning the route from home to school, having higher SES represents less probability for active co-mmuting than having lower SES (OR=0.72, CI: 0.55-0.96, p<0.05) and having a better perception of competence presents a higher probability of engaging in active commuting (OR=1.19, CI: 1.02-1.39, p<0.05). For the school to home rou-te, being a girl presents higher probability of engaging in active commuting (OR=0.82, CI: 0.67-1.01, p<0.1).
Discussion
The present study examined the correlates of active co-mmuting in a sample of Portuguese adolescents. The results show that a minority of the students use active transportation to and from school. However, as in previous study (Leslie, Kre-mer, Toumbourou, & Williams, 2010), more students engaged in active commuting for the route from school to home than for the route from home to school. To understand this result we ha-ve to consider typical day of school and work. Whereas both have the same opening time (8 o’clock), they differ in the clo-sing time (16 o’clock for school day and 18 o’clock for most work days). It is possible that parents find easier to leave their children in school than to take them home after school, due to work and school schedule.
Students from high SES significantly presented less proba-bility to engage in active commuting. This might be related with money availability, increasing the likelihood of owning a car per family (Prentice & Jebb, 1995). Access to motorized ve-hicles was associated with passive commuting for university students (Molina-Garcia, Castillo, & Sallis, 2010) and among United Kingdom adults (Adams, 2010), what could affect child-ren if they were taken to school by their pachild-rents or family mem-bers. Also, higher parental education was associated with redu-ced odds of walking to school (Evenson, Huston, McMillen, Bors, & Ward, 2003). As a result, the difference between higher and lower SES students, who actively commute to and from school, could be explained by the possibility for children among higher SES to be driven to school (passive commuting) by their parents or family members in the morning, and come back home by walking or cycling (active commuting), because their parents are still at work.
The present study found that girls were significantly more active than boys in their way of travel. However, this outcome was in contrast to the findings of Timperio (2006), Robertson-Wilson et al. (2008) and Larsen et al. (2009). The precocity of girls could explain their higher representation among active tra-vellers.
Concerning the age, the adolescents using an active way of travel were significantly older than those using a passive way of travel, as being older were significantly associated with engage-ment in active commuting. These results are understandable and corroborative with the increasing autonomy that comes
with age increasing, which characterizes this period of life. Fur-thermore, this explanation can be strengthened by the results on the perception of competence, where students with higher per-ception of competence had higher odds to engage in active co-mmuting. It is possible that perception of competence increases with age, and together with increasing autonomy this could lead to engagement in active commuting. The findings of physical perception of competence as a significant correlate of active transportation are in concordance with an Australian study of active transport to and from university (Shannon et al., 2006).
Most studies used as variable the distance between home and school (Panter, Jones, van Sluijs, & Griffin, 2010; Timpe-rio et al., 2006). However, in this study the variable of interest was the travel duration. This variable was significantly correla-ted with active commuting. Indeed, students were more likely to actively travel to and from school if the travel duration was shorter. These results confirmed those of previous studies using the variable distance (Larsen et al., 2009; Robertson-Wilson et al., 2008).
A positive association between active commuting and parti-cipation in SS were found. Previous studies found a relationship between PA participation and engaging in active commuting (Larouche, Saunders, Faulkner, Colley, & Tremblay, 2014; Ro-bertson-Wilson et al., 2008), which could be accordingly to the-se study findings, as SS is a form of organized PA.
Walking to school was associated with higher school-day steps in older children. The proportion of children who met re-commended step thresholds was higher in those who actively commute compared with those who passively commute (Abbott, Macdonald, Nambiar, & Davies, 2009). Given that active commuting may be a simple and effective way to incre-ase PA level among youth populations, it is important to pro-mote, improve conditions and create strategies in order to incre-ase the number of students that actively commute to and from school.
Some study limitations should be mentioned. Causal rela-tionships cannot be inferred from this cross sectional data. Ano-ther limitation of the study is the reliance on self-report measu-res. However, we note that the main strength of this study is the large sample that achieves significant results. To the best of our knowledge it is the biggest study on this subject among Portu-guese adolescents.
For future studies, in order to promote active travel to school, it is important to consider school and district policies as well as attitudes of school and district administrators. This is another area of research that would better understand school policies promoting active travelling. Combined with the results of this study, we could redirect campaigns to target people by adjusting the proposals.
Disclosure of conflicts of interest
The authors declare that there are no conflicts of interest. Moreover, authors have no relevant financial or nonfinancial relationships to disclose.
Acknowledgements
R E F E R E N C E S
Abbott, R. A., Macdonald, D., Nambiar, S., & Davies, P. S. W. (2009). The Association Between Walking to School, Daily Step Counts and Meeting Step Targets in 5-to 17-Year-Old Australian Children. Pediatric Exercise Science, 21(4), 520-532.
Adams, J. (2010). Prevalence and socio-demographic correlates of "active transport" in the UK: Analysis of the UK time use survey 2005. Preventive Medicine, 50(4), 199-203. doi: DOI 10.1016/j.ypmed.2010.01.006
Alexander, L. M., Inchley, J., Todd, J., Currie, D., Cooper, A. R., & Currie, C. (2005). The broader impact of walking to school among adolescents: seven day accelerometry based study. British Medical Journal, 331(7524), 1061-1062. doi: DOI 10.1136/bmj.38567.382731.AE
Baptista, F., Santos, D. A., Silva, A. M., Mota, J., Santos, R., Vale, S., . . . Sardinha, L. B. (2012). Prevalence of the Portu-guese population attaining sufficient physical activity. [Rese-arch Support, Non-U.S. Gov't]. Medicine and Science in Sports and Exercise, 44(3), 466-473. doi: 10.1249/MSS. 0b013e318230e441
Cole, T. J., Bellizzi, M. C., Flegal, K. M., & Dietz, W. H. (2000). Establishing a standard definition for child overwe-ight and obesity worldwide: international survey. British Me-dical Journal, 320(7244), 1240-1243. doi: DOI 10.1136/ bmj.320.7244.1240
Cooper, A. R., Page, A. S., Foster, L. J., & Qahwaji, D. (2003). Commuting to school - Are children who walk more physica-lly active? American Journal of Preventive Medicine, 25(4), 273-276. doi: Doi 10.1016/S0749-3797(03)00205-8
Evenson, K. R., Huston, S. L., McMillen, B. J., Bors, P., & Ward, D. S. (2003). Statewide prevalence and correlates of walking and bicycling to school. Archives of Pediatrics and Adolescent Medicine, 157(9), 887-892. doi: DOI 10.1001/archpedi.157.9.887
Harriss, D. J., & Atkinson, G. (2011). Update - Ethical Stan-dards in Sport and Exercise Science Research. International Journal of Sports Medicine, 32(11), 819-821. doi: DOI 10.1055/s-0031-1287829
Janssen, I., & LeBlanc, A. G. (2010). Systematic review of the health benefits of physical activity and fitness in school-aged children and youth. International Journal of Behavioral Nu-trition and Physical Activity, 7.
Larouche, R., Saunders, T. J., Faulkner, G. E. J., Colley, R., & Tremblay, M. (2014). Associations Between Active School Transport and Physical Activity, Body Composition, and Car-diovascular Fitness: A Systematic Review of 68 Studies. Journal of Physical Activity & Health, 11(1), 206-227. doi: DOI 10.1123/jpah.2011-0345
Larsen, K., Gilliland, J., Hess, P., Tucker, P., Irwin, J., & He, M. Z. (2009). The Influence of the Physical Environment and Sociodemographic Characteristics on Children's Mode of Travel to and From School. American Journal of Public He-alth, 99(3), 520-526. doi: Doi 10.2105/Ajph.2008.135319 Ledent, M., Cloes, M., & Piéron, M. (1997). Les jeunes, leur
activité physique et leurs perceptions de la santé, de la forme, des capacités athlétique et de l’apparence. Sports, 159/160, 90-95.
Leslie, E., Kremer, P., Toumbourou, J. W., & Williams, J. W. (2010). Gender differences in personal, social and environ-mental influences on active travel to and from school for Au-stralian adolescents. Journal of Science and Medicine in Sport, 13(6), 597-601. doi: DOI 10.1016/j.jsams.2010.04.004
Lintunen, T. (1990). Perceived physical competence scale for children. In Ostrow A (Ed.), Directory of psychological tests in the sport and exercise sciences (pp. 140). Morgantown, WV: Fitness Information Technology.
Marques, A., & Carreiro da Costa, F. (2013). Levels of physical activity of urban adolescents according to age and gender. In-ternational Journal of Sports Science, 3(1), 23-27. doi: 10.5923/j.sports.20130301.05
Molina-Garcia, J., Castillo, I., & Sallis, J. F. (2010). Psychoso-cial and environmental correlates of active commuting for university students. Preventive Medicine, 51(2), 136-138. doi: DOI 10.1016/j.ypmed.2010.05.009
Mota, J., Almeida, M., Santos, R., Ribeiro, J. C., & Santos, M. P. (2009). Association of Perceived Environmental Characte-ristics and Participation in Organized and Non-Organized Physical Activities of Adolescents. Pediatric Exercise Sci-ence, 21(2), 233-239.
Mota, J., Gomes, H., Almeida, M., Ribeiro, J. C., Carvalho, J., & Santos, M. P. (2007). Active versus passive transportation to school - differences in screen time, socio-economic positi-on and perceived envirpositi-onmental characteristics in adolescent girls. Annals of Human Biology, 34(3), 273-282. doi: Doi 10.1080/03014460701308615
Panter, J. R., Jones, A. P., van Sluijs, E. M. F., & Griffin, S. J. (2010). Attitudes, social support and environmental percepti-ons as predictors of active commuting behaviour in school children. Journal of Epidemiology and Community Health, 64(1), 41-48. doi: DOI 10.1136/jech.2009.086918
Piéron, M., Telama, R., Naul, R., & Almond, L. (1997). Étude du style de vie d’adolescents européens. Considérations théo-riques, objetifs et méthodologie de recherche. Sports, 159/160, 43-50.
Prentice, A. M., & Jebb, S. A. (1995). Obesity in Britain - Glu-ttony or Sloth. British Medical Journal, 311(7002), 437-439. Raudsepp, L., & Viira, R. (2000). Sociocultural correlates of
physical activity in adolescents. Pediatric Exercise Science, 12(1), 51-60.
Robertson-Wilson, J. E., Leatherdale, S. T., & Wong, S. L. (2008). Social-ecological correlates of active commuting to school among high school students. Journal of Adolescent Health, 42(5), 486-495. doi: DOI 10.1016/j.jadohealth.2007. 10.006
Salmon, J., Salmon, L., Crawford, D. A., Hume, C., & Timpe-rio, A. (2007). Associations among individual, social, and en-vironmental barriers and children's walking or cycling to school. American Journal of Health Promotion, 22(2), 107-113.
Shannon, T., Giles-Corti, B., Pikora, T., Bulsara, M., Shilton, T., & Bull, F. (2006). Active commuting in a university setting: Assessing commuting habits and potential for modal change. Transport Policy, 13(3), 240-253. doi: DOI 10.1016/j.tranpol.2005.11.002
Timperio, A., Ball, K., Salmon, J., Roberts, R., Giles-Corti, B., Simmons, D., . . . Crawford, D. (2006). Personal, family, so-cial, and environmental correlates of active commuting to school. American Journal of Preventive Medicine, 30(1), 45-51. doi: DOI 10.1016/j.amepre.2005.08.047
Tudor-Locke, C., Ainsworth, B. E., & Popkin, B. M. (2001). Active commuting to school - An overlooked source of child-rens' physical activity? Sports Medicine, 31(5), 309-313. doi: Doi 10.2165/00007256-200131050-00001
Tudor-Locke, C., Neff, L. J., Ainsworth, B. E., Addy, C. L., & Popkin, B. M. (2002). Omission of active commuting to school and the prevalence of children's health-related physi-cal activity levels: the Russian Longitudinal Monitoring
Stu-dy. Child Care Health and Development, 28(6), 507-512. doi: DOI 10.1046/j.1365-2214.2002.00295.x
Van der Horst, K., Paw, M. J. C. A., Twisk, J. W. R., & Van Mechelen, W. (2007). A brief review on correlates of physi-cal activity and sedentariness in youth. Medicine and Science in Sports and Exercise, 39(8), 1241-1250. doi: DOI 10.1249/ mss.0b013e318059bf35.
M. Peralta