ABSTRACT:Soybean nitrogen (N) demands can be supplied to a large extent via biological nitrogen fixation, but the mechanisms of source/sink regulating photosynthesis/nitrogen fixation in high yielding cultivars and current crop management arrangements need to be investigated. We investigated the modulation of symbiotic nitrogen fixation in soybean [Glycine max (L.) Mer-rill] at different plant densities.A field trial was performed in southern Brazil with six treatments, including non-inoculated controls without and with N-fertilizer, both at a density of 320,000 plants ha−1, and plants inoculated with Bradyrhizobium elkanii at four densities, ranging from 40,000 to 320,000 plants ha−1. Differences in nodulation, biomass production, N accumulation and parti-tion were observed at stage R5, but not at stage V4, indicating that quantitative and qualitative factors (such as sunlight infrared/red ratio) assume increasing importance during the later stag-es of plant growth. Decreasstag-es in density in the inoculated treatments stimulated photosynthstag-esis and nitrogen fixation per plant. Similar yields were obtained at the different plant densities, with decreases only at the very low density level of 40,000 plants ha−1, which was also the only treat-ment to show differences in seed protein and oil contents. Results confirm a fine tuning of the mechanisms of source/sink, photosynthesis/nitrogen fixation under lower plant densities. Higher photosynthesis and nitrogen fixation rates are capable of sustaining increased plant growth. Keywords: Glycine max, biological nitrogen fixation, photosynthesis, source/sink manipulation, plant density
Received August 26, 2013 Accepted January 06, 2014
1National Institute of Agricultural Technology (INTA), Rivera Indarte 72 2° 216 – 5000 – Córdoba – Argentina.
2Embrapa Soybean, C.P. 231 – 86001-970 – Londrina, PR – Brazil.
3State University of Londrina − Dept. Microbiology, C.P. 60001 − 86051-990 – Londrina, PR – Brazil.
*Corresponding author <[email protected]>
Edited by: Lincoln Zotarelli
Plant densities and modulation of symbiotic nitrogen fixation in soybean
Marcos Javier de Luca1,2,3, Mariangela Hungría2,3*
Introduction
Soybean [Glycine max (L.) Merrill] is an important global agribusiness commodity. In Brazil, this legume is produced in an area covering 25 million hectares, in-cluding remote areas.It persists as one of the most prof-itable crops, mainly because its nitrogen (N) require-ments are met by symbiotic nitrogen fixation (Hungria et al., 2005, 2006a, 2006b). In the soybean- Bradyrhizobi-um symbiosis, the plant supplies the bacteria with pho-tosynthates (C) via phloem and receives N from fixation via xylem (e.g. Neves and Hungria, 1987; Williams et al., 1982). Symbiotic nitrogen fixation consumes 6–12 g C g−1 of fixed N, representing about 20–30 % of the total plant photosynthesis; however, this strong sink for C does not necessarily reduce yield, because it may modulate source activity (photosynthesis) (Kaschuk et al., 2009, 2010, 2012).
Soybean plant densities of 400,000 plants ha−1 (Embrapa Soja, 2011) or even higher (National Soybean Research Laboratory, 2012) are recommended. However, at lower densities, interplant competition for water, nu-trients and light could be mitigated (Andrade et al., 2002; Blumenthal et al., 1988). Conversely, at high densities shaded leaves may not contribute to canopy photosyn-thesis (Board et al., 1990, 1992), and will likely senesce and/or be susceptible to disease (Pons and Pearcy, 1994). Furthermore, the lack of light penetration to deeper lay-ers of the canopy may decrease yields (Stockman and Shibles, 1986). Finally, changes in the red/infrared ratios through the canopy may deeply affect both photosynthe-sis (Kasperbauer, 1987), and the onset of nodule forma-tion (Lie, 1969).
Symbiotic nitrogen fixation is an overwhelming sink for photosynthate and may limit yield (Kaschuk et al., 2009, 2010; Neves and Hungria, 1987). Howev-er, plants can increase photosynthesis rates to support increasing sinks (Kaschuk et al., 2009, 2012; Paul and Foyer, 2001). It remains to be determined to what extent source/sink relationships can be up-regulated. In addi-tion to the C requirements fornitrogen fixation and yield, soybean photosynthesis has to supply high C sinks from the seeds to lipid and protein accumulation (Kaschuk et al., 2010; Penning de Vries et al., 1974).
In this study we report results from a field experi-ment aimed at determining the effects of plant density onnitrogen fixation, yield, plus lipid and protein con-tents of soybean in connection with the relationship be-tween source activity and sink strength. The hypothesis was that different plant densities might not affect grain yield and quality, and as a “compensatory mechanism” lead to increases in both photosynthesis and nitrogen fixation rates.
Materials and Methods
Field site description
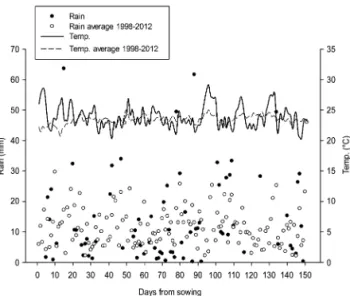
rain-fall occurs in the summer (Jan-Mar) and the minimum in winter (June-Aug). According to Köeppen’s classifica-tion, the climate in Londrina is subtropical humid (Cfa: humid, subtropical, with hot summers). Daily average temperature and daily rainfall during the experiment and their averages between 1998-2012 are shown in Fig-ure 1.
Lime had most recently been applied to the area in 2008. Chemical analysis of the soil (0-20 cm layer, samplings made 30 days before sowing) resulted in the following characteristics immediately before sowing: pH (0.01 M CaCl2), 5.21; H+Al, 37.1 (mmolc dm−3); Al, 0.7 (mmolc dm−3); P, 13.43 (mg dm−3): K, 6.4 (mmol
c dm −3); C, 18 g dm−3; Ca+Mg, 75.6 (mmol
c dm
−3); base satura-tion, 69 %. The soybean bradyrhizobia population in the soil was estimated by the most probable number (MPN) method using soybean plants (Vincent, 1970).
Treatments, experimental design and crop manage-ment
Before sowing, the soil was prepared using the tra-ditional practices of ploughing and disking. At sowing, the area received 300 kg ha–1 of fertilizer of 0-20-20 for-mulation. The commercial cultivar BRS 133 (genealogy: FT Abyara × BR83-147; maturity group 7.3, determinate type of growth) was shown on the 4th of November of 2009.
The experiment consisted of six treatments: T1) Non-inoculated control, with 50 cm between sowing lines and 16 plants m–1 (0.5 × 16 plants) (320,000 plants ha−1) (C); T2) Non-inoculated control + N-fertilizer (200 kg N ha−1, as urea, 50 % applied at sowing and 50 % at R2, broadcast, sown at 0.5 × 16 plants) (320,000 plants ha−1) (C + N); T3) Inoculated, with 50 cm × 4 plants per linear meter (0.5 × 4 plants) (80,000 plants ha−1); T4) Inoculated, with 50 cm × 16 plants (0.5 × 16 plants)
(320,000 plants ha−1); T5) Inoculated, with 1.0 m be-tween lines and 4 plants per linear meter (1.0 × 4 plants) (40,000 plants ha−1); T6) Inoculated, with 1.0 m between lines and 16 plants per linear meter (1.0 × 16 plants) (160,000 plants ha−1). Each plot measured 4 m in width by 6 m in length. The experiment had a completely ran-domized block design, with six replicates.
Seeds were not treated with fungicides or insecti-cide. Inoculation in treatments 3 to 6 consisted of add-ing peat inoculant (109 CFU g−1) containing B. elkanii commercial strains SEMIA 587 and SEMIA 5019 (= 29W). A 10 % sugar solution was used as an adhesive and the inoculant was applied to supply a theoretical concentration of 1.2 million cells seed−1, following the technical recommendation for the crop in Brazil (Embrapa, 2011; Hungria et al., 2007). At the V4 stage all treatments were sprayed with 20 g ha−1 of Mo, as per recommendation (Embrapa, 2011; Hungria et al., 2007). The following products were used: herbicides: Clorimuron (50 g ha−1) and Cletodim (0.4 L ha−1); in-secticides: Diflubenzuron (80 g ha−1), Thiametoxam + Lambdacihalotrina (200 cc ha−1). Rainfall provided moisture as shown in Figure 1.
Soil sampling, harvest, plant analyses and statistics Samplings were performed at three growth stages (Fehr et al., 1971): V4 (four unfolded trifoliolate leaves), R5 (seeds are 3 mm long in the pod at one of the four uppermost nodes on the main stem) and R8 (full ma-turity). At stages V4 and R5, eight plants per replicate were randomly harvested, excluding the central area (8 m2) of the plot determined to be used for yield evalu-ation. Harvesting of plants was carefully carried out with a shovel to include most of the root system so as to verify falling nodules; the whole plant was taken to the laboratory. Procedures at the laboratory to evaluate nodulation, shoot dry weight and total N in tissues were implemented as previously described (Hungria et al., 2006b). At V4 and R5, the parameters evaluated were nodulation (nodule number and dry weight), and shoot dry weight, while the dry weight of leaflets (presented apart from the whole shoot dry weight) was evaluated only at R5. Nitrogen content was evaluated by Kjeldahl’s digestion at V4 in shoots (leaves + stems) and at R5 in shoots and pods.
At the final harvest (8 m2 harvested in the central part of each replicate), the parameters estimated were number of plants m–2, yield (corrected to 13 % of mois-ture), dry weight of 100 grains (also corrected to 13 % of moisture), number of grains per plant−1, and N and oil contents of the grains. Lipid content (oil) in grains was determined in milled seeds in a Soxhlet extractor, using n-hexane as the solvent and following the methodology of Zenebon (2008).
The data were analyzed using the Infostat SAS statistical package (Di Rienzo et al., 2009). All assump-tions required by the analysis of variance were verified. Means were analyzed using Fisher’s test.
Results
The soil presented a high population of soybean bradyrhizobia, estimated at 2.871 × 10⁴ CFU g−1 soil (MPN method). The naturalized bradyrhizobial popu-lation produced good nodupopu-lation [nodule number per plant (NN), dry weight per nodule (DWN) and nodule dry weight per plant (NDW)] even in the non-inoculated control (T1) (Table 1). Inhibitory effects of chemical N-fertilizer (T2) on nodulation parameters were clearly ob-served at V4 and R2 stages (Table 1).
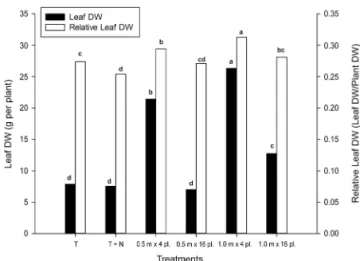
In the comparison of the non-inoculated treatment (T1) with the inoculated treatment of the same plant den-sity of 320,000 plants ha−1 (T4), there was an increase in dry weight per nodule (p < 0.0001) at V4 (Table 1), associated with large nodules at the root crown. At R5, no differences were detected in the comparison of the inoculated treatments with densities of 0.5 × 4 plants (T3) and 1.0 × 4 plants (T5), but these two treatments were superior (p < 0.0001) to the treatments with 0.5 × 16 plants (T4) and 1.0 × 16 plants (T6), both in nod-ule number and in dry weight parameters (Table 1). Ad-ditionally, higher leaf production was observed in both treatments with 4 plants per linear meter (T3 and T5) (Figure 2).
Shoot dry weight (SDW) values are also shown in Table 1. Similarly, nodulation data, at V4 differences be-tween inoculated treatments under different plant densi-ties were not significant, whereas, at R5 the same treat-ments, 0.5 × 4 plants (T3) and 1.0 × 4 plants (T5), were similar and higher than for treatments 0.5 × 16 plants (T4) and 1.0 × 16 plants (T6) (Table 1).
Patterns of N accumulation in shoots and pods at R5 (Figure 3) were similar to the results for nodula-tion and plant biomass producnodula-tion (Table 1). In Figure 3, emphasis should be given to the values of N in pods at R5, which confirm the superiority of the inoculated treatments with lower numbers of plants per meter, 0.5 × 4 plants and 1.0 × 4 plants It was also possible to establish a linear relationship between the parameters of plant biomass and N accumulation in plants both at
V4 (R2 = 0.95) and at R5 (R2 = 0.99) (Figure 4). However, the distribution of N in different organs was variable at R5 because, as already mentioned, the N content of the pods was higher in treatments with fewer plants per me-ter (Figure 3).
The highest yield was observed in the inoculated treatment with 0.5 × 16 plants (T4), followed by the non-inoculated control receiving N fertilizer at the same density (T2) and T3 and T6 (Table 2). Only at the lower density (T5) was a significant decrease in total grain pro-duction observed.
Finally, the number of grains per plant and the 100-grain weight in the inoculated treatments with low-er numblow-er of plants plow-er metlow-er [0.5 × 4 plants (T3) and 1.0 × 4 plants (T5)] were higher than at the other
densi-Figure 2 − Dry weight (DW) of leaflets per plant and relative dry weight of leaflet/total shoot dry weight at R5, as a function of plant density. Treatments: C, inoculated control; C + N, non-inoculated control + 200 kg of N ha−1, both with plant density of
0.5 m × 16 plants linear m−1. All other treatments were inoculated
with Bradyrhizobium and sown at densities of 0.5 m × 4 plants, 0.5 m × 16 plants, 1.0 m × 4 plants and 1.0 m × 16 plants Different letters indicate differences (p ≤ 0.05, Fisher’s test).
Table 1 − Effects of plant density on nodulation [nodule number, NN; dry weight per nodule, DWN; nodule dry weight, NDW; plant growth (shoot dry weight, SWD); nitrogen absorbed (N abs) by soybean cultivar BRS 133 at the V4 and R5 stages. Experiment performed on an Oxisol with established population of bradyrhizobia (≥ 104 cells g−1).
Inoculation† Spacing‡ Density NN DWN NDW SDW NN DWN NDW SDW N abs
--- V4 --- R5
---plant per ha n° per ---plant mg nod−1 mg per plant g per plant n° per plant mg nod−1 mg per plant g per plant mg N mg nod−1 per plant T1-Control 0.5 × 16 320,000 25.3 a§ 4.3 b 110 a 2.09 b 79.7 bc 6.5 b 520 b 28.48 c 2.71 ab T2-Control + N 0.5 × 16 320,000 16.5 b 2.6 c 40 c 2.62 ab 60.6 c 4.9 c 300 c 29.68 c
ties (p < 0.0001) (Table 2). Significant correlations were found between the 100-grain weight parameter with nodule weight (p ≤ 0.0001), leaflets (p ≤ 0.0001), and pods (p ≤ 0.0004) (data not shown). However, no differ-ences were observed in oil and protein contents between treatments, except in the extreme case of 40,000 plants ha−1 (Table 2).
Discussion
Soybean is exotic to Brazil, where the soils were originally devoid of compatible rhizobial strains ca-pable of nodulating the legume (Ferreira and Hungria, 2002; Hungria et al., 2006a; Santos et al., 1999). How-ever, the site where the experiment was conducted had been cropped for more than 20 years with soybean in the summer, always receiving inoculants containing soy-bean bradyrhizobia. Consequently, the highly natural-ized bradyrhizobia population resulted in good nodula-tion even in the non-inoculated control, but N-fertilizer clearly inhibited nodulation. The results from our study confirm previous reports on Brazilian soils (Hungria et
Figure 4 −Linear regression at V4 (A) and R5 (B) growth stages between shoot dry weight per plant, DW per plant (g); and N content per plant, N per plant (mg) of the plants from all treatments.
Figure 3 – Nitrogen (N) content per kg of dry weight at R5, considering the whole plant, the plant without the pods and only the pods. Treatments as described in Figure 2. Different letters indicate differences (p ≤ 0.05, Fisher’s test).
Table 2 − Effects of plant density on grain yield parameters of the soybean cultivar BRS 133.
Inoculation† Spacing‡ Density§ Density¶ Yield 100 grains No. grains Oil content Protein content --- plant per ha --- kg ha−1 g no per plant --- g kg−1
---T1-Control 0.5 × 16 320,000 361,700 3,160 ab†† 14.4 b 82.9 d 230.2 ab 361.3 a
T2-Control + N 0.5 ×16 320,000 328,400 3,240 a 14.5 b 87.6 d 229.8 ab 358.4 ab
T3-Inoculated 0.5 × 4 80,000 87,700 3,156 ab 16.2 a 277.4 b 227.5 ab 362.9 a
T4-Inoculated 0.5 ×16 320,000 361,900 3,334 a 14.4 b 76.6 d 216.7 b 361.5 a
T5-Inoculated 1.0 × 4 40,000 42,100 2,137 c 16.3 a 376.2 a 232.8 a 354.6 b
T6-Inoculated 1.0 ×16 160,000 177,100 3,004 b 14.5 b 135.8 c 228.1 ab 357.1 ab
†Non-inoculated control, with or without N fertilizer (200 kg of N ha−1, split 50 % at sowing and 50 % at flowering); and inoculation with B. elkanii strains SEMIA 587 + SEMIA 5019, at the rate of 1.2 × 10⁶ cells seed−1; ‡Distance between lines (m) × number of plants per linear meter;§Theoeretical value; ¶Evaluation at harvest time, based on number of plants m−2; ††Means (n = 6) from the same column followed by different letters are different (p
al., 2006a, 2006b, 2007; Mendes et al., 2004; Mercante et al., 2011) that reinoculation (inoculation every year) with elite strains can improve nodulation, nitrogen fixa-tion rates and grain yield in soybean.
When the naturalized population was compared to the inoculation in plants with the same density of 320,000 plants ha−1, there was an increase in dry weight per nodule at V4 (Table 1), associated with large nodules at the root crown. At R5, no differences in nodulation were detected in the comparison of treatments differing in distance between rows ( 0.5 × 4 plants and 1.0 × 4 plants), but on average, passing from 16 to 4 plants per linear meter in the inoculated treatments increased nod-ule dry weight at R5 by 108 %. The higher nodulation at R5 in the treatments with lower numbers of plants per linear meter, with no effect of the distance between planting rows could be explained by the higher dried leaflets weight (leaf blade without petiole) per plant, as well as by the partitioning of this plant biomass, consist-ing of higher leaf production in both treatments with 4 plants per linear meter, implying greater availability of photosynthates. In consequence, there might be greater availability of root exudates capable of promoting rhi-zobial growth in the rhizosphere, as well as C sources for the formation and functioning of the nodules, main-taining higher nitrogen fixation rates. Furthermore, the increased availability of C skeletons per plant would also facilitate the transport of ureides, the major nitrogenous compounds with low C:N ratio synthesized in soybean nodules (Hungria et al., 2006b; Neves and Hungria, 1987). Altogether, these results provide strong evidence for the source/sink links between photosynthesis and ni-trogen fixation (Kaschuk et al., 2009, 2012; Neves and Hungria, 1987).
The results obtained for biomass accumulation (SDW) and the patterns of N accumulation in tissues were similar to those reported for nodulation. These re-sults indicate that plant biomass production at R5 was more affected by the number of plants per meter than by the distance between rows. Indeed, at R5, in the inocu-lated treatments, there was an average increase in SDW of 93 % in treatments with 4 plants per linear meter, when compared with 16 plants per meter.
Besides the mechanisms of source/sink, another explanation for the higher nodulation and plant biomass in treatments with 0.5 × 4 plants and 1.0 × 4 plants might be related to qualitative differences in light, par-ticularly in terms of the infrared/red relationship. In a study about the absorption, reflection and transmission of light from individual leaves of soybean, it has been reported that the majority of the blue and the red are absorbed, whereas much of the infrared is reflected or transmitted (Kasperbauer, 1987). Consequently, plants that grow in fields with little space between lines, or oth-erwise with high plant densities, receive higher ratios of infrared/red than those growing with greater distances between rows, or otherwise at lower densities (Kasper-bauer, 1987). In turn, the infrared/red ratio influences
various parameters of plant development, such as ultra-structure of the chloroplasts, the partitioning of carbohy-drates to cells, photosynthetic efficiency, concentration of several metabolites, and partitioning between shoots and roots (Kasperbauer and Hamilton, 1984; Kasperbau-er et al., 1984; KaspKasperbau-erbauKasperbau-er, 1987). FurthKasperbau-ermore, thKasperbau-ere is also evidence of the control of nodulation by the phyto-chrome system, similarly favored by red light and inhib-ited by infrared radiation (Lie, 1969).
Regarding the efficiency of the nodules, treatments with 40,000 and 160,000 plant–1 presented greater val-ues of N per unit of nodule dry weight than plants with 320,000 plants ha−1, probably due to increased supplies of photosynthates. Nodule dry weight was not correlated with plant biomass, or with the N accumulated at V4, but was significantly correlated at R5 (both with p < 0.0001) (data not shown), indicating that increased nod-ule mass in low-density treatments was related to higher rates ofnitrogen fixation. In contrast, Kapustka and Wil-son (1990) found that an increase in soybean plant den-sity reduced nodule number and dry weight per plant, but maintained high specific activity per nodule, which resulted in the same values ofnitrogen fixation per plant.
In R5, N content of the pods was higher in treat-ments with fewer plants per meter, which could be explained by the higher content of RuBisCO enzyme (ribulose-1,5-bisphosphate carboxylase oxygenase, E.C. number 4.1.1.39), which comprises about 50 % of the total protein content in leaves and is also present in the pods, and thus represents an important source of N for mobilization (Schiltz et al., 2004). The amount and ac-tivity of RuBisCO are directly related to light quality, being superior in red light compared to infrared light (Eskins et al., 1991). Consequently, especially at ad-vanced growth stages such as R5, one might assume that the content and activity of RuBisCO are higher in lower plant densities.
water might be mitigated (Andrade et al., 2002; Blumen-thal et al., 1988). Another important comment is that nowadays there is pressure to increase soybean plant densities with the aim of generating higher yields; how-ever, our results indicate that this might not be the best approach.
Both the number of grains per plant and the 100-grain weight in the inoculated treatments were high-er at a spacing of 0.5 m. BRS 133 is a high-yield cultivar (p < 0.0001). These results indicate that, under favor-able C/N source/sink conditions, it is possible to improve expression of the genetic potential of the cultivar. The lower number of plants per meter allowed for the larg-est individual plant growth and higher photosynthetic rate per plant which, in turn, demanded a greater sup-ply of N through biological fixation. On the other hand, at higher densities, photosynthetic rates per plant were lower, as were nitrogen fixation inputs per plant. These results are consistent with studies of photosynthetic rate reduction, in which manipulations of the source, such as shading and defoliation, resulted in reductions in the number and dry weight of grains per plant (Egli, 2010; Proulx and Naeve, 2009). Additionally, with decreases in the supply of photosynthates (source) caused by the same treatments there were decreases in the rates of ni-trogen fixation (Neves and Hungria, 1987).
In our experiment, shading did not change oil content between treatments (p = 0.4977), except in the extreme case of 40,000 plants ha−1, which resulted in higher values. Proulx and Naeve (2009) observed that shading caused greater decreases than defoliation, whereas Butler et al. (2010) found no differences in lin-oleic acid content at densities ranging from 185,000 to 556,000 plants ha−1. Altogether, these results indicate that in general, neither protein nor oil content are af-fected by density, except in very low plant populations, as shown in our study, and probably in very high popu-lations too.
Conclusions
At lower plant densities the photosynthetic rate per plant increased and, consequently, higher C supply to the nodules resulted in increases in nodulation and in nitrogen fixation rates. The number of plants per linear meter was a stronger factor than the distance between rows, especially at R5, indicating greater importance of source/sink mechanisms at later stages of plant growth, when quantitative and qualitative factors (e.g. infrared/ red ratio) affecting light become decisive. Soybean had the potential to at least quadruple both photosynthesis and biological nitrogen fixation at lower plant densities. It is also worth mentioning the implications related to the cost of using four times more seeds and inputs, par-ticularly pesticides, at sowing, as similar yields can be achieved with much lower plant densities than those recommended today, with important environmental and economic implications.
Acknowledgments
The study was partially supported by the Brazil-ian National Council for Scientific and Technological Development (CNPq), Project Repensa (562008/2010-1). Authors acknowledge Dr. Allan R.J. Eaglesham for Eng-lish review and suggestions and Dr. Glaciela Kaschuk for suggestions on the manuscript. M.J. de Luca ac-knowledges a fellowship from CNPq (370481/2012-7) and M. Hungria is also a research fellow from CNPq (300547/2010-2). Manuscript approved for publication by the Editorial Board of Embrapa Soja (17/2012).
References
Andrade, F.H.; Calviño, P.; Cirilo, A.; Barbieri, P. 2002. Yield responses to narrow rows depend on increased radiation interception. Agronomy Journal 94: 975-980.
Blumenthal, M.J.; Quach, V.P.; Searle, P.G.E. 1988. Effect of soybean population density on soybean yield, nitrogen accumulation and residual nitrogen. Australian Journal of Experimental Agriculture28: 99–106.
Board, J. 2000. Light interception efficiency and light quality affect yield compensation of soybean at low lant populations. Crop Science 40: 1285-1294.
Board, J.; Harville, B.G.; Saxton, A.M. 1990. Branch and dry weight in relation to yield increase in narrow-row soybean. Agronomy Journal 82: 540-544.
Board, J.; Kamal, M.; Harville, B.G.1992. Temporal importance of greater light interception to increased yield in narrow-row soybean. Agronomy Journal 84: 575-544.
Butler, J.A.; De Bruin, J.L.; Pedersen, P. 2010.Plant density effect on reduced linolenic acid soybean cultivars. Agronomy Journal 102: 348-354.
Egli, D.B. 2010. Soybean reproductive sink size and short-term reductions in photosynthesis during flowering and pod set. Crop Science 50: 1971-1977.
Empresa Brasileira de Pesquisa Agropecuária [Embrapa]. 2011. Tecnologies of soybean Production: Central Region of Brazil 2012-2013 = Tecnologias de Produção de Soja: Região Central do Brasil 2012 e 2013. Embrapa Soja, Londrina, PR, Brazil. Eskins, K.; Jiang, C.Z.; Shibles, R. 1991. Light-quality and
irradiance effects on pigments, light-harvesting proteins and Rubisco activity in a chlorophyll- and light- harvesting-deficient soybean mutant. Physiologia Plantarum 83: 47-53.
Fehr, W.; Caviness, C.; Burmood, D.T.; Pennington, J.S. 1971. Stage of development descriptions for soybeans, Glycine max
(L) Merrill. Crop Science 11: 929-931.
Ferreira, M.C.; Hungria, M. 2002. Recovery of soybean inoculant strains from uncropped soils in Brazil. Field Crops Research 79: 139-152.
Hungria, M.; Campo, R.J.; Mendes, I.C.; Graham, P.H. 2006a. Contribution of biological nitrogen fixation to the N nutrition of grain crops in the tropics: the success of soybean (Glycine max
L Merr.) in South America. p. 43-93. In: Singh, R.P.; Shankar, N.; Jaiwal, P.K., eds. Nitrogen nutrition and sustainable plant productivity. Studium Press, Houston, TX, USA.
Hungria, M.; Franchini, J.C.; Campo, R.J.; Crispino, C.C.; Moraes, J.Z.; Sibaldelli, R.N.R.; Mendes, I.C.; Arihara, J. 2006b. Nitrogen nutrition of soybean in Brazil: contributions of biological N2 fixation and of N fertilizer to grain yield. Canadian Journal of Plant Science 86: 927-939.
Hungria, M.; Franchini, J.C.; Campo, R.J.; Graham, P.H. 2005. The importance of nitrogen fixation to soybean cropping in South America. p. 25-42. In: Werner, W.; Newton, W.E., eds. Nitrogen fixation in agriculture, forestry, ecology and the environment. Springer, Dordrecht, The Netherlands.
Kapustka, L.A.; Wilson, K.G. 1990. The influence of soybean planting density on dinitrogen fixation and yield. Plant and Soil 129: 145-156.
Kaschuk, G.; Kuyper, T.W.; Leffelaar, P.A.; Hungria, M.; Giller, K.E. 2009. Are the rates of photosynthesis stimulated by the carbon sink strength of rhizobial and arbuscular mycorrhizal symbioses? Soil Biology & Biochemistry 41: 1233-1244. Kaschuk, G.; Leffelaar, P.A.; Giller, K.E.; Alberton, O.; Hungria,
M.; Kuyper, T.W. 2010. Responses of grain legumes to rhizobia and arbuscular mycorrhizal fungi: a meta-analysis of potential photosynthate limitation of symbioses. Soil Biology & Biochemistry 42: 125-127.
Kaschuk, G.; Yin, X.; Hungria, M.; Leffelaar, P.A.; Giller, K.E.; Kuyper, T.W. 2012. Photosynthetic adaptation of soybean due to varying effectiveness of N2 fixation by two distinct
Bradyrhizobium japonicum strains. Environmental and
Experimental Botany 76: 1-6.
Kasperbauer, M.J. 1987. Far-red light reflection from green leaves and effects on phytochrome-mediated assimilate partitioning under field conditions.Plant Physiology 85: 350-354.
Kasperbauer, M.J.; Hamilton, J.L. 1984. Chloroplast structure and starch grain accumulation in leaves that received different red and far-red levels during development. Plant Physiology 74: 967-970.
Kasperbauer, M.J.; Hunt, P.G.; Sojka, R.E. 1984. Photosynthate partitioning and nodule formation in soybean plants that received red or far-red light at the end of the photosynthetic period. Physiologia Plantarum 61: 549-554.
Lie, T.A. 1969. Non-photosynthetic effects of red and far-red light on root-nodule formation by leguminous plants. Plant and Soil 30: 391-404.
Mendes, I.C.; Vargas, M.A.T.; Hungria, M. 2004. Establishment of
Bradyrhizobium japonicum and B. elkanii in a Brazilian Cerrados oxisol. Biology and Fertility of Soils 40: 28-35.
Mercante, F.M.; Hungria, M.; Mendes, I.C.; Reis Junior, F.B. 2011. Strategies to Improve the Efficiency of Microbial Inoculants with the Soybean Crop = Estratégias para Aumentar a Eficiência de Inoculantes Microbianos na Cultura da Soja. Embrapa Agropecuária Oeste, Dourados, MS, Brazil.
National Soybean Research Laboratory 2012. Soybean production basics. Available at: http://www.nsrl.illinois.edu/general/ soyprod.html [Accessed Sep 28, 2012]
Neves, M.C.P.; Hungria, M. 1987. The physiology of nitrogen fixation in tropical grain legumes. Critical Reviews in Plant Science 6: 267-321.
Paul, M.J.; Foyer, C.H. 2001. Sink regulation of photosynthesis. Journal of Experimental Botany 52: 1383-1400.
Penning de Vries, F.W.T.; Brunsting, A.H.M.; van Laar, H.H. 1974. Products, requirements and efficiency of biosynthesis: a quantitative approach. Journal of Theoretical Biology 45: 339-377.
Pons, T.L.; Pearcy, R.W. 1994. Nitrogen reallocation and photosynthetic acclimation in response to partial shading in soybean plants. Physiologia Plantarum 92: 636-644.
Proulx, R.A.; Naeve, S.L. 2009. Pod removal, shade, and defoliation effects on soybean yield, protein, and oil. Agronomy Journal 101: 971-978.
Santos, M.A.; Vargas, M.A.T.; Hungria, M. 1999. Characterization of soybean bradyrhizobia strains adapted to the Brazilian Cerrados Region. FEMS Microbiology Ecology 30: 261-272. Schiltz, S.; Gallardo, K.; Huart, M.; Negroni, L.; Sommerer, N.;
Burstin, J. 2004. Proteome reference maps of vegetative tissues in pea: an investigation of nitrogen mobilization from leaves during seed filling. Plant Physiology 135: 2241-2260.
Stockman, Y.M.; Shibles, R, 1986. Soybean pod and flower abscission as influenced by carbohydrate supply durind flowering. Iowa State Journal of Research 61: 35-48.
Vincent, J.M. 1970. A Manual for the Pratical Study of Root-Nodule Bacteria. Blackwell Scientific, Oxford, UK. (IBP Handbook, 15).
Williams, L.E.; Dejong, T.M.; Phillips, D.A. 1982. Effect of changes in shoot carbon-exchange rate on soybean root nodule activity. Plant Physiology 69: 432-436.