BJRS
RADIATION SCIENCES
08-03 (2020) 01-13ISSN: 2319-0612 Accepted: 2020-08-19
Image quality evaluation for two different positron
emitters in a preclinical PET scanner
1,2
Gontijo, R.M.G.,
1Ferreira, A.V.,
1,2Souza, G.A.C.,
1Silva, J.B.,
1,2Mamede, M.
1Centro de Desenvolvimento da Tecnologia Nuclear/CDTNAv. Presidente Antônio Carlos, 6.627 31270-901 Belo Horizonte, MG, Brazil
2Departamento de Anatomia e Imagem/ IMA
Universidade Federal de Minas Gerais 31270-901 Belo Horizonte, MG, Brazil
ABSTRACT
Positron emission tomography (PET) is widely used in preclinical trials, generating molecular images applied to biochemical, metabolic and functional investigation of organs and tissues. The positron emitters 11C and 18F are
relevant for different diseases studies. However, they have different positron energies, ranges, and branching ratio. This could result in a distinct quality between the acquired PET images. Thus, the aim of this study was to evaluate differences in the image quality performance of the PET scanner (LabPET 4, GE) at Molecular Imaging Laboratory (LIM/CDTN) depending on the use of18F or 11C. The study followed the guidelines of the NEMA NU
4-2008 standards and the recommended specific phantom was used in experimental procedures. The NEMA image-quality (IQ) phantom consists of 3 different regions to analyze distinct characteristics: uniformity, recovery coefficients (RCs) and spill-over rations (SOR) in air and water. The IQ phantom was filled with two different aqueous solutions (18F-FDG and 11C-PK11195), both activities calibrated at the beginning of acquisition
(3.7MBq). The IQ phantom was placed in the center of the field-of-view (FOV) and measured with the LIM/CDTN typical whole body imaging protocol. The images were reconstructed following the LIM/CDTN standard protocol: MLEM-3D algorithm, 20 iterations, no high-resolution mode, no attenuation or scatter corrections, no post-filtering. PMOD® software was used to perform images post-processing. Uniformity test
revealed that 11C PET image roughness is about twice 18F PET image roughness. SOR tests indicated around
15% more counts in cold volumesin 11C PET image than in 18F PET image. The RCs for 11C were systematically
lower and with higher percentage standard deviations than those for 18F. This study demonstrated and
quantified the best performance of PET images with 18F when compared to 11C. This fact must be taken into
account in laboratorial practice, especially when quantitative analyzes are performed.
1. INTRODUCTION
Positron emission tomography (PET) is widely used in preclinical trials, generating molecular images applied to biochemical, metabolic and functional investigation of organs and tissues. This imaging modality of nuclear medicine is important in the development of new radiopharmaceuticals or in studies of new applications of traditional radiopharmaceuticals [1]. Because of widespread use and commercial availability of small-animal PET scanners, the National Electrical Manufactures Association (NEMA) published its NU 4/2008 standards [2], a consistent and standardized methodology for measuring scanner performance parameters for small animal PET imaging. The publication covers the parameters spatial resolution, scatter fraction, count losses and random coincidence measurements, sensitivity, image quality, accuracy of attenuation and scatter corrections. In this sense, results of standardized measurements make possible to compare performances of different small animal PET scanners and can be used for acceptance tests of equipment [2].
Currently in Brazil, there are six centers of preclinical molecular imaging using PET routinely [3], one of them installed in the Molecular Imaging Laboratory (LIM) of Nuclear Technology Development Center (CDTN). Although most studies conducted at LIM/CDTN involve 18F-labeled radiopharmaceuticals [4-9], some effort has been made in studies with 11C-labeled radiopharmaceuticals [10, 11]. In this context, it is important to keep in mind that differences in physical and chemistry properties of radionuclides can results in different performances of the PET scanner [12]. For example, the positron maximum energy is about 0.6 MeV for 18F and about 1.0 MeV for 11C. Since the positron range increases with positron energy, the use of 11C in PET studies
results in a reduction of spatial resolution when compared with 18F studies, which can be observed from increased blurring of images reconstructed with fixed reconstruction settings [12].
NEMA 4-2008 publication possesses an entire section (section 6) dedicated to evaluating the image capabilities of the scanner including image quality, accuracy of attenuation and scatter corrections. The purpose of these tests is to produce PET images simulating those obtained in a typical total body study of a small rodent by using a specific phantom [2]. The publication establishes that these tests shall be performed with 100 μCi (3.7 MBq) of 18F during 20 min.
Therefore, the standard measurements procedures permit comparison of image capabilities of different scanners in a well stablished condition.
However, in the laboratorial practice, differences of performance of a particular PET scanner can occur due to the use of different radionuclides. So, the dependence of PET scanner performance with the radionuclide must be known to assure a correct image interpretation. Thus, the aim of this work was to evaluate, based in the NEMA NU 4-2008 standards, image capabilities of the PET scanner at LIM/CDTN using 18F and 11C positron emitters. The choice of these radionuclides was due to their use in the LIM/CDTN experimental preclinical studies.
2. MATERIALS AND METHODS
The experiments were carried out at the Molecular Imaging Laboratory (LIM/CDTN) and with collaboration of the Radiopharmaceutical Research and Production Unit (UPPR/CDTN), which made the 18F-FDG and 11C-PK1195 radiopharmaceuticals available. These radiopharmaceuticals were used in this work as sources of 18F or 11C positron emitters. Table 1 presents the main parameters of these two radionuclides.
Table 1: Main physical, chemical and nuclear properties of 18F and 11C radionuclides [13].
Radionuclide Half-Life (min)
β+Branch Ratio (%)
β+ Energy (keV) β+ Range in water (mm)
Maximum Mean Maximum Mean
11C 20.4 min 99.8 0.960 0.386 4.2 1.2
18
F 109.7 min 96.9 0.634 0.250 2.4 0.6
2.1. PET scanner
The Triumph™ platform is a preclinical system dedicated for rodents imaging. The subsystem LabPET 4 consists of a stationary gantry with 1536 detectors. It employs an Avalanche Photo Diode (APD) detector ring incorporating an assembly of LYSO (Lutetium yttrium oxyorthosilicate – Lu1.9Y0.1SiO5) and LGSO (Lutetium gadolinium oxyorthosilicate – Lu0.4Gd1.6SiO5) scintillators optically coupled one after the other [14]. LabPET 1.12.1 software, provided by the scanner manufacturer, controls acquisition and reconstruction of PET images [15].
LabPET 4 images are acquired using a 250-650 keV energy window and 22 ns coincidence timing window. It provides axial field of view (FOV) of 3.7 cm and can operate in a dynamic or static mode. Coincident data are saved in list mode and can be sorted out as sinograms. More details about the LabPET 4 design and architecture are presented elsewhere [16, 17].
2.2. Image quality phantom
For imaging capabilities evaluation, the NEMA NU 4/2008 recommends a specific Image Quality (IQ) phantom. This phantom (Figure 1) is made up of polymethylmethacrylate (PMMA) with internal dimensions of 50 mm length and 30 mm diameter. It has a main chamber that communicates with five different diameters auxiliary rods (1, 2, 3, 4, and 5mm), all of which are expected to be filled with radiopharmaceutical water solution. Thus, activity concentration in any rod is the same that the one in main chamber. In addition, the IQ phantom possesses two cold chambers - one of them to be filled with air and the other one with water, both no radioactive. Details of IQ phantom are presented at NEMA 4-2008 publication [2].
A B C
Figure 1: Image Quality phantom.A: Photo gallery of authors; B: schematic representation
where blue indicates radiopharmaceutical fillable volumes; C: phantom positioned on PET scanner FOV.
2.1. Image Acquisition and Image Reconstruction Procedures
For 18F studies, acquisition procedure and also the image analysis procedure followed the recommendation of NEMA NU 4-2008 publication (3.7 MBq at the beginning of acquisition, 20 min acquisition time). The activity in the phantom was measured with a Capintec CRC®-25R
activimeter. For 11C studies, NEMA recommendations were adapted (3.7 MBq at the beginning of acquisition, 30 min acquisition time) in order to assure the same number of positrons during the image acquisition - considering half-life and branching ratio of each radionuclide.
The IQ phantom filled with radiopharmaceutical was placed in the center of the axial FOV (Figure 1C) and measured with the LIM/CDTN typical whole-body imaging protocol which uses three bed positions in order to cover the phantom length. Decay corrections were automatically done by LabPET 1.12.1 software in order to adjust the acquisition time for each bed position.
After acquisition, PET images were reconstructed following the LIM/CDTN standard protocol: MLEM-3D algorithm, 20 iterations, no high-resolution mode, no attenuation or scatter corrections, no post-filtering. IQ phantom image acquisition and reconstruction were performed with the LabPET 1.12.1 software, provided by the small-animal PET scanner manufacturer [15].
2.2. Image Analysis
After image reconstruction, scanner image capabilities tests recommended by the NEMA 4-2008 publication (section 6) were performed, namely Uniformity, Spill-Over Ratio (SOR) and Recovery Coefficient (RC):
(i) The Uniformity test consists of to obtain mean (ACmean), maximum (ACmax), minimum
(ACmin) and standard deviation (ACSD) of the activity concentration in the main chamber. To
perform this test, a central cylindrical volume of interest (VOI) with 22.5 mm diameter and 10mm height was analyzed. The number of counts per second (CPS) in the VOI were converted in activity concentration (kBq.ml-1) using a previous calculated conversion coefficient. The percentage standard deviation (%SD), also named image roughness (%IR) [18], was evaluated according the equation (1):
%𝑆𝐷 = %𝐼𝑅 = 100 ×
𝐴𝐶𝑆𝐷𝐴𝐶𝑚𝑒𝑎𝑛 (1)
where: ACmean is the mean activity concentration measured in VOI positioned in the uniform region
chamber is an indicative of attenuation and scatter correction performance of the PET scanner [2]. (ii) The ratio between the mean activity measured in a cold chamber (filled with air or water) and the mean activity measured in the main chamber provides the Spill-Over Ratio. To perform this test, a central cylindrical VOI (4 mm diameter, 7.5 mm height) in each cold chamber was analyzed. SOR test results are an indicative of scatter correction performance of the PET scanner [2].
(iii) The ratios between the mean activity measured in each one of the five auxiliary rods and the mean activity measured in the main chamber provides the image Recovery Coefficients. To perform this test, the 10 mm length central region of each rod was average to obtain a single image in which the coordinates of the highest value pixel were determined. Then, for each rod, the mean activity concentration was determined considering a 10 mm axial line passing through the highest value pixel. The RCs are indicative of the spatial resolution of the PET scanner [2].
More details of analysis for image quality tests are provided in NEMA 4-2008 and also in a previous work [9]. Image quantitative analyses were performed using PMOD® software, v3.7 [19] -software designed for research in the field of molecular imaging that allows quantitative data processing. Activity concentration in specific VOI was achieved using PMOD® PBAS tool. This tool supports viewing and processing of molecular images and allows quantitative approaches as statistics of VOI pixels [19].
3. RESULTS AND DISCUSSION
Figure 2 presents a comparison of typical images of IQ phantom for the two positrons emitters,
11C and 18F. Qualitatively, it is possible to see that 18F PET image (Figure 2B) presents less image
roughness and also a better IQ phantom contours definition than 11C PET image (Figure 2A). This finding will be discussed further below.
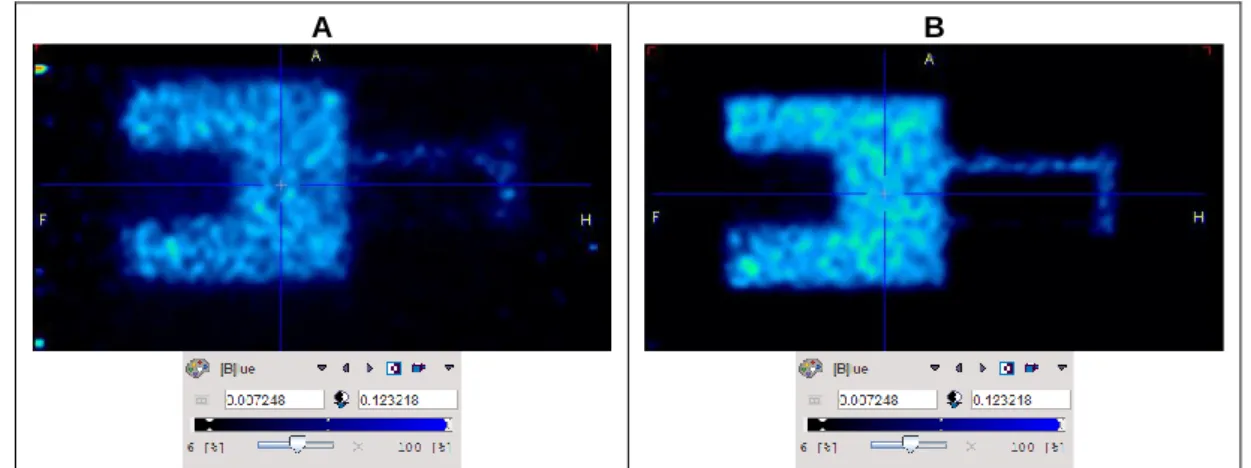
Figure 3 illustrates the methodology of analysis of the PET image. In figure it is possible to see VOIs positioned in regions that were analyzed: a single cylindrical VOI in the main chamber to uniformity test (Figure 3A); three cylindrical VOIs (in main and in cold chambers) to Spill-Over Ratio tests (Figure 3B). The recovery coefficient test is illustrated for the 5mm auxiliary rod (Figure 3C).
A B
Figure 2: PET image (sagittal plane) of the Image Quality phantom using 11C (A) e 18F (B).
Note that scales indicate same color definition in both images.
A B C
Figure 3: 18F PET image of IQ phantom. A: cylindrical VOI positioned in the main chamber for Uniformity test; B: cylindrical VOIs positioned in main and cold chambers for Spill-Over Ratio tests; C: Recovery Coefficient test: (left) red line indicates the 10mm length central region of the 5mm rod; (right) orange circle indicates the average image of the 10mm length central region of 5mm rod and central cross indicates the hottest pixel.
3.1. Uniformity test
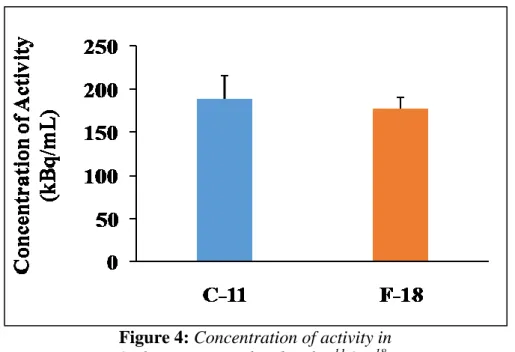
Figure 4 presents the activity concentration in the main chamber of the IQ phantom for the two radionuclides, 11C and 18F.
Figure 4: Concentration of activity in
IQ phantom main chamber for 11C e 18F.
11C PET image presented highest percentage standard deviation of the activity concentration in
the main chamber of IQ phantom than18F PET image: 14.5%STD for 11C and 7.7%STD for 18F. Considering that this parameter measures the image roughness, uniformity analysis demonstrated that 11C image was twice as rough as 18F image. This finding confirms the qualitative analysis of Figure 2. This fact may be explained by the higher range of 11C positron when compared to 18F positron range. Positron range generates an error in the localization of the true position of the positron emission since coincidence detection is related to the location of positron annihilation.
The value of image roughness for 18F radionuclide obtained in this study, 7.7%, is in accordance with that published for the LabPET 8™ scanner, where the authors obtained a value of 7.0% [20]. The lack of studies using11C in literature makes comparison of the performance of the PET scanner for this radionuclide with other authors and other small animal PET scanners impossible.
3.2. Spill-over ratio
Figure 5 presents the spill-over ratio in the two non-radioactive chambers (air and water) for 18F and 11C radioisotopes.
Figure 5: Spill-over ratio for 11C e 18F.
In air, the mean SOR values obtained for 11C and 18F were 0.33 and 0.29, respectively. In water, the mean SOR values obtained for 11C and 18F were 0.22 and 0.19. For both cold chambers, 11C SOR values are around 15% higher than 18F SOR values, indicating the worst performance of the image quality of this radionuclide. Once again, this finding is due to differences in radionuclides physical properties, since positron from 11C possesses the higher positron range.
For both radionuclides, SOR values for air chamber is higher than those for water chamber. Figure 6 shows the count rates obtained from the linear profile traced in the 18F PET image (axial
plane) at the region containing the two cold chambers. In this figure is possible to see the difference in counting rate between water chamber and air chamber where count rates in air chamber is higher than those in water chamber.
18F SOR value obtained for the cold chamber filled with water (SOR
Water: 0.19) are compatible
with the value reported by Prasad et al. for the LabPET 8™ scanner (SORWater: 0.20)[20]. However,
the18F SOR value obtained for the cold chamber filled with air (SORAir: 0.29) are significantly
higher than those reported by the authors (SORAir: 0.11) [20]. This fact may be explained by
different characteristics between the scanners. LabPET4 scanner used in this study is not able to quantify and correct the scattered coincidence events, unlike the upper model (LabPET 8™) used by the authors [20].
The lack of studies using 11C in literature makes comparison of the scanner performance of this radionuclide with other authorsand other PET scanners impossible.
3.3. Recovery coefficients
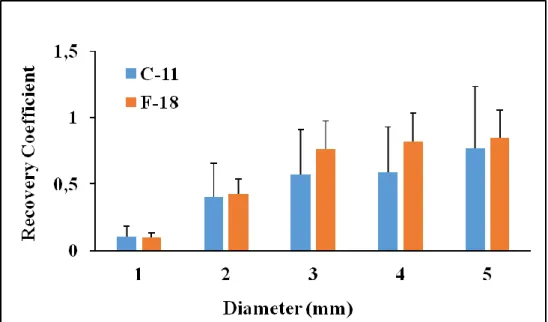
Figure 7 presents,for the two radionuclides,the recovery coefficients from the 5 auxiliary rods with different diameters (1-5mm) and respective standard deviations. Results indicate that RCs for
11C were systematically lower and with higher percentage standard deviations than those for 18F.
For the 1-mm-diameter rod, the respective RC values obtained for 11C and 18F were 0.10 ± 80% and 0.10 ± 30%, while for the 5-mm-diameter rod the values were 0.77 ± 60% and 0.85 ± 24%. The worst performance of 11C image was expected since the RC test is an indicative of the PET scanner spatial resolution [2] and this parameter is dependent of positron range [12]. These quantitative results must be considered in PET image analysis, especially in the analysis of small structures in preclinical experiments.
RC results for 18F radionuclide are in accordance with those published by Prasad et al. [20] for the LabPET 8 model: 1 mm - 0.13; 2 mm - 0.32; 3 mm - 0.58; 4 mm - 0.83; 5 mm - 0.96. The lack of studies using 11C in literature makes impossible comparison of the scanner performance for this radionuclide with other authors and other small animal PET scanners.
4. CONCLUSION
The results obtained in this work using IQ phantom defined by NEMA NU 4/2008 revealed that the system LabPET 4 of LIM/CDTN produces 18F PET images with performance according to the literature. The assessment of PET image quality using 11C radionuclide was not found in the literature until now and makes comparison with other authors and other scanners impossible.
In a general way, it was observed that 18F PET image presents better results for image quality tests when compared to 11C PET image. This fact was expected due differences in radionuclides positron ranges. The present work allowed quantifying the differences in performance of the PET scanner when using these two different radionuclides. The results are important to laboratorial practice and may be taken in account in experimental preclinical study designer and also in quantitative PET image analysis.
ACKNOWLEDGMENT
This work was supported and financed by FAPEMIG, CNPq, UFMG and CDTN/CNEN. The authors would like to thank the UPPR / CDTN team for providing the radiopharmaceuticals used in the experiments.
REFERENCES
[1] R. YAO, R.; LECOMTE, R.; CRAWFORD, E. Small-Animal PET: What is it, and why do we need it?Journal of Nuclear Medicine Technology. Vol. 40 nº3, pp.157-165. 2011.
[2] National Electrical Manufacturers Association. Performance Measurements of Small Animal Positron Emission Tomographs. Rosslyn VA; 2008 Standards Publication NU 4- 2008.
[3] GONTIJO, R. M. G.; FERREIRA, A. V.; SILVA, J, B.; MAMEDE, M. Quality control of small animal PET scanner: The Brazilian Scenario. Brazilian Journal of Radiation Sciences. v. 8. p. 01-09. 2020.
[4] SILVEIRA, M. B. et al., Preclinical acute toxicity, biodistribution, pharmacokinetics, radiation dosimetry and microPET imaging studies of [18F]Fluorocholine in mice. Applied Radiation and Isotopes, v. 116, p. 92-101. 2016.
[5] SILVEIRA, et al., 18 F-Fluorocholine Uptake and Positron Emission Tomography Imaging in Rat Peritoneal Endometriosis. Reproductive Sciences. v. 1. 2017.
[6] MENDES, B. M et al., New Radiation Dosimetry Estimates for [18F]FLT based on Voxelized Phantoms. Radiation Research. v. 190. p. 37-44. 2018.
[7] SCHIRMER, B. G. A. et al. Comparison of [18F]Fluorocholine and [18F]Fluordesoxyglucose for assessment of progression, lung metastasis detection and therapy response in murine 4T1 breast tumor model. Applied Radiation and Isotopes. v. 140. p. 278-288. 2018.
[8] GONTIJO, R.M.G., et al. Image quality assessment using NEMA NU 4/2008 standards in small animal PET scanner. Brazilian Journal of Radiation Sciences. v. 7, p. 1-13. 2019
[9] GONTIJO, R. M. G., et al. Image quality evaluation of a small animal PET scanner. Brazilian Journal of Radiation Sciences. v. 8. p. 01-13, 2020.
[10] ALMEIDA, F. A. F., et al. Synthesis and characterization of [11C]PK11195 as a PET
radiopharmaceutical. In: INTERNATIONAL NUCLEAR ATLANTIC CONFERENCE, 2017, Belo Horizonte.
[11] OLIVEIRA, K. E. M.; MALAMUT, C.; SILVEIRA, M. B.; GONTIJO, R.M.G. Aquisição e análise quantitativa de imagens PET em camundongos sadios utilizando o radiofármaco 11 C-Metionina. Curie&Roentgen. v. 2. p. 16, 2019.
[12] IAEA - International Atomic Energy Agency. PET/CT atlas on quality control and image artefacts. IAEA Human Health Series no 27 (2014).
[13] IAEA - International Atomic Energy Agency. Live Chart of Nuclides. https://www-nds.iaea.org/relnsd/vcharthtml/VChartHTML.html. 2020.
[14] GE Healthcare Technologies, “Triumph Service Guide Technical Publication”. Revision Draft 6, Copyright. http://www.gehealthcare.com 2011.
[15] Gamma Medica-Ideas. User Manual: Positron Emission Tomography (PET) Scanner Software - Manual for Acquisition and Processing of PET Images from the LABPET System. Software version: LABPET 1.12.0. 2010.
[16] TRETAULT, M. A. et al., System architecture of the LabPET small animal PET scanner.IEEE Transactions on Nuclear Science. v. 55. p. 2546-2550. 2008.
[17] FONTAINE, R. et al. The hardware and signal processing architecture of LabPETTM, a small animal APD-based digital PET scanner.IEEE Transactions on Nuclear Science, v. 56. p. 3-9, 2009.
[18] BELCARI, N. et al., NEMA NU-4 Performance Evaluation of the IRIS PET/CT Preclincial Scanner. IEEE Transactions on Nuclear Science. 2017. v. 1. p. 301-309. 2017.
[19] PMOD Tecnologies LCC, PMOD v.3.7. User Manual. 2015.
[20] Prasad et al., NEMA NU-04 based Performance Characteristics of the LabPET-8TM Small
![Table 1: Main physical, chemical and nuclear properties of 18 F and 11 C radionuclides [13]](https://thumb-eu.123doks.com/thumbv2/123dok_br/18275440.880987/3.892.78.826.743.848/table-main-physical-chemical-nuclear-properties-f-radionuclides.webp)