Received July 28, 2009 and accepted December 2, 2009. Corresponding author: altevir.signor@gmail.com
www.sbz.org.br
Growth performance and metabolic response of Nile tilapia fed rations
supplemented with autolized yeast and zinc
Altevir Signor1, Luiz Edivaldo Pezzato2, Pedro de Magalhães Padilha3, Carlos Roberto Padovani4, Margarida Maria Barros2
1Centro de Engenharias e Ciências Exatas da Unioeste/ Campus de Toledo-PR. 2Departamento de Melhoramento e Nutrição Animal - FMVZ - Unesp/Botucatu. 3Departamento de Bioquímica do Instituto de Biociências - IB - Unesp/Botucatu. 4 Departamento de Estatística do Instituto de Biociências - IB - Unesp/Botucatu.
ABSTRACT - This research evaluated the influence of yeast and zinc on growth performance and metabolic
responses of Nile tilapia. Diets were formulated to contain 32.0% digestible protein and 3,240 kcal DE/kg diet and
the following autolized yeast (%):zinc (mg/kg)relationships: 0.0:0.0; 0.0:79.5; 2.0:0.0; 0.795:79.5; 2.0:200; 4.0:400; 6.0:600; 12.0:1,200 and 14.0:1,400. It was used 135 fingerlings (7.27 ± 0.19 g), distributed in a complete random design in 27 50-L aquaria and they were fed ad libitum four times a day for 128 days. It was evaluated growth performance
and metabolic responses, weight gain, apparent feed conversion; protein efficiency and survival rate; percentage of protein, ether extract, dry weight and ashes in the muscle and in the bones; ammonia concentration and kinetic activity of alkaline phosphatase in the liver; ammonia, kinetic activity of alkaline phosphatase, urea and lipids in the plasma
and; minerals in plasma, in the liver and in the bones of the fish. High levels of yeast and zinc in the diet impaired growth performance and metabolic responses of the fish. Autolized yeast at the level of 2.0% determines the best growth performance. Levels higher than 6.0% of autolized yeast and 600 mg zinc in the diets impair growth performance and lipid metabolism in fish and levels higher than 4.0% of autolized yeast and 400 mg zinc/kg in the
diet impair mineral metabolism.
Key Words: fingerlings, growth, metabolism, metabolites, minerals
Desempenho produtivo e respostas metabólicas de tilápias-do-nilo
alimentadas com rações suplementadas com levedura autolisada e zinco
RESUMO - Avaliou-se a influência do uso de levedura e zinco no desempenho produtivo e no metabolismo de
tilápias-do-nilo. As dietas foram formuladas para conter 32,0% de proteína digestível e 3.240 kcal de energia digestível por kg de ração e as seguintes relações levedura autolisada (%): zinco (mg/kg): 0,0:0,0; 0,0:79,5; 2,0:0,0; 0,795:79,5; 2,0:200; 4,0:400; 6,0:600; 12,0:1.200 e 14,0:1.400. Utilizaram-se 135 alevinos distribuídos em delineamento inteiramente
casualizado (7,27 ± 0,19 g), em 27 aquários de 50 L e alimentados à vontade 4 vezes/dia, durante 128 dias. Foram avaliados o desempenho produtivo e as respostas metabólicas: ganho de peso, conversão alimentar aparente, eficiência proteica e taxa de sobrevivência; porcentagem de proteína, extrato etéreo, peso seco e conteúdo de cinzas no músculo e nos ossos;
concentração de amônia e atividade cinética da fosfatase alcalina no fígado; amônia, atividade cinética da fosfatase alcalina, ureia e lipídeos no plasma e; minerais no plasma, no fígado e nos ossos dos peixes. Elevados níveis de levedura e zinco na dieta prejudicaram o desempenho produtivo e as respostas metabólicas dos peixes. A suplementação de levedura
autolisada e zinco nas dietas melhora o desempenho produtivo e o metabolismo dos peixes. O nível de 2,0% de levedura autolisada é o que determina o melhor desempenho produtivo. Níveis superiores a 6,0% de levedura autolisada e 600 mg de zinco nas dietas prejudicam o desempenho produtivo e o metabolismo de lipídeos nos peixes e níveis superiores a 4,0% de levedura autolisada e 400 mg de zinco/kg de dieta prejudicam o metabolismo de minerais.
2561 Signor et al.
R. Bras. Zootec., v.39, n.12, p.2560-2568, 2010 Introduction
Diets which meet nutritional requirements and provide better health conditions are an important tool to prevent disease outbreaks and to improve production efficiency. Therefore, researches on diets aiming at improving them are worth studying.
Thus, yeast (Saccharomices cerevisiae) has been evaluated as a growth promoter in fish diets. Although yeast was used as protein source in fish diets in the last decade, its high nitrogen-free extract content (Butolo, 2002) and its deficiency in sulphur amino acids (Furuya et al., 2000) have made its inclusion unfeasible in fish diets. However, it showed promising results in growth improvement (Li & Gatlin III, 2003), health (Hisano et al., 2007ab) and immune response in fish (Li & Gatlin III, 2004) as a functional food. These additional properties enable yeast to be included in animal diets in lower levels.
Amongst some nutrients which have been studied aiming at improving fish health, zinc stands out for participating as co-factor of several enzymes (Glover & Hogstrand, 2002), besides of being part of bone structure (Sá et al., 2004), thus improving growth (Sá et al., 2005) and health condition (Henriques et al., 2003; Hisano et al., 2004). Accordingly, supplementation levels of this element must be strictly evaluated, because of the competition for the same membrane transporter among minerals with similar ionic potential. Furthermore, the presence of anti-nutrients may form complexes that make zinc unavailable (Sá et al., 2004). It should be emphasized that reduced or higher levels of minerals could affect homeostasis required for health maintenance and growth (Sá et al., 2005). Appropriate levels of minerals in diets not only improve animal welfare but they also prevent diseases (Breck et al., 2003).
This study aimed at evaluating growth performance and metabolic response of Nile tilapia fingerlings fed diets supplemented with autolised yeast and zinc.
Material and Methods
The experiment was carried out at Faculdade de Medicina Veterinária e Zootecnia, UNESP, Universidade Estadual Paulista, Câmpus de Botucatu, DMNA, AquaNutri. A 128-day trial was carried out to evaluate the effect of autolised yeast and zinc supplementation on growth performance and physiological status of Nile tilapia. Growth performance parameters, ammonia concentration and kinetic activity of alkaline phosphatase in the liver and in plasma and also urea and mineral concentration in plasma, liver and bones were evaluated.
The diets were formulated to meet nutritional requirement for this species (NRC, 1993) and digestible protein and digestible energy were calculated according to Furuya et al. (2001), Pezzato et al. (2002), Gonçalves et al. (2004, 2005), Hisano et al. (2008) and Guimarães et al. (2008ab). Diets were isonitrogenous (32% DP), isoenergetic (3.200 kcal DE/kg of diet) and they showed the same total calcium/available phosphorus ratio (Table 1). For diet preparation, ingredients were ground to sieve in a 0.5-mm mesh, weighed and manually homogenized. The mixture was extruded in a single screw laboratory extruder.
One hundred and thirty-five Nile tilapia fingerlings
(Oreochromis niloticus) with an average weight of 7.27 ±
0.19 g were randomly distributed into 27 rectangular 50-L aquaria in a five fish per tank density. The experimental design was completely randomized with eight diets containing different levels of autolised yeast (%) and zinc (mg/kg) (Yst;Zn) (0.0:79.5; 2.0:0.00; 2.0:200; 4.0:400; 6.0:600; 12.0:1200 and 14.0:1400) and a control diet with no supplementation. The supplementation 79.5 mg of zinc/kg diet without autolised yeast was in agreement to Sá et al. (2004). The 2.0% autolised yeast supplementation without zinc was based on the results obtained by Hisano et al. (2007). The zinc source was zinc heptahydrate sulphate, 21% purity.
Fish were fed ad libitum, four times a day at 8 a.m. and 11 a.m., at 2 p.m. and at 5 p.m. The cleaning of both biological filters and aquaria was performed when it was needed. Water temperature was thermostat-controlled and checked twice a day at 8 a.m. and 5 p.m. Aeration was maintained through an air blower.
All the fish were weighed at the beginning and at the end of the experiment. The growth performance parameters measured were weight gain, apparent feed intake, feed conversion ratio, protein efficiency ratio and survival rate. Before being weighed for growth performance evaluation, fish were anesthetized with benzocaine (100 mg/L). Blood was collected via caudal punction using a 1.0-mL syringe to obtain plasma. To determine plasma concentration of ammonia and minerals, EDTA (3.0%) was used as an anticoagulant agent and for total lipid, urea concentration and alkaline phosphatase kinetic activity in plasma, it was used heparin solution (100 IU/ml of 0.7% salt solution).
In order to determine ammonia concentration and alkaline phosphatase kinetic activity, fish were eviscerated and liver was removed and stored in liquid nitrogen (-70°C) for further analysis. For minerals analysis, bones of fish were extracted according to Mustin & Lovell (1992). These analyses were performed in a flame spectrophotometer (Sá et al., 2005), at Laboratório de Química do Instituto de Biociências, Unesp – Botucatu.
Ammonia analysis was performed according to Gentezkow & Masen (1942), utilizing Nessler reactive. For analyzing urea, it was used a calorimetry end-point by the method of dry chemistry in vitro by optical spectrophotometer
(Johnson & Johnson 950 Vitros Chemistry System) and
total lipid analysis was performed according to Tonks (1970). The mentioned evaluation was carried out at Laboratório de Análises Clinicas da Faculdade de Medicina, Unesp – Botucatu.
Alkaline phosphatase kinetic activity was measured in plasma and in the liver with a determination kit of fixed time kinetic method (Labtest
). Liver extracts were obtained by sample homogenization of wet weight (25 mg) in trichloroacetic acid solution and then followed by centrifugation 5000 rpm/15minutes.
Autolysed yeast and zinc supplementation level1
Ingredient 0.0:0.0 0.0:79.5 2.0:0.0 0.795:79.5 2.0:200 4.0:400 6.0:600 1 2 . 0 : 1 2 0 0 1 4 . 0 : 1 4 0 0
Soybean meal 5 8 . 5 0 5 8 . 5 0 5 8 . 0 0 5 8 . 0 0 5 7 . 0 0 5 6 . 0 0 5 4 . 5 0 4 8 . 0 0 4 5 . 0 0
Corn gluten 5 . 7 8 5 . 7 8 5 . 6 0 5 . 8 8 6 . 1 5 6 . 3 7 6 . 7 2 9 . 3 2 1 0 . 8 0
Corn meal 7 . 0 0 7 . 0 0 6 . 6 0 7 . 0 0 7 . 0 0 6 . 5 6 6 . 1 3 6 . 3 0 6 . 3 0
Wheat middlings 7 . 5 0 7 . 5 0 5 . 9 0 7 . 3 0 7 . 3 0 5 . 7 5 5 . 8 0 4 . 9 0 4 . 5 0
Broken rice 1 3 . 3 3 1 3 . 2 9 1 3 . 7 5 1 3 . 0 6 1 2 . 4 6 1 2 . 9 1 1 2 . 2 1 1 0 . 0 0 9 . 5 9
Autolysed yeast 0 . 0 0 0 . 0 0 2 . 0 0 0 . 8 0 2 . 0 0 4 . 0 0 6 . 0 0 1 2 . 0 0 1 4 . 0 0
Sodium chloride 0 . 5 0 0 . 5 0 0 . 5 0 0 . 5 0 0 . 5 0 0 . 5 0 0 . 5 0 0 . 5 0 0 . 5 0
Dicalcium phosphate 3 . 7 0 3 . 7 0 3 . 7 0 3 . 7 0 3 . 6 5 3 . 6 0 3 . 5 0 3 . 4 0 3 . 3 0
Zinc sulphate1 0 . 0 0 0 . 0 4 0 . 0 0 0 . 0 4 0 . 1 0 0 . 1 9 0 . 2 9 0 . 5 7 0 . 6 7
Cellulose 1 . 8 5 1 . 8 5 2 . 0 5 1 . 8 9 2 . 0 0 2 . 2 3 2 . 4 0 2 . 9 5 3 . 2 3
Soybean oil 0 . 6 0 0 . 6 0 0 . 6 7 0 . 6 0 0 . 6 0 0 . 6 5 0 . 6 4 0 . 5 9 0 . 5 6
L-lysine 0 . 3 0 0 . 3 0 0 . 3 0 0 . 3 0 0 . 3 0 0 . 3 0 0 . 3 0 0 . 3 7 0 . 4 2
DL-methionine 0 . 5 7 0 . 5 7 0 . 5 7 0 . 5 7 0 . 5 7 0 . 5 7 0 . 5 6 0 . 5 3 0 . 5 2
T r y p t o p h a n 0 . 0 0 0 . 0 0 0 . 0 0 0 . 0 0 0 . 0 0 0 . 0 0 0 . 0 0 0 . 0 5 0 . 0 6
T h r e o n i n e 0 . 2 5 0 . 2 5 0 . 2 5 0 . 2 5 0 . 2 5 0 . 2 5 0 . 2 5 0 . 2 5 0 . 2 5
Supplement
(mineral and vitamin)2 0 . 1 0 0 . 1 0 0 . 1 0 0 . 1 0 0 . 1 0 0 . 1 0 0 . 1 0 0 . 1 0 0 . 1 0
Antioxidant
(Butyl hydroxytoluene) 0 . 0 2 0 . 0 2 0 . 0 2 0 . 0 2 0 . 0 2 0 . 0 2 0 . 0 2 0 . 0 2 0 . 0 2
Nutrients
Gross energy
(analyzed amounts) (kcal/kg) 4 3 7 5 4 3 7 8 4 2 9 2 4 3 0 7 4 3 1 4 4 3 9 7 4 4 6 2 4 3 4 1 4 3 4 1 Digestible energy
(calculated amounts)3 (kcal/kg) 3 2 4 7 3 2 4 6 3 2 4 9 3 2 4 7 3 2 4 7 3 2 4 6 3 2 4 2 3 2 3 2 3 2 2 5
Crude protein
(analyzed amounts) (%) 3 9 . 3 7 3 7 . 4 7 3 6 . 6 4 3 7 . 4 9 3 7 . 4 6 3 6 . 5 3 3 7 . 6 2 3 9 . 2 6 3 7 . 9 8 Digestible protein
(calculated amounts)3 (%) 3 2 . 1 1 3 2 . 1 1 3 2 . 1 0 3 2 . 1 1 3 2 . 1 0 3 2 . 1 1 3 2 . 1 0 3 2 . 1 1 3 2 . 1 1
Ether extract (%) 1 . 0 8 1 . 0 3 1 . 0 5 1 . 2 1 1 . 0 6 1 . 1 3 1 . 0 7 1 . 0 5 1 . 0 0
Gross fiber (%) 7 . 5 3 7 . 4 7 7 . 4 0 6 . 9 3 6 . 5 9 7 . 4 2 6 . 8 4 6 . 9 4 7 . 9 5
Dry matter (%) 9 6 . 7 2 9 6 . 9 4 9 8 . 2 9 9 8 . 0 0 9 7 . 7 9 9 7 . 3 1 9 7 . 2 3 9 7 . 1 6 9 7 . 1 2
Mineral matter (%) 7 . 9 8 8 . 0 4 7 . 8 1 7 . 8 5 7 . 8 3 7 . 8 0 8 . 1 8 8 . 1 3 7 . 6 8
Zinc (mg/kg) 2 0 3 . 5 8 2 5 8 . 5 9 2 2 2 . 4 1 2 6 1 . 3 1 3 2 8 . 8 5 8 2 3 . 7 0 9 8 8 . 1 4 1,604.11 1,821.17 Calcium (mg/kg) 8 , 6 4 9 7 , 7 0 1 7 , 9 0 7 8 , 3 9 4 9 , 8 4 2 9 , 6 9 3 1 0 , 4 0 9 1 4 , 4 5 1 1 8 , 7 1 3 Phosphorus (mg/kg) 1 5 , 6 9 4 1 5 , 0 9 7 1 4 , 9 9 6 1 5 , 2 7 6 1 4 , 9 1 2 1 4 , 5 7 0 1 4 , 7 9 8 1 4 , 2 1 4 1 3 , 8 8 0 Magnesium (mg/kg) 8 , 2 1 9 7 , 8 7 0 7 , 8 7 8 7 , 6 3 3 7 , 8 0 2 8 , 1 9 7 8 , 1 8 8 8 , 8 9 6 1 6 , 7 6 4 Iron (mg/kg) 4 3 4 . 4 9 5 5 4 . 9 5 3 8 4 . 5 4 5 5 4 . 2 9 4 7 0 . 1 2 5 1 9 . 0 3 3 5 9 . 1 6 4 7 1 . 9 0 5 5 7 . 4 0
Table 1 - Diet and chemical composition of experimental diets supplemented with autolyzed yeast (%) and zinc (mg/kg), in dry matter basis
1Commercial source of zinc sulphate heptahydrated [ZnSO
4(7H2O)] commercial quality 21.0% of zinc.
2Mineral and vitamin supplement apart from zinc (SupreMais) (warranty levels measured by the kg of the product): vit. A = 1.200.000 IU; vit. D
3 = 200.000 IU; vit. E =
12.000 mg; vit. K3 = 2.400 mg; vit. B1 = 4.800 mg; vit. B2 = 4.800 mg; vit. B6 = 4.000 mg; vit. B12 = 4.800 mg; folic acid = 1.200 mg; calcium pantothenate = 12.000 mg;
vit. C = 48.000 mg; biotin = 48 mg; choline = 65.000 mg; niacin = 24.000 mg; iron = 10.000 mg; copper = 600 mg; manganese = 4.000 mg; iodine = 20.0 mg; cobalt = 2.0 mg and selenium = 20.0 mg.
3Values calculated upon the essays developed by Furuya et al. (2001), Pezzato et al. (2002), Gonçalves et al. (2004, 2005), Hisano et al. (2008) and Guimarães et al.
2563 Signor et al.
R. Bras. Zootec., v.39, n.12, p.2560-2568, 2010 The results were submitted to ANOVA and when
significant differences among treatments were observed, Tukey’s multiple range test was applied (P<0.05). For the metabolite variables, the non-parameter variation analysis was used complemented with DUNN’s range test. To compare periods, the PERFIL software was used (Rosa, 1994).
Results and Discussion
Parameters of water quality, such as temperature, pH, dissolved oxygen, ammonia and alkalinity were 26.47 ± 0.38°C; 7.43 ± 0.28; 5.13 ± 0.39 mg/L; 0.03 ± 0.05 mg/L; 0.5 ± 0.27 ppm; and 124.0 ± 2.68 mg/L, respectively. These results are in accordance with optimal development for Nile tilapia (Boyd, 1990).
Growth performance was affected by autolised yeast and zinc in diets (Table 2). The supplementation of autolised yeast together with zinc isolated or only one of the two affected fish growth. The best resulted was observed for fish fed diets supplemented with levels above 12.0Yst:1,200Zn. However, fish fed the 2.0Yst:0.0Zn diet showed the best results for weight gain (WG), feed conversion ratio (FCR), and protein efficiency ratio (PER), whereas fish fed diets containing 14.0Yst:1,400Zn had the poorest result.
The beneficial effect of these nutrients in fish metabolism seems to result in the best nutrient use with the inclusion levels of 2.0Yst:0.0Zn or supplementation with 0.0Yst:79.5Zn and 2.0Yst:200Zn. Feed and protein intake and survival rate did not present statistical differences.
The positive results may be associated with the improvement in fish physiology and metabolism. The results observed in protein efficiency ratio, feed conversion ratio and weight gain with the low dietary supplementation levels of yeast and zinc showed a possible improvement in nitrogen absorption and deposition of nitrogen. Dietary supplementation of autolised yeast and zinc showed a positive interaction for Nile tilapia (Hisano et al., 2004). However, high levels of yeast in diets (as protein source) impaired not only growth performance (Furuya et al., 2000; Baccarin & Pezzato, 2001) but also physiological status (Runsey et al., 1991; Li & Gatlin III, 2003), probably due to high levels of non-protein nitrogen (Li & Gatlin III, 2004; Li et al., 2005).
The results demonstrated that the inclusion of 2.0% autolised yeast in the diet increased ammonia concentration in plasma, which was inhibited or moderated when autolised yeast and zinc were supplemented together. Zinc, which is a growth promoter (Yamaguchi, 1998; Sá et al., 2004), may
have improved nitrogen metabolism (Sá et al., 2005) by increasing its body deposition and/or by ameliorating the metabolism and ammonia excretion. However, information regarding its participation in fish metabolism and in nitrogen deposition is limited.
The best protein efficiency ratio and growth performance resulted in the highest ammonia concentration in plasma of fish fed diets containing 2.0% of autolised yeast with no zinc supplementation. The results suggest a possible detrimental effect of yeast in the metabolism of fish fed diets supplemented with the highest levels of autolised yeast and zinc.
The chemical composition of muscle of fish (Table 2) showed that the protein and lipid content did not present significant variations according to dietary supplementation of autolised yeast and zinc, increasing dry matter and ash content. As for bones, the dry matter content did not change significantly and ash content varied according to the dietary autolised yeast and zinc supplementation. The multiple analyses of orthogonal contrast for autolised yeast inclusion and zinc levels were not different for growth performance and ash content, both in muscle and bones.
Lipid content in the muscle and lipid concentration in the plasma had a similar reduction according to dietary autolised yeast and zinc, which can be explained by the effect caused by zinc on lipid metabolism (Henriques et al., 2003; Mocchegiani et al., 2004), and fat deposition reduction. Similar results were described by Sá et al. (2004) who did not observe variations in lipid muscle content of fish fed diet supplemented with 0.0 to 400.0 mg zinc/kg diet. The same results were also demonstrated by Hisano et al. (2007a) when supplementation levels up to 3.0% of autolised yeast were used in Nile tilapia diet.
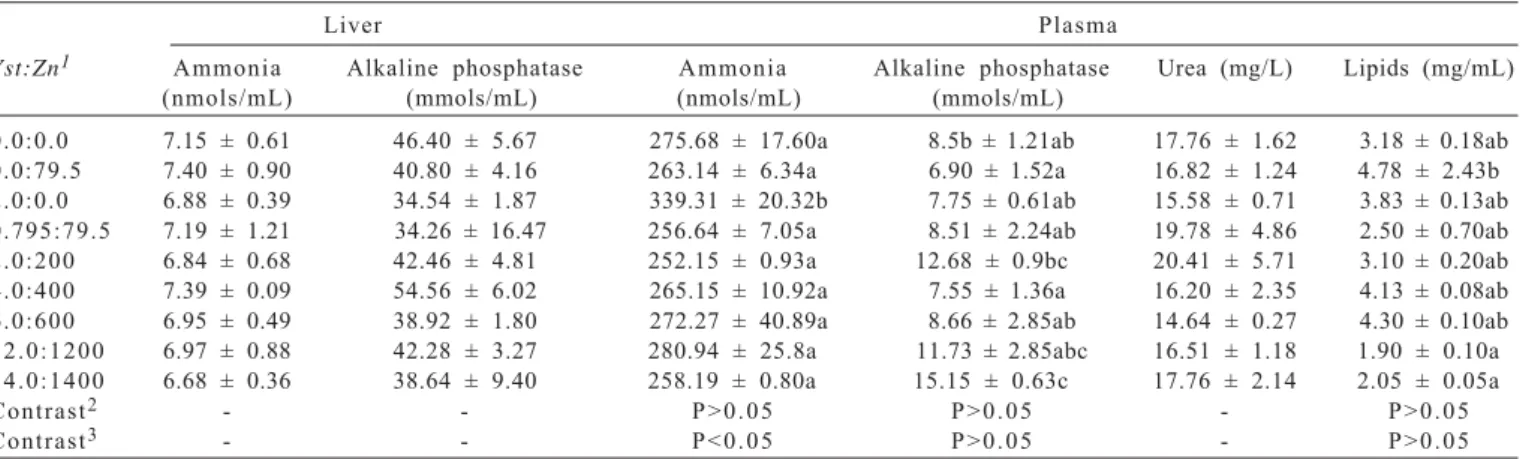
Ammonia concentration and kinetic activity of alkaline phosphatase in the liver and ammonia concentration, urea, lipids and kinetic activity of alkaline phosphatase in the plasma (Table 3) varied according to the different treatments. The evaluation of alkaline phosphatase activity in the plasma estimates the total activity of this enzyme, which depends on mineral metabolism in liver, intestine and bones (Vieira, 1999). The highest kinetic activity of alkaline phosphatase in the growing phase is a result of collagen production prior to bone mineralization (Steln & Lian, 1993). The alkaline phosphatase activity in bones and liver contributes with more than 90% of this enzyme activity, and for the intestine, the values are around 5%, which practically corresponds to the total circulating enzyme activity (Vieira, 1999).
Growth performance and metabolic response of Nile tilapia fed rations supplemented with autolized yeast and zinc
R. Bras. Zootec., v
.39, n.12, p.2560-2568, 2010
Variable 0.0:0.0 0.0:79.5 2.0:0.0 0.795:79.5 2.0:200 4.0:400 6.0:600 12.0:1200 14.0:1400 Contr1: Zinc Contr2: Lev
Initial average
weight (g) 7.12 ± 0.11 7.41 ± 0.23 7.39 ± 0.17 7.13 ± 0.11 7.23 ± 0.14 7.27 ± 0.30 7.21 ± 0.27 7.24 ± 0.18 7.21 ± 0.02 - -Average weight
gain (g/day) 0.88 ± 0.18ab 1.05 ± 0.15b 1.12 ± 0.06b 0.72 ± 0.17ab 1.05 ± 0.17b 0.97 ± 0.15ab 0.95 ± 0.10ab 0.74 ± 0.21ab 0.59 ± 0.17a P>0.05 P>0.05 Daily feed intake
(g/day) 5.63 ± 1.19 6.70 ± 0.88 6.60 ± 0.75 4.42 ± 1.00 6.41 ± 0.77 6.26 ± 0.59 6.14 ± 0.74 5.05 ± 0.99 4.35 ± 0.78 - -Feed conversion
ratio 1.25 ± 0.06ab 1.21 ± 0.05a 1.19 ± 0.33a 1.19 ± 0.07a 1.16 ± 0.04a 1.22 ± 0.08a 1.22 ± 0.06a 1.28 ± 0.08ab 1.39 ± 0.11b P>0.05 P>0.05 Daily protein intake
(g/day) 2.03 ± 0.43 2.29 ± 0.30 2.20 ± 0.25 1.51 ± 0.34 2.17 ± 0.26 2.07 ± 0.20 2.08 ± 0.25 1.78 ± 0.35 1.46 ± 0.26 - -Protein efficiency
ratio 2.22 ± 0.12ab 2.43 ± 0.10ab 2.52 ± 0.07b 2.47 ± 0.15ab 2.54 ± 0.09b 2.48 ± 0.16ab 2.43 ± 0.12ab 2.22 ± 0.15ab 2.15 ± 0.18a P>0.05 P>0.05 Survival rate (%) 86.67 ± 23.09 100.00 ± 0.00 93.33 ± 11.55 86.67 ± 23.09 100.00 ± 0.00 100.00 ± 0.00 100.00 ± 0.00 100.00 ± 0.00 93.33 ± 11.55 - -Muscle protein (%) 88.49 ± 2.59 90.82 ± 1.45 89.22 ± 0.64 89.63 ± 0.66 91.11 ± 0.83 90.22 ± 2.03 88.27 ± 1.31 89.60 ± 1.55 89.99 ± 0.78 - -Muscle ether
extract (%) 8.52 ± 2.47 6.62 ± 2.59 8.14 ± 1.30 6.57 ± 2.43 4.10 ± 0.95 6.23 ± 0.60 6.54 ± 1.47 4.70 ± 1.13 3.74 ± 1.23 - -Muscle dry
weight (%) 94.08 ± 0.04a 94.26 ± 0.16a 93.33 ± 0.05a 94.53 ± 0.07ab 93.90 ± 0.20a 94.59 ± 1.46ab 95.95 ± 0.37b 95.58 ± 0.05b 95.80 ± 0.37b - -Muscle ash (%) 4.63 ± 0.30a 4.67 ± 0.15a 4.64 ± 0.02a 4.89 ± 0.38ab 4.95 ± 0.04ab 4.78 ± 0.12ab 4.98 ± 0.13ab 5.23 ± 0.15b 5.19 ± 0.11b P>0.05 P>0.05 Bones dry
weight (%) 93.99 ± 0.43 94.65 ± 0.39 94.91 ± 0.05 94.49 ± 0.06 94.22 ± 0.20 94.42 ± 0.04 94.51 ± 0.24 93.80 ± 0.03 93.41 ± 1.25 - -Bone ashes (%) 70.92 ± 0.50ab 69.38 ± 0.60a 70.66 ± 0.03ab 71.20 ± 0.27b 70.90 ± 0.43ab 69.89 ± 0.03a 70.06 ± 0.17a 70.21 ± 0.02ab 70.60 ± 0.70ab P>0.05 P>0.05
2565 Signor et al.
R. Bras. Zootec., v.39, n.12, p.2560-2568, 2010 since it actively participates in mineral metabolism
(Seve et al., 2004; Zambuzzi et al., 2005), in the distribution of carrier proteins (Chimiente et al., 2004), in DNA and RNA polymerase-d and a, respectively (Lehninger et al., 1995; Falchuk, 1998). It is also involved in stabilization and expression of genes through transcription activity factors of DNA and RNA polymerase, in which zinc plays an important role in DNA repair and in cell apoptosis (Fachulk, 1998; Dreosti, 2001). This may improve protein synthesis and growth (Apines-Amar et al., 2004) and it also increases synthesis of IGF-1 and bone protein (Ma & Yamaguchi, 2001ab).
Literature reports that dietary mineral supplementation increases enzyme activity (Apines-Amar et al., 2004; Liao et al., 2006; Cho et al., 2006), which could also be observed in this study. However, the activity of alkaline phosphatase in the plasma of fish fed zinc non-supplemented diets was similar to the fish fed diet supplemented with 12.0Yst:1.200Zn. Therefore, the activity of alkaline phosphatase in plasma cannot be explained by the dietary zinc levels, thus suggesting that other factors may have influenced such response.
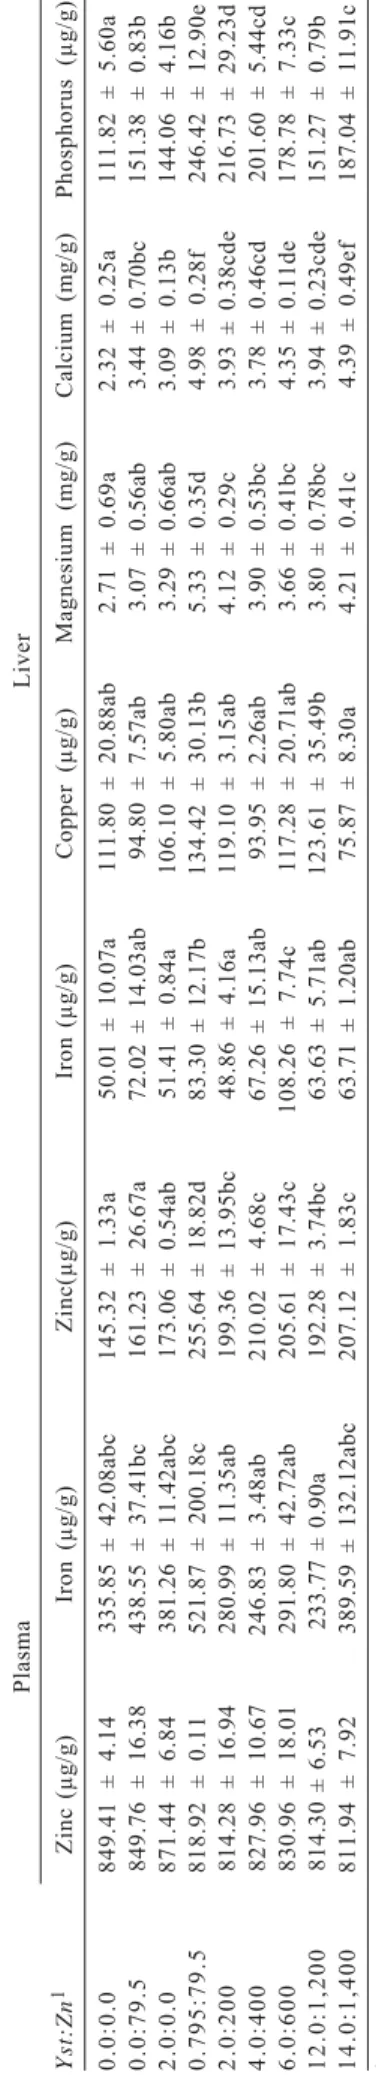
The results demonstrated that the supplementation of autolised yeast and zinc influenced mineral concentration, particularly zinc in the plasma and calcium in the liver and bones (Tables 4 and 5). The highest plasma concentration of iron was obtained in fish fed diet supplemented with 0.79Yst:79.5Zn and the lowest in fish fed 12.0Yst:1,200Zn
diet. A similar trend was observed for concentration of copper in the liver, with the highest concentration occurring in fish fed diets supplemented with 0.795Yst:79.50Zn and the lowest with diets containing 14.0Yst:1,400Zn.
Contrary to what was observed in the liver of fish, neither plasma nor bones had increased concentrations of zinc. However, according to Sá et al. (2005), liver presents a high zinc turnover, adjusting the absorption and the distribution of this mineral in the organism, by means of proteins and enzymes called zinc metallothionein and zinc metalloenzymes (Henriques & Cozzolino, 2001; Glover & Hogstrand, 2002).
By evaluating the concentrations of zinc and iron in the plasma, liver and bones of fish, it is possible to infer that there is an antagonic action of zinc and iron. This could be observed in the mineral concentration in bones, since higher levels of autolised yeast and zinc supplementation (6.0Yst:600Zn; 12.0Yst:1.200Zn and 14.0Yst:1.400Zn) significantly reduced iron concentration in bones. However, it could not be observed in the plasma and liver. This response may be explained by the fact that compounds in the plasma did not represent the organism reserve. The same can also happen with iron in the liver since it is strongly demanded in hemoglobin synthesis (Feldman et al., 2000; Barros et al., 2002).
Similarly, concentration of copper in liver and bones was influenced by yeast and zinc supplementation, although it did not reflect a linear response. The lowest concentrations of copper were both in the liver and in bones of fish fed the highest yeast and zinc concentration. In the bones, the highest cooper concentration was determined in fish fed diets supplemented with 2.0Yst:0.0Zn. The direct correlation between copper (80.0 mg/kg of diet) and zinc concentration in liver was reported by Ferrari et al. (2004) for Nile tilapia. The relationship between these minerals can be explained by the manner that divalent cations are absorbed,
Liver Plasma
Yst:Zn1 Ammonia Alkaline phosphatase Ammonia Alkaline phosphatase Urea (mg/L) Lipids (mg/mL)
(nmols/mL) (mmols/mL) (nmols/mL) (mmols/mL)
0.0:0.0 7.15 ± 0.61 46.40 ± 5.67 275.68 ± 17.60a 8.5b ± 1.21ab 17.76 ± 1.62 3.18 ± 0.18ab
0.0:79.5 7.40 ± 0.90 40.80 ± 4.16 263.14 ± 6.34a 6.90 ± 1.52a 16.82 ± 1.24 4.78 ± 2.43b
2.0:0.0 6.88 ± 0.39 34.54 ± 1.87 339.31 ± 20.32b 7.75 ± 0.61ab 15.58 ± 0.71 3.83 ± 0.13ab
0.795:79.5 7.19 ± 1.21 34.26 ± 16.47 256.64 ± 7.05a 8.51 ± 2.24ab 19.78 ± 4.86 2.50 ± 0.70ab
2.0:200 6.84 ± 0.68 42.46 ± 4.81 252.15 ± 0.93a 12.68 ± 0.9bc 20.41 ± 5.71 3.10 ± 0.20ab
4.0:400 7.39 ± 0.09 54.56 ± 6.02 265.15 ± 10.92a 7.55 ± 1.36a 16.20 ± 2.35 4.13 ± 0.08ab
6.0:600 6.95 ± 0.49 38.92 ± 1.80 272.27 ± 40.89a 8.66 ± 2.85ab 14.64 ± 0.27 4.30 ± 0.10ab
1 2 . 0 : 1 2 0 0 6.97 ± 0.88 42.28 ± 3.27 280.94 ± 25.8a 11.73 ± 2.85abc 16.51 ± 1.18 1.90 ± 0.10a
1 4 . 0 : 1 4 0 0 6.68 ± 0.36 38.64 ± 9.40 258.19 ± 0.80a 15.15 ± 0.63c 17.76 ± 2.14 2.05 ± 0.05a
Contrast2 - - P > 0 . 0 5 P > 0 . 0 5 - P > 0 . 0 5
Contrast3 - - P < 0 . 0 5 P > 0 . 0 5 - P > 0 . 0 5
1Autolised yeast levels in percentage rate and zinc in mg/kg in diet.
2Orthogonal contrast among the levels (0.0:79.5 × 0.795:79.5+2.0:200+4.0:400+6.0:600+12.0:1200+14.0:1400, Yst:Zn) of zinc supplementation in diets. 3Orthogonal contrast among the levels (2.0:0.0 × 0.795:79.5 + 2.0:200 + 4.0:400 + 6.0:600 + 12.0:1200 + 14.0:1400, Yst:Zn) of autolised yeast supplementation in diet. *Means in columns followed by different letters statistically differ (P<0.05) by Tukey test.
which is similar to theirs (Rutherford & Bird, 2004). Thus, zinc and copper use the same intracellular transporters to enter into the cell (Glover & Hogstrand, 2003). However, the resulting metabolic processes are different, showing negative and positive interactions, depending on the concentrations in the diet (Sandströn, 2001).
Higher oscillation was observed in concentrations of magnesium and calcium in the liver. These results emphasize those obtained by Sá et al. (2004, 2005), although they do not show a clear relationship between these minerals with yeast and zinc supplementation. For phosphorus concentration in the liver and in the bones, it occurred some differences among treatments with the lowest values obtained in fish fed non-supplemented diet (0.0Yst:0.0Zn) and the highest for fish fed diet supplemented with 0.795Yst:79.50Zn.
Although literature reported a possible antagonic effect among bivalent minerals (Sandströn, 2001), the increase in magnesium concentrations in the liver and the oscillation in bones concentration does not characterize an effect adverse from test ingredients, mainly zinc to magnesium. Positive effect on magnesium concentration in the liver was observed although literature has not reported it. Calcium evaluation did not show any direct relationship with dietary supplementation; however, it showed a linear increasing trend depending on the dietary supplementation. Similar values of calcium in the liver were also described for Nile tilapia by Sá et al. (2004). These authors described an increase in calcium concentration in meat and bones, which was not observed in this study. Instead, calcium concentration in the bones was constant.
Phosphorus concentration in liver was responsive to the supplementation of test ingredients in diet. However, did not show any linear pattern, although the highest value has been observed in fish fed the highest supplementation levels (14Yst:1.400Zn). Comparable results were observed in fish bones. Similar to calcium, autolised yeast in the diet possibly increased phosphorus absorption and may have resulted in a higher concentration in the liver.
Conclusions
Supplementation of autolised yeast and zinc in diets improves fish growth performance and metabolism: 2.0% autolised yeast determines a better growth performance; levels up to 6.0% of autolised yeast and 600 mg of zinc/kg in diets impair growth performance and lipid metabolism; levels up to 2.0% of autolised yeast and 200 mg of zinc/kg diet impair mineral metabolism.
Plasma Liver Yst:Zn 1 Zinc ( μ g/g) Iron ( μ g/g) Zinc( μ g/g) Iron ( μ g/g) Copper ( μ g/g) Magnesium (mg/g) Calcium (mg/g) P hosphorus ( μ g/g) 0.0:0.0
849.41 ± 4.14
335.85 ± 42.08abc
145.32 ± 1.33a
50.01
±
10.07a
111.80 ± 20.88ab
2.71 ± 0.69a
2.32 ± 0.25a
111.82 ± 5.60a
0.0:79.5 849.76 ± 16.38 438.55 ± 37.41bc 161.23 ± 26.67a
72.02 ± 14.03ab
94.80 ± 7.57ab
3.07
±
0.56ab
3.44 ±
0.70bc
151.38 ± 0.83b
2.0:0.0
871.44 ± 6.84
381.26 ± 11.42abc
173.06
±
0.54ab
51.41 ± 0.84a
106.10 ± 5.80ab
3.29 ± 0.66ab
3.09
±
0.13b
144.06 ± 4.16b
0.795:79.5
818.92 ± 0.11
521.87 ± 200.18c
255.64
±
18.82d
83.30 ± 12.17b
134.42 ± 30.13b
5.33 ± 0.35d
4.98
±
0.28f
246.42 ± 12.90e
2.0:200 814.28 ± 16.94 280.99 ± 11.35ab
199.36 ± 13.95bc
48.86 ± 4.16a
119.10 ± 3.15ab
4.12 ± 0.29c
3.93
±
0.38cde
216.73 ± 29.23d
4.0:400
827.96 ± 10.67
246.83 ± 3.48ab
210.02 ± 4.68c
67.26 ± 15.13ab 93.95 ± 2.26ab
3.90 ± 0.53bc
3.78 ± 0.46cd
201.60 ± 5.44cd 6.0:600 830.96 ± 18.01
291.80 ± 42.72ab
205.61
±
17.43c
108.26 ± 7.74c
117.28
±
20.71ab
3.66 ± 0.41bc
4.35 ± 0.11de
178.78 ± 7.33c
12.0:1,200
814.30 ± 6.53 233.77 ± 0.90a
192.28 ± 3.74bc 63.63 ± 5.71ab
123.61 ± 35.49b
3.80 ± 0.78bc
3.94
± 0.23cde
151.27 ± 0.79b
14.0:1,400
811.94 ± 7.92
389.59 ± 132.12abc
207.12 ± 1.83c
63.71 ± 1.20ab
75.87 ± 8.30a
4.21 ± 0.41c
4.39
±
0.49ef
187.04 ± 11.91c
1Autolised yeast levels in a percentage rate and zinc in mg/kg of diets. *Averages in the columns followed by different letters differ (P<0.05) by Tukey test.
Table 4 - Mineral concentration in the plasma of Nile tilapia fed diets supplemented with autolised yeast (
Yst
) and zinc (
Zn
2567 Signor et al.
R. Bras. Zootec., v.39, n.12, p.2560-2568, 2010 Acknowledgments
For FAPESP - Fundação de Amparo à Pesquisa do Estado de São Paulo, for financial support and to Usina São Luis for scientific support.
References
ASSOCIATION OF OFFICIAL AGRICULTURAL CHEMISTS -AOAC. Official methods of analysis. 12.ed. Washington, D.C.: 2000. 2200p.
APINES-AMAR, M.J.S.; SATOH, S.; CAIPANG, C.M.A. et al. Amino acid-chelate: a better source of Zn, Mn and Cu for rainbow trout, Oncorhynchus mykiss. Aquaculture, v.240, p.345-358, 2 0 0 4 .
BACCARIN, A.E.; PEZZATO, L.E. Efeito da levedura desidratada d e á l c o o l e m d i e t a s p a r a t i l á p i a d o N i l o . Pesquisa
Agropecuária Brasileira, v.36, p.549-556, 2001.
BARROS, M.M.; PEZZATO, L.E.; KLEEMANN, G.K. et al. Níveis de vitamina C e ferro para a tilápia do Nilo (Oreochromis
niloticus). Revista Brasileira de Zootecnia, v.31, p.3447-3455,
2 0 0 2 .
BOYD, C. Water quality in ponds for aquaculture. Alabama: Birmingham Publiscing, 1990. 482p.
B R E C K , O . ; B J E R K A S , E . ; C A M P B E L L , P. e t a l . C a r a c t preventative role of mammalian blood neal, histidine, iron and zinc in diets for Atlantic salmon (Salmo salar L.) of diferent strains. Aquaculture Nutrition, v.9, p341-350, 2003. BUTOLO, J.E. Qualidade de ingredientes na alimentação
animal. Campinas: Colégio Brasileiro de Nutrição Animal, 2002.
4 3 0 p .
CHO, Y.S.; CHOI, B.N.; KIM, K.H. et al. Differential expression of Cu/Zn superoxide dismutase mRNA during exposures to heavy metals in rockbream (Oplegnathus fasciatus). Aquaculture, v.253, p.667-679, 2006.
CHIMIENTI, F.; DERGNAS, S.; FAVIER, A. et al. Identification a n d C l o n i n g o f a b - c e l l - s p e c i f i c z i n c t r a n s p o r t e r, Z n T- 8 , l o c a l i z e d i n t o i n s u l i n s e c r e t o r y g r a n u l e s . D i a b e t s, v. 5 3 , p.2330-2337, 2004.
DREOSTI, I.E. Zinc and the gene. Mutat Research, v.18, n.1-2, p.161-167, 2001.
FALCHUK, K.H. The molecular basis for the role of zinc in developmental biology. Molecular Cellular Biochemistry, v.188, p.41-48, 1998.
FELDMAN, B.F.; ZINKL, J.G.; JAIN, N.C. Schalm’s veterinary hematology. 5.ed. Filadélfia, 2000. p.439
FERRARI, J.E.C.; BARROS, M.M.; PEZZATO, L.E. et al. Níveis de cobre em dietas para a tilápia do Nilo, Oreochromis niloticus. Acta Scientiarum, v. 2 6 , n . 4 , p . 4 2 9 - 4 3 6 , 2 0 0 4 .
FURUYA, W.M.; SERON, S.; VARGAS, L. Níveis de levedura desidratada spray dried na dieta de alevinos de tilápia do N i l o (O re o c h ro m i s n i l o t i c u s) . C i ê n c i a R u r a l, v. 3 0 , n . 4 , p . 6 9 9 - 7 0 4 , 2 0 0 0 .
F U R U YA , W. M . ; P E Z Z AT O , L . E . ; P E Z Z AT O , A . C . e t a l . C o e f i c i e n t e s d e d i g e s t i b i l i d a d e e v a l o r e s d e a m i n o á c i d o s d i g e s t í v e i s d e a l g u n s i n g r e d i e n t e s p a r a T i l á p i a d o N i l o
(Oreochromis niloticus). Revista Brasileira de Zootecnia,
v. 3 0 , p . 11 4 3 - 11 4 9 , 2 0 0 1 .
GENTZKOW, C.J.; MASEN, J.M. Na accurate method for the determination of blood urea nitrogen by direct Nesslerization.
Journal of Biological Chemistry, v.143, p.531-544, 1942.
GLOVER, C.N.; HOGSTRAND, C. In vivo characterisation of intestinal zinc uptake in freshwater rainbow trout. Journal of Experimental Biology, v. 2 0 5 , p . 1 4 1 - 1 5 0 , 2 0 0 2 . GLOVER, C.N.; HOGSTRAND, C. Effects of dissolved metals
and other hydrominerals on in vivo intestinal zinc uptake i n f r e s h w a t e r r a i n b o w t r o u t . A q u a t i c To x i c o l o g y, v. 6 2 , p . 2 8 1 - 2 9 3 , 2003.
G O N Ç A LV E S , G. S . ; P E Z Z ATO , L . E . ; B A R R O S , M . M . e t a l . D i g e s t i b i l i d a d e a p a r e n t e e s u p l e m e n t a ç ã o d e f i t a s e e m alimentos vegetais para a tilápia do Nilo. Acta Scientiarum, v.26, n.3, p.313-321, 2004.
G O N Ç A LV E S , G. S . ; P E Z Z ATO , L . E . ; B A R R O S , M . M . e t a l . Efeitos da suplementação de fitase sobre a disponibilidade aparente de Mg, Ca, Zn, Cu, Mn e Fe em alimentos vegetais para a tilápia do Nilo. Revista Brasileira de Zootecnia, v.34, n.6, p.2155-2163, 2005.
G U I M A R Ã E S , I . G. ; P E Z Z ATO , L . E . ; B A R R O S , M . M . e t a l . Nutrient digestibility of cereal grain products and by-products i n e x t r u d e d d i e t s f o r n i l e t i l a p i a . J o u r n a l o f t h e Wo r l d Aquaculture Society, v. 3 9 , n . 6 , p . 7 8 1 - 7 8 9 , 2 0 0 8 a . GUIMARÃES, I.G.; PEZZATO, L.E.; BARROS, M.M. Amino
acid availability and protein digestibility of several protein sources for Nile tilapia, Oreochromis niloticus. Aquaculture Nutrition, v. 1 4 , p . 3 9 6-404, 2008b.
HENRIQUES, G.S.; HIRATA, M.H.; COZZOLINO, S.M.F. Aspectos recentes da absorção e biodisponibilidade do zinco e suas correlações com a fisiologia da isoforma testicular da enzima conversora de angiotensina. Revista de Nutrição, v.16, n.3, p.333-345, 2003.
H E N R I Q U E S , G. S . ; C O Z Z O L I N O , S . M . F. D e t e r m i n a t i o n o f metallothionein levels in tissues of yong rats fed zinc-enriched diets. Revista de Nutrição, v.14, n.3, p.163-169, 2001. HISANO, H.; SOLARTE, W.N.; BARROS, M.M. et al. Desempenho
produtivo de alevinos de tilápia-do-nilo alimentados com levedura e derivados. Pesquisa Agropecuária Brasileira, v.42, p.1035-1042, 2007a.
H I S A N O , H . ; B A R R O S , M . M . ; P E Z Z ATO , L . E . L e v e d u r a desidratada de álcool e zinco como pró-nutrientes em rações para tilápia do nilo: aspectos hematológicos. Boletim do
Instituto de Pesca, v.33, p.35-42, 2007b.
Yst:Zn1 Zinc (mg/g) Iron (μg/g) Copper (μg/g) Magnesium (mg/g) Calcium (mg/g) Phosphorus (mg/g)
0.0:0.0 1.20 ± 0.37b 156.23 ± 19.34bcd 248.84 ± 26.62b 31.58 ± 0.90a 255.67 ± 3.78 47.54 ± 9.22a 0.0:79.5 1.18 ± 0.33b 145.02 ± 5.15bc 137.01 ± 13.74a 31.45 ± 0.39a 252.34 ± 25.78 66.85 ± 7.05abc 2.0:0.0 1.08 ± 0.29a 152.00 ± 19.42bc 421.11 ± 29.86c 29.92 ± 1.44ab 274.33 ± 4.21 56.79 ± 18.87ab 0.795:79.5 1.18 ± 0.50b 157.91 ± 7.71bcd 208.67 ± 1.13b 31.42 ± 0.52a 255.07 ± 15.46 89.28 ± 7.81bc 2.0:200 1.13 ± 0.16ab 159.03 ± 11.22cd 254.07 ± 56.67b 30.20 ± 0.71ab 272.86 ± 1.84 65.94 ± 24.51abc 4.0:400 1.07 ± 0.57a 182.19 ± 4.98d 116.87 ± 16.48a 31.34 ± 0.81a 263.52 ± 11.01 81.98 ± 9.90bc
6.0:600 1.15 ± 0.41b 118.23 ± 12.54a 86.38 ± 3.68a 29.43 ± 0.54b 262.53 ± 1.70 93.72 ± 20.05c
1 2 . 0 : 1 2 0 0 1.17 ± 0.13b 116.09 ± 0.84a 205.41 ± 6.56b 30.55 ± 0.36ab 255.22 ± 4.12 60.46 ± 6.88abc 1 4 . 0 : 1 4 0 0 1.19 ± 0.29b 132.09 ± 0.23ab 124.51 ± 3.58a 30.30 ± 0.35ab 260.41 ± 9.63 163.61 ± 13.87d
Table 5 - Mineral concentration in the bones of Nile tilapia fingerling fed diets supplemented with autolised yeast (Yst) and zinc (Zn) for 128 days
1Autolised yeast levels in a percent rate and zinc in mg/kg of diet.
HISANO, H.; SAMPAIO, F.G.; BARROS, M.M. et al. Composição nutricional e digestibilidade aparente da levedura íntegra, da levedura autolisada e da parede celular pela tilápia-do-nilo.
Ciência Animal Brasileira, v.9, n.1, p.43-49, 2008.
HISANO, H.; PEZZATO, L.E.; BARROS, M.M. et al. Zinco e levedura desidratada de álcool como pró-nutrientes para alevinos de tilápia do Nilo (Oreochromis niloticus). Acta Scientiarum, v.26, n.2, p.171-179, 2004.
LEHNINGER, A.L.; NELSON, D.L.; COX, M.M. Princípios de
bioquímica. 2.ed. Trad. Simões A.A.; Lodi, W.R.N. São Paulo:
Sarvier, 1995.
LIAO, H.J.; CHEN, Y.H.; JENG, S.S. Association of zinc with c o n n e c t i v e t i s s u e i n t h e d i g e s t i v e t r a c t o f c o m m o n c a r p .
Fisheries Science, v.72, p.893-902, 2006.
LI, P.; BURR, G.S.; WHITEMAN, K.W. et al. A preliminar study on the effects of dietary supplementation of brewers yeast and nucleotides, singular or in combination, on juvenile red drum
(Sciaenops ocellatus). Aquaculture Research, p.1-8, 2005.
L I , P. ; G AT L I N I I I , D . M . E v a c u a t i o n o f b r e w e r s y e a s t
(Saccharomyces cerevisiae) as a feed supplement for hybrid
striped bass (Morone chrysops X M. saxatilis). Aquaculture, v.219, p.681-692, 2003.
LI, P.; GATLIN III, D.M. Dietary brewers yeast and the prebiotic G r o b i o t i c ™ A E i n f l u e n c e g r o w t h p e r f o r m a n c e , i m m u n e r e s p o n s e s a n d r e s i s t a n c e o f h y b r i d s t r i p e d b a s s (M o r o n e
c h r y s o p s × M . s a x a t i l i s) t o S t r e p t o c o c c u s i n i a e i n f e c t i o n .
Aquaculture, v.231, p.445-456, 2004.
MA, Z.J.; YAMAGUCHI, M. Role of endogenous zinc in the enhancement of bone protein synthesis associated with bone growth of newborn rats. Journal Bone Mineral Metabolits, v.19, p.38-44, 2001a.
MA, Z.J.; YAMAGUCHI, M. Stimulatory effect of zinc and growth factor on bone protein component in newborn rats: enhancement with zinc and insulin-like growth factor I. International
Journal Molecular Medicine, v.7, p.73-78, 2001b.
MOCCHEGIANI, E.; GIACCONI, R.; CIPRIANO, C. et al. Are zinc-bound metallothionein isoforms (I+II and III) involved in impaired thymulin production and thymic involution during ageing. Immunity & Ageing, v.1, n.5, p.1-7, 2004. MUSTIN, W.G.; LOVELL, R.T. Na-L-Ascorbyl-2-monophosphate
as a source of vitamin C for channel catfish. Aquaculture, v.105, p.95-110, 1992.
NATIONAL RESEARCH COUNCIL - NRC. Nutrient requeriments
of fish. Washington, D.C.: National Academy of Science, 1993.
1 1 4 p .
P E Z Z ATO , L . E . ; M I R A N D A , E . C . ; B A R R O S , M . M . e t a l . Digestibilidade aparente de ingredientes pela tilápia do Nilo
(Oreochromis niloticus). Revista Brasileira de Zootecnia,
v.31, n.4, p.1595-1604, 2002.
PEZZATO, L.E.; MENEZES, A.; MARROS, M.M. et al. Levedura em dietas para alevinos de tilápia do Nilo. Veterinária e
Zootecnia, v.13, n.1, p.84-94, 2006.
ROSA, G.J.M. Desenvolvimento de aplicativo para análises de
perfil na experimentação zootécnica. 1994 72f. Dissertação
( M e s t r a d o e m Z o o t e c n i a : N u t r i ç ã o e P r o d u ç ã o A n i m a l ) – Universidade Estadual Paulista.
RUMSEY, G.L.; KINSELLA, J.E.; SHETTY, K.J. et al. Effect of high dietary concentrations of brewer’s dried yeast on growth performance and liver uricase in rainbow trout (Oncorhynchus
m y k i s s) . A n i m a l F e e d S c i e n c e a n d Te c h n o l o g y, v. 3 3 ,
p.177- 183, 1991.
RUTHERFORD, J.C.; BIRD, A.J. Metal-responsive transcription factors that regulate iron, zinc, and copper homeostasis in eukaryotic cells. Eukaryotic cell, v.3, n.1, p.1-13, 2004. SÁ, M.V.C.; PEZZATO, L.E.; BARROS, M.M. et al. Optimum
z i n c s u p p l e m e n t a t i o n l e v e l i n N i l e t i l a p i a O r e o c h r o m i s
niloticus juveniles diets. Aquaculture, v.238, p.385-401,
2 0 0 4 .
SÁ, M.V.C.; PEZZATO, L.E.; BARROS, M.M. et al. Relative bioavailability of zinc in supplemental inorganic and organic sources for Nile tilapia Oreochromis niloticus fingerlings.
Aquaculture Nutrition, v.11, p.273-281, 2005.
SANDSTRÖM, B. Nicronutrient interactions: effects on absorption and bioavailability. British Journal of Nutrition, v.85, p.181-185, sup.2, 2001.
SEVE, M.; CHIMIENTI, F.; DEVERGNAS, S. et al. In silicio identification and expression of SLC30 family genes: An e x p r e s s e d s e q u e n c e t a g d a t a m i n i n g s t r a t e g y f o r t h e characterization of zinc transporters tissue expression. BMC
Genomics, v.5, n.32, p.1-9, 2004.
STELN, G.S.; LIAN, J.B. Molecular mechanisms mediating proliferation/differentiation interrelationships during progressive development of the osteoblast phenotype. Endocrinology
Review, v.14, p.424-442, 1993.
TONKS, D.B. Quality control in clinical laboratories diagnostic
reagents. Ontario: Copyright, 1970. 370p.
VIEIRA, J.G.H. Considerações sobre marcadores bioquímicos do m e t a b o l i s m o ó s s e o e s u a u t i l i d a d e p r á t i c a . A r q u i v o B r a s i l e i r o d e E n d o c r i n o l o g i a M e t a b ó l i c a, v. 4 3 , n . 6 , p . 4 1 5 - 4 2 2 , 1 9 9 9 .
YAMAGUSHI, M. Role of zinc in bone formation in bon resorption.
Journal Trace Elemental Experience Medicine, v.11,
p.119-135, 1998.
ZAMBUZZI, W.F.; NEVES, M.C.M.; OLIVEIIRA, R.C. et al. Reação tecidual e perfil de fosfatases após o implante de matriz óssea desmineralizada xenogênica em músculo de ratos. Ciencia