Revista Brasileira de
Engenharia Agrícola e Ambiental
Campina Grande, PB, UAEA/UFCG – http://www.agriambi.com.br
v.20, n.1, p.55–61, 2016
Cultivation of cherry tomato under irrigation
with saline water and nitrogen fertilization
Ianne G. S. Vieira
1, Reginaldo G. Nobre
2, Adaan S. Dias
3& Francisco W. A. Pinheiro
2 DOI: http://dx.doi.org/10.1590/1807-1929/agriambi.v20n1p55-61A B S T R A C T
The study was carried out from August 2013 to January 2014 to evaluate growth and production of cherry tomato cultivated under irrigation with water of different salinity levels and fertilized with different nitrogen (N) doses, in experiment conducted in drainage lysimeters under greenhouse conditions, at the Center for Agrifood Science and Technology of the Federal University of Campina Grande. The statistical design was randomized blocks in a 5 x 4 factorial scheme, with three replicates, and the treatments consisted of five levels of electrical conductivity of water (0.3, 1.5, 2.5, 3.5 and 4.5 dS m-1) and four N doses (60, 100, 140 and 180 mg kg-1). Growth and production variables of cherry tomato decrease linearly from the irrigation water salinity of 0.3 dS m-1 on. The longer exposure of plants to salt stress caused the highest reductions, and the root dry matter, leaf area and the number of clusters are the most sensitive variables. The highest value of plant height at 125 days after transplantation was obtained with the N dose of 139 mg kg-1 of soil. Increasing N doses reduced the effect of salinity on cherry tomato growth at 125 days after transplantation.
Cultivo do tomateiro cereja sob irrigação
com águas salinas e adubação nitrogenada
R E S U M O
Este trabalho foi desenvolvido entre agosto de 2013 e janeiro de 2014 objetivando avaliar o crescimento e a produção do tomateiro cereja cultivado sob irrigação com águas salinas e adubado com distintas doses de nitrogênio em ensaio conduzido em lisímetros de drenagem sob condições de casa de vegetação da UFCG, Pombal-PB. O delineamento estatístico utilizado foi o de blocos ao acaso, em arranjo fatorial 5 x 4, com três repetições cujos tratamentos constaram de cinco níveis de condutividade elétrica da água (0,3; 1,5; 2,5; 3,5 e 4,5 dS m-1) e quatro doses de N (60, 100, 140 e 180 mg kg-1). As variáveis de crescimento e
produção do tomateiro cereja decrescem de forma linear a partir da salinidade da água de irrigação 0,3 dS m-1; o maior tempo de exposição das plantas ao estresse salino ocasionou as maiores reduções sendo a massa das raízes, a área foliar e o número de cachos as variáveis mais sensíveis; a maior altura de planta aos 125 dias após o transplantio foi obtida com dose de N de 139 mg kg-1 de solo; doses crescentes de nitrogênio reduziram o efeito da salinidade sobre o crescimento do tomateiro cereja, aos 125 dias após o transplantio.
Key words:
Lycopersicon esculentum Mill. salt stress
mineral nutrition growth
Palavras-chave:
Lycopersicon esculentum Mill. estresse salino
nutrição mineral crescimento
1 Universidade Federal de Campina Grande/Centro de Ciências e Tecnologia Agroalimentar/Programa de Pós-Graduação em Horticultura Tropical.
Pombal, PB. E-mail: [email protected] (Corresponding author)
2 Universidade Federal de Campina Grande/Centro de Ciências e Tecnologia Agroalimentar/Unidade Acadêmica de Ciências Agrárias. Pombal, PB.
E-mail: [email protected]; [email protected]
3 Universidade Federal de Campina Grande/Centro de Tecnologia e Recursos Naturais/Programa de Pós-Graduação em Engenharia Agrícola.
Campina Grande, PB. E-mail: [email protected]
Introduction
Tomato (Lycopersicon esculentum Mill.), originated in South America, is cultivated in almost the entire world and its global production has doubled in the last twenty years. One of the main factors for the expansion of this crop is the increase in its consumption. From 1985 to 2005, the global production increased from 14 to 19 kg person-1 year-1, and it is one of the
most cultivated vegetables in Brazil (Prado et al., 2011). Sustainable agricultural exploitation in arid and semi-arid regions depends, due to the climatic instability, among other practices, on the use of irrigation. However, because of the anthropic pressure for good-quality waters and the increasing need for expansion of agricultural production worldwide, the use of waters considered as of low quality has increased (Nobre et al., 2011).
The use of low-quality water in arid and semi-arid regions has generated various environmental problems, such as soil salinization, because their water sources normally have high contents of salts (Rhoades et al., 1992). For Leite et al. (2007), the use of saline water in agricultural exploitation is susceptible to the tolerance of crops to salinity and to management practices of irrigation and fertilization, which must avoid as much as possible the impacts on the environment and the consequent damages to crops and to the soil.
Under conditions of saline stress and/or water deficit, crops are known to suffer various physiological disorders that lead to growth reduction and, as a consequence, yield reduction. As to the tomato crop, Ayers & Westcot (1991) consider it as moderately sensitive to the effects of salts, with reductions in its potential yield for levels of water electrical conductivity above 1.7 dS m-1. On the other hand, Rhoades et al. (1992)
cite 2.5 dS m-1 as the salinity threshold for tomato plants, with
relative yield decreases of 9% per unit increase in the electrical conductivity of the saturation extract.
The nutritional supply through fertilization management stands out among the main technologies applied to increase crop growth and profitability, and nitrogen (N) is one of the main macronutrients responsible for this increase, since it performs structural functions, participating in many organic compounds that are vital for plants (Flores et al., 2002). In this context, many studies have reported that the accumulation of these organic solutes increases plant capacity for osmotic adjustment to salinity (Silva et al., 2008).
Therefore, this study aimed to evaluate the effects of irrigation with saline water and fertilization with N doses on the cultivation of cherry tomatoes.
Material and Methods
The study was carried out from August 2013 to January 2014 using drainage lysimeters under greenhouse conditions,
in the experimental area of the Center of Agrifood Science and Technology (CCTA) of the Federal University of Campina Grande (UFCG), in Pombal-PB, Brazil (6º 48’ 16” S; 37º 49’ 15” W; 144 m).
The experimental design was completely randomized blocks, in a 5 x 4 factorial scheme, with three replicates, and the treatments consisted of the combination between five levels of electrical conductivity in the irrigation water – ECw (S1 – 0.3; S2 –1.5; S3 – 2.5; S4 – 3.5 and S5 – 4.5 dS m-1) and four doses
of N fertilization [(N1 - 60, N2 - 100, N3 -140 and N4 -180% of the recommendation of N fertilization (100 mg kg-1)] for pot
experiments, according to Novais et al. (1991), corresponding to 8.88 g of urea and 33.34 g of monoammonium phosphate per pot. For a better control of the studied treatments, drainage lysimeters (plastic pots) were used to monitor water consumption.
The seeds of cherry tomato, variety 261, were obtained in the market and the plants have a cycle of 90 days and are highly resistant to pests and diseases (ISLA Sementes, 2013). The fruit has a globular shape, diameter of 3 to 4 cm and weight of approximately 20 g, ideal for the consumption in salads.
Sowing was performed in plastic trays with 200 cells, by planting two seeds per cell. At 45 days after sowing (DAS), the seedlings were transplanted to 20-L plastic lysimeters, perforated at the bottom to allow drainage, in order to estimate water consumption by the crop. For this, a hose with diameter of 8 mm was connected to the base of the pots and to a 2-L recipient, for the monitoring of the drained volume.
The lysimeters were filled with 0.8 kg of clod-free soil material, mixed with the respective N doses, according to the treatments. The soil material came from a non-saline, non-sodic, eutrophic Regolithic Neosol with sandy loam texture (EMBRAPA, 2013), collected in the layer of 0-30 cm. Soil physical and chemical characteristics (Table 1) were determined according to methodologies recommended by Claessen (1997).
Basal fertilization was performed in each lysimeter by applying phosphorus and potassium, according to the soil chemical analysis and based on plant nutritional requirements for pot conditions. Additionally, 2% of aged cattle manure (6.3 g of N kg-1; 1.28 g of P kg-1 and 0.53 g of K kg-1) was applied
in each pot, in order to improve soil physical, chemical and biological properties, and increase its water holding capacity and infiltration. With the addition of cattle manure, each treatment received 126 mg kg-1 of N in the soil (360 x 6.3/18),
which results in the following treatments of N addition: 186, 226, 266 and 306 mg kg-1 of soil, considering an efficiency index
of 1.0 in the first cultivation. Considering an efficiency index of 0.50 for the first cultivation (CQFSRS/SC, 2004), the doses become: 123, 163, 203 and 243 mg of N kg-1 of soil. After filling
the lysimeters, the soil was brought to field capacity through
Ca2+ and Mg2+ extracted with 1 mol L-1 KCl at pH 7.0; Na+ and K+ extracted using 1 mol L-1 NH
4OAc at pH 7.0; pHSP – pH in the saturated paste; ECSE – Electrical conductivity of the
saturation extract
the method of capillary saturation, followed by free drainage, using the waters with different saline levels.
Phosphorus was applied all at once in the basal fertilization and potassium was applied in three periods (¼ as basal fertilization and ¾ divided into three top-dressing applications), in 4-cm deep holes, 8 cm distant from plant stem.
From sowing to 45 DAS, irrigation was daily performed in each cell, from 7 to 17 h, using water from the local supply system; after transplantation, irrigations were performed according to the treatments. The soil was kept at field capacity and the applied water depth was measured through the water balance in the root zone, by subtracting the volume drained in the previous irrigation from the applied volume, thus obtaining the consumed volume, and adding a leaching fraction of 0.10.
Tomato growth was evaluated at 54 and 125 days after transplantation (DAT) through the determination of the number of leaves (NL), plant height (PH), stem diameter (SD) and leaf area (LA). Dry matters of stem (SDM), leaves (LDM) and roots (RDM) were determined at 125 DAT at the end of the experiment. The number of clusters (NC) was evaluated at 104 DAT.
In the quantification of NL, only leaves with at least 50% of photosynthetically active area and minimum length of 3 cm were considered. PH (cm) was obtained by measuring the distance from the base to the apical meristem of the plants. SD (mm) was determined at 5 cm from plant base using a digital caliper, and LA (cm2) was obtained according to the
methodology of Reis et al. (2013), as LA = L * W * f; where “L” is the length (cm) and “W” is the width (cm) of all the leaves from the marked plants and “f ” is the shape factor, which was equal to 0.59. The length was defined as the distance from the petiole insertion in the leaf blade to the opposite leaf tip, while width was defined as the longest dimension perpendicular to the length axis.
For the determination of stem, leaf and root dry matters, the material was placed in paper bags, dried in an oven at 60 ºC until constant weight and then weighed. The number of clusters was manually counted considering only the ones with flowers.
The obtained data were evaluated through analysis of variance by F test at 0.05 and 0.01 probability levels for the factors water salinity and N doses. When significant, linear and quadratic polynomial regressions were performed using the statistical program SISVAR-ESAL (Ferreira, 2003).
Results and Discussion
Based on the analysis of variance (Table 2), there was significant influence of the levels of irrigation water salinity (S) on all the studied variables, except for stem diameter (SD), for which no significant effect was observed at 54 DAT. As to the factor N doses, there was significant effect only for plant height (PH) and leaf area (LA) at 125 DAT; on the other hand, the interaction between the factors (S x N) had significant effect only on LA, at 125 DAT.
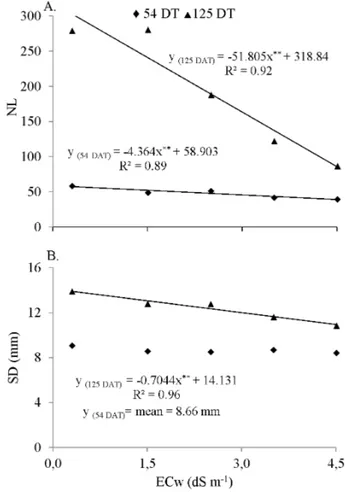
The NL of cherry tomato decreased linearly with the increase in irrigation water salinity and, according to the regression analysis (Figure 1A), there were NL reductions of
ns, **, *Respectively, not significant and significant by F test at p < 0.01 and p < 0.05; 1Statistical analysis performed after data transformation to √x
Table 2. Summary of the analysis of variance for number of leaves (NL), stem diameter (SD), plant height (PH) and leaf area (LA) of cherry tomato under different levels of irrigation water salinity and nitrogen (N) doses at 54 and 125 days after transplantation (DAT)
7.41 and 16.25%, respectively, at 54 and 125 DAT, per unit increase in ECw. This led to NL reductions of 31.12 and 68.24% in plants irrigated with water of 4.5 dS m-1, compared with those
under ECw of 0.3 dS m-1. Leithya et al. (2009), studying the
initial growth of tomato under different levels of water salinity and cattle biofertilizer application, observed high number of leaves in geranium (Pelargonium graveolens L.), but it decreased with the increase in salinity.
The increase in irrigation water salinity affected the SD of cherry tomato plants (Figure 1B), promoting a linear decrease of 4.80% per unit increase in ECw at 125 DAT, i.e., a reduction of approximately 3.06 mm in SD of plants irrigated with water of 4.5 dS m-1 in comparison to those under ECw of 0.3 dS
m-1. According to Munns & Tester (2008), the inhibition of
growth in plants under saline stress, as observed for SD, can be explained by the decrease in the osmotic potential of the soil solution, besides the possibility of occurrence of ionic toxicity, nutritional imbalance or both, due to the excessive accumulation of certain ions in plant tissues.
Lima et al. (2015), studying eggplant, and Lima et al. (2008) and Silva et al. (2008), studying castor bean, also observed that the increase in irrigation water salinity promoted reduction not only in stem diameter, but also in most of the growth variables, preventing plants from having conditions to develop satisfactorily.
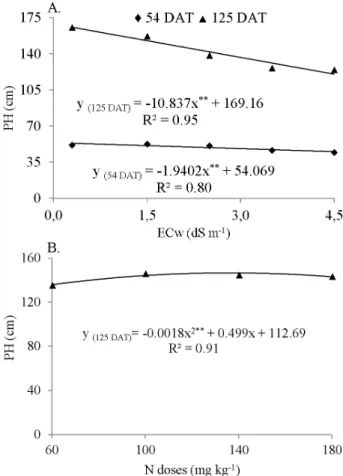
PH decreased linearly in all growth evaluations along the crop cycle as a function of the increase in irrigation water salinity and, according to the regression equations (Figure 2A), there were decreases in PH of 3.59 and 6.41%, respectively, at 54 and 125 DAT, per unit increase in ECw, i.e., reductions of 15.07 and 26.91% in the height of plants irrigated with water of 4.5 dS m-1, compared to those under ECw of 0.3 dS m-1. According
to Gulzar et al. (2003), the stress caused by the excess of ions, in general, reduces CO2 assimilation, stomatal conductance, transpiration and photosynthesis and, consequently, tends to hamper plant development.
The increase in N doses promoted significant effects (p < 0.05) on PH of cherry tomato at 125 DAT and, according to the regression equation (Figure 2B), the data fitted best to a quadratic model, where the highest PH value (147.3 cm) was obtained with the application of 139% of N. In other words, N promoted positive effects on plants due to its role in the metabolism, because it participates in the chlorophyll molecule, nucleic acids and proteins, besides being an activator of many enzymes (Malavolta, 2006).
Oliveira et al. (2007), evaluating saline water irrigation on different production characteristics of tomato, observed decrease in plant height of 4.76 cm per unit increase in ECw, with reduction percentages of 18, 22, 26, 40 and 78% for the salinity levels of 5.7, 6.8, 8.3, 12.7 and 24.5 dS m-1 in the
irrigation water, significantly reducing this variable during all the crop cycle. On the other hand, in a study with increasing N doses and different saline levels, Badr & Talaab (2008) observed increment in growth of tomato plants with the increase in N doses, even under moderate salinity conditions.
The leaf area of cherry tomato decreased linearly with the increase in irrigation water salinity and, according to the regression equations (Figure 3A), there was a reduction
Figure 2. Plant height (PH) of cherry tomato as a function of the electrical conductivity of the irrigation water (ECw) at 54 and 125 days after transplantation (DAT) (A) and as a function of nitrogen (N) doses at 125 DAT (B)
of 9.21% at 54 DAT per unit increase in ECw, resulting in a decrease of approximately 1642.66 cm2 in the PH of plants
irrigated with water of 4.5 dS m-1, in comparison to plants
cultivated under low salinity (0.3 dS m-1). The leaf area of
plants cultivated under saline conditions is one of the most affected variables and its decrease is possibly related to the reduction in water availability and absorption, which affects cell division and elongation (Tester & Davenport, 2003). Silva (2011), studying the increment in irrigation water salinity (0.5 to 6.0 dS m-1) on okra plants, also observed that the increase
in ECw caused a decrease in plant leaf area.
According to the regression equations for LA at 125 DAT (Figure 3B), plants under fertilization with doses of 60, 100, 140 and 180 mg N kg-1 of soil suffered linear decreases of
approximately 15.75, 16.47, 16.58 and 17.82% per unit increase in ECw, corresponding to reductions of about 7211.17, 8585.33, 12171.66 and 16063.33 cm2 in the LA of plants irrigated with
water of 4.5 dS m-1, compared with those under ECw of 0.3 dS
m-1. The excess of salts in the root zone had negative effects
on plant growth, because of the higher osmotic effect outside the roots and restriction in the water flow from the soil to the plants, which is necessary for survival and production under saline stress conditions (Silva et al., 2008).
Similarly, Medeiros et al. (2011), studying cherry tomato subjected to fertilization based on different cattle manure biofertilizers (with and without the addition of molasses, milk and agricultural gypsum) and irrigated with saline water, observed that there was positive effect of biofertilizers on shoot dry matter with the increase in irrigation water salinity, but with superiority for the enriched biofertilizer.
In the evaluation of SDM at 125 DAT (Figure 4B), there was significant effect of the interaction between factors (S x N) and, according to the regression equations, plants under fertilization with N doses of 60, 100, 140 and 180 mg kg-1 of soil
suffered linear decreases of 18.43, 18.41, 19.92 and 19.83% per unit increase in ECw, i.e., reductions of 77.41, 77.33, 83.67 and 83.27% in the SDM of plants irrigated with water of 4.5 dS m-1
in comparison to those under ECw of 0.3 dS m-1. According to
the results for LDM and SDM, the increment in ECw increased soil salinity and reduced the osmotic potential (Garcia et al., 2010), thus increasing the resistance to water absorption by plants and, consequently, leading to the reduction in phytomass production.
Pessarakll & Tucker (1988) also observed reduction in dry matter production in cherry tomato with the increase in irrigation water salinity, indicating the sensitivity of the crop to saline stress.
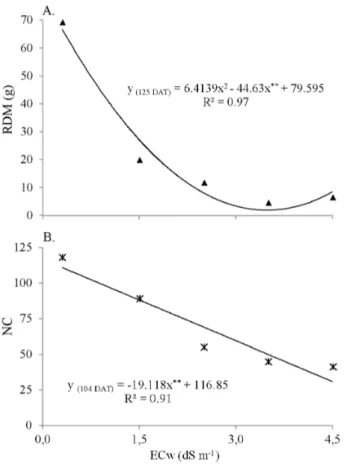
RDM of cherry tomato plants decreased with the increase in ECw and, according to the regression equations (Figure 5A), the data fitted best to a quadratic model, with the highest RDM (69.4 g) obtained in plants irrigated with water of 0.3 dS m-1,
i.e., there was a RDM reduction of 90.5% in plants irrigated
Figure 3. Leaf area (LA) of cherry tomato as a function of the electrical conductivity of the irrigation water (ECw) at 54 days after transplantation (DAT) (A) and as a function of the interaction between the factors irrigation water salinity and nitrogen (N) doses at 125 DAT (B)
Table 3. Summary of the analysis of variance for stem dry matter (SDM), leaf dry matter (LDM) and root dry matter (RDM) at 125 days after transplantation (DAT) and number of clusters (NC) in cherry tomato under different levels of irrigation water salinity and nitrogen (N) doses at 104 DAT
ns, **, *Respectively, not significant and significant by F test at p < 0.01 and p < 0.05; 1Statistical analysis performed after data transformation to √x
interaction between factors (S x N), there was significant effect for LDM (p < 0.05) and SDM (p < 0.05) at 125 DAT.
At 125 DAT (Figure 4A), there was significant effect of the interaction between factors (S x N) on LDM and, according to the regression equations, cherry tomato plants, when subjected to fertilization with N doses of 60, 100, 140 and 180 mg kg-1 of soil, showed decreases of 12.28, 12.96, 14.80 and
13.90% per unit increase in ECw, i.e., there were reductions of approximately 51.57, 54.43, 62.18 and 58.37% in the LDM of plants irrigated with water of 4.5 dS m-1, in comparison to
those under ECw of 0.3 dS m-1.
the number of clusters of cherry tomato decreased from the irrigation water salinity of 0.3 dS m-1 on.
2. The longer exposure of plants to saline stress promoted the highest reductions in growth and production variables, and root dry matter, leaf area and the number of clusters per plant are the most sensitive variables.
3. The highest value of plant height at 125 days after transplantation was obtained with the N dose of 139 mg kg-1
of soil.
4. Nitrogen fertilization reduces the effect of salinity on leaf area, leaf dry matter and stem dry matter of cherry tomato at 125 days after transplantation.
Literature Cited
Ayers, R. S.; Westcot, D. W. A qualidade da água na agricultura. Campina Grande: UFPB. 1991, 218p. Estudos FAO Irrigação e Drenagem, 29
Badr, M. A; Talaab A. S. Response of tomatoes to nitrogen supply through drip irrigation system under salt stress Conditions Australian. Journal of Basic and Applied Sciences, v.2, p.149-156, 2008.
Blanco, F. F.; Folegatti, M. V. Doses de N e K no tomateiro sob estresse salino: III. Produção e qualidade de frutos. Revista Brasileira de Engenharia Agrícola e Ambiental, v.12, p.122–127, 2008. http:// dx.doi.org/10.1590/S1415-43662008000200003
Claessen, M. E. C. (org.). Manual de métodos de análise de solo. 2.ed. Rio de Janeiro: Embrapa CNPS, 1997. 212p. Documentos, 1.
CQFSRS/SC - Comissão de Química e Fertilidade do Solo – Manual de recomendações de adubação e calagem para os estados do Rio Grande do Sul e Santa Catarina. Porto Alegre: SBCS – Núcleo Regional Sul, 2004. 394p.
EMBRAPA – Empresa Brasileira de Pesquisa Agropecuária. Centro Nacional de Pesquisa de Solos. Sistema brasileiro de classificação de solos. 3.ed., Brasília: Embrapa Solos, 2013. 353p.
Ferreira, D. F. SISVAR 4.6 - Programa de análise estatística. Universidade Federal de Lavras, 2003. CD-Rom
Flores, P.; Botella, M. A.; Martinez, V. Cerda, A. Response to salinity of tomato seedlings with a split-root system: Nitrate uptake and reduction. Journal of Plant Nutrition, v.25, p.177-187, 2002. http:// dx.doi.org/10.1081/PLN-100108789
Freire, A. L. de O.; Saraiva, V. P.; Miranda, J. R. P. de; Bruno, G. B. Crescimento, acúmulo de íons e produção de tomateiro irrigado com água salina. Semina: Ciências Agrárias, v.31, p.1133-1144, 2010. http://dx.doi.org/10.5433/1679-0359.2010v31n4Sup1p1133 Garcia, G. de O.; Nazário, A. A.; Moraes, W. B.; Gonçalves, I. Z.;
Madalão, J. C. Respostas de genótipos de feijoeiro à salinidade. Engenharia na Agricultura, v.18, p.330-338, 2010.
Gulzar, S.; Khan, M. A.; Ungar, I. A. Salt tolerance of a coastal salt marsh grass. Soil Science and Plant Analysis, v.34, p.2595-2605, 2003. http://dx.doi.org/10.1081/CSS-120024787
ISLA Sementes. Tomateiro cereja. http://isla.com.br/cgi-bin/detalhe. cgi?id=261. 5 Mar. 2013.
Leite, E. M.; Cavalcante, L. F.; Diniz, A. A.; Santos, R. V.; Alves, G. S.; Cavalcante, I. H. L. Correção da sodicidade de dois solos irrigados em resposta à aplicação de gesso agrícola. Irriga, v.12, p.168-176, 2007.
Figure 5. Root dry matter (RDM) at 125 days after transplantation (DAT) (A) and number of clusters (NC) at 104 DAT (B) of cherry tomato as a function of the electrical conductivity of the irrigation water (ECw)
with water of 4.5 dS m-1 compared with plants under ECw of
0.3 dS m-1.
The saline stress caused changes in root growth and development, thus interfering with water and ion absorption by plants and hampering crop development, since a well-developed root system can promote better conditions to meet plant requirements for water and nutrients, especially in the first weeks, when adverse conditions can compromise its survival (Soares et al., 2011).
The NC of cherry tomato decreased linearly with the increase in irrigation water salinity and, according to the regression equations (Figure 5B), there was a decrease in NC of 16.36% at 104 DAT per unit increase in ECw, i.e., a reduction of 76.7 clusters in plants irrigated with water of 4.5 dS m-1
compared with plants under ECw of 0.3 dS m-1. Different results
were reported by Blanco & Folegatti (2008), in evaluations at 52 and 76 days after sowing, with tomato plants irrigated using saline water. On the other hand, Freire et al. (2010), studying the effect of irrigation with water of different ECw levels on tomato cultivars in a protected environment, observed a production decrease of 10% for the cultivar ‘Santa Adélia’ and 6.8% for the cultivar ‘Meia Estaca’, when plants under ECw of 6.0 dS m-1 were compared with those under ECw of 0.4 dS m-1
along the crop cycle.
Conclusions
Leithya, S.; Gaballah, M. S.; Gomaa, A. M. Associative impact of bio and organic fertilizers on geranium plants grown under saline conditions. International Journal of Academic Research, v.1, p.17-23, 2009. Lima, A. L.; Oliveira, F. A.; Alves, R. C.; Linhares, P. S. F.; Medeiros, A.
M. A; Bezerra, F. M. S. Tolerância da berinjela à água de irrigação. Revista Agroambiente, v.9, p.27-34, 2015.
Lima C. B.; Santos Filho, S. V.; Santos, M. A. dos; Oliveira, M. de. Desenvolvimento da mamoneira, cultivada em vasos, sob níveis de salinidade da água em Latossolo Vermelho-amarelo eutrófico. Revista Caatinga, v.21, p.50-56, 2008.
Malavolta, E. Manual de nutrição mineral de plantas. 2.ed. Piracicaba, Ceres, 2006. 631p.
Medeiros, R. F.; Cavalcante, L. F.; Mesquita, F. O.; Rodrigues, R. M.; Sousa, G. G.; Diniz, A. A. Crescimento inicial do tomateiro-cereja sob irrigação com águas salinas em solo com biofertilizantes bovino. Revista Brasileira de Engenharia Agrícola e Ambiental, v.15, p.505-511, 2011.
Munns, R.; Tester, M. Mechanisms of salinity tolerance. Annual Review of Plant Biology, v.59, p.651-681, 2008. http://dx.doi. org/10.1146/annurev.arplant.59.032607.092911
Nobre, R. G.; Gheyi, H. R.; Soares, F. A. L.; Cardoso, J. A. F. Produção de girassol sob estresse salino e adubação nitrogenada. Revista Brasileira de Ciência do Solo, v.35, p. 929-937, 2011. http://dx.doi. org/10.1590/S0100-06832011000300027
Novais, R. F.; Neves, J. C. L.; Barros, N. F. Ensaio em ambiente controlado. In: Oliveira, A. J.; Garrido, W.E.; Araújo, J.D.; Lourenço, S. (ed.). Métodos de pesquisa em fertilidade do solo. 3.ed. Brasília: Embrapa SEA, 1991. 392p.
Oliveira, B. C.; Cardoso, A. A.; Oliveira, J. C.; Oliveira, F. A.; Cavalcante, L. F. Características produtivas do tomateiro submetido a diferentes níveis de sais, na água de irrigação. Revista Brasileira de Engenharia Agrícola e Ambiental, v.11, p.11-16, 2007. http://dx.doi.org/10.1590/S1415-43662007000100002
Pessarakli, M.; Tucker, T. C. Dry matter yield and nitrogen-15 uptake by tomatoes under sodium chloride stress. Soil Science, Society American Journal, v.52, p.698-700, 1988. http://dx.doi. org/10.2136/sssaj1988.03615995005200030019x
Prado, S. D.; Bosi, M. L. M.; Carvalho, M. C. V. S.; Gugelmim, S. A.; Mattos, R. A.; Camargo Junior, K. R.; Silva, J. K.; Delmaschio, K. L.; Martins, M. R. Alimentação e nutrição como campo científico autônomo no Brasil: conceitos, domínios e projetos políticos. Revista Nutrição, v.24, p.927-937, 2011. http://dx.doi.org/10.1590/ S1415-52732011000600013
Reis, L. S.; Azevedo, C. A. V. de; Albuquerque, A. W.; Silva Júnior, J. F. Índice de área foliar e produtividade do tomateiro sob condições de ambiente protegido. Revista Brasileira de Engenharia Agrícola e Ambiental, v.17, p.386-391, 2013. http://dx.doi.org/10.1590/ S1415-43662013000400005
Rhoades, J. D.; Kandiah, A.; Mashali, A. M. Uso de águas salinas para produção agrícola. Campina Grande: UFPB, 1992. 117p. Estudos da FAO, Irrigação e Drenagem, 48.
Silva, E. C.; Nogueira, R. J. M. C.; Araújo, F. P.; Melo, N. F.; Azevedo Neto, A. D. Physiological responses to salt stress in young umbu plants. Environmental and Experimental Botany, v.63, p.147-157, 2008. http://dx.doi.org/10.1016/j.envexpbot.2007.11.010 Silva, I. N. Qualidade de água na irrigação. Agricultura Científica no
Semiárido, v.7, p.1-15, 2011.
Soares, L. A. A.; Lima, G. S.; Brito, M. E. B.; Araújo, T. T.; Sá, F. V. S. Taxas de crescimento do tomateiro sob lâmina de irrigação em ambiente protegido. Revista Verde de Agricultura e Desenvolvimento Sustentável, v.6, p.210-217, 2011.
Tester, M.; Davenport, R. Na+ tolerance and Na+ transport in higher