http://dx.doi.org/10.1590/1806-9061-2017-0501
Chickens
Author(s)
Nabizadeh AI Golian AII Hassanabadi AIII Zerehdaran SIV
I Department of Animal Science, Ferdowsi University of Mashhad – International Campus, PO Box 9176764955, Mashhad, Iran.
II The Excellence Centre for Animal Science, Department of Animal Science, Ferdowsi University of Mashhad, PO Box 91775-1163, Mashhad, Iran.
III The Excellence Centre for Animal Science, Department of Animal Science, Ferdowsi University of Mashhad, PO Box 91775-1163, Mashhad, Iran.
IV The Excellence Centre for Animal Science, Department of Animal Science, Ferdowsi University of Mashhad, PO Box 91775-1163, Mashhad, Iran.
Mail Address
Corresponding author e-mail address Abolghasem Golian
The Excellence Centre for Animal Science, Department of Animal Science, Ferdowsi University of Mashhad, PO Box 91775-1163, Mashhad, Iran.
Tel: +989153522058 Email: [email protected]
Keywords
Amino acid density, intestinal morphology, microbiota, growth performance.
Submitted: 01/March/2017 Approved: 28/May/2017
ABSTRACT
A total of 810 one-day-old, straight-run broilers were used to evaluate the effects of dietary nutrient density and feed additives included in the starter diet on their performance, intestinal microbiota, gut morphology, and immune response. A 3×3 factorial arrangement with three nutrient densities (100, 103.75 and 107.5%, as recommended) and three feed additives (no additives, 0.5 g/kg diet Maxi-Gen, and Maxi-Gen + Superzyme + Bio-Phytase at the rate of 0.5, 0.25 and 0.1 g/kg diet, respectively), fed from 1 to 10 d of age. Similar commercial corn-soy grower and finisher diets fed to all birds from 10-24 and 24-42 d of age, respectively. There was higher (p<0.05) body weight gain and lower (p<0.05) feed conversion ratio in chicks fed starter diet with 107.5% nutrient density and Maxi-Gen with or without exogenous enzymes compared with those fed control diet at 10 and 42 d of age. Lactobacilli and Bifidobacteria counts in the cecal content were increased linearly as dietary nutrient density increased in 10-d-old birds (p<0.05). Higher duodenal and jejunal villus height and villus height to crypt depth ratio (p<0.05) were measured in the birds fed the starter diets with 103.75% and 107.5% nutrient density at 5 and 10 d of age. Total anti-SRBC and IgM titers were significantly higher in the broilers fed the 107.5% nutrient density diet containing feed additives at 35 day of age. It is concluded that higher nutrient density and the inclusion of feed additives in the starter diet may improve the growth performance, gut morphology, and immune response of broiler chickens.
INTRODUCTION
The same dietary nutrient specifications for starter Ross 308 broilers were established in 2014 and 2015. However, nutrient requirements may be higher to promote a good start due to the high growth capacity of broilers during this period. On the other hand, their feed intake is relatively low (Kidd et al., 2004), and pancreatic and biliary secretions, required especially for protein and fat digestion, may be insufficient in the first week of post hatch (Noy & Sklan, 1997). Therefore, higher nutrient bioavailability or densities may be needed due to lack of gut development in this period. Otherwise, feed presents lower digestibility, resulting in a high proportion of undigested in the excreta (Noy & Uni,
2010). Adedokun et al. (2007) reported that endogenous ileal amino
Protein, amino acids, calcium, and phosphorus are considered as critical nutrients to maximize growth performance during the starter period (Swennen et al., 2010). In particular, increasing amino acid density in pre-starter diets increases weight gain at 7 d of age, and subsequently, due to positive correlation between early live weight and final body weight (Willemsen et
al., 2008), they may improve the economic efficiency
in broiler chickens (Sklan & Noy, 2003). It is reported that broiler fed a starter diet with high nutrient density grow faster throughout the entire rearing period (Zhai
et al., 2013). There is evidence that some nutrient requirements of broilers, particularly of digestible amino acids in the first 10 d post hatch may be higher than the current commercial recommendations (Barekatain & Swick, 2016). Hence, determining dietary amino acid digestibility and density in the starter diet are crucial factors to maximize chick’s growth performance.
In addition, soy products and cereal grains may contain several many antinutritional components, which form low or indigestible compounds (Bach Knudsen, 1997). The use of exogenous enzymes is an effective way to reduce the antinutritional component levels in feedstuffs, and therefore, to improve broiler performance (Cowieson, 2005), overall nutrient availability (Burnett, 1996), and promote immunity
and intestinal health (Zou et al., 2006). However,
there is little information on the effect of exogenous enzymes in starter diet on the intestinal microflora and gut morphology of broiler chicks, especially in diets based on corn and soybean meal.
The objective of this study was to determine the effects of increasing the density of nutrients (protein, essential amino acids, Ca, and P) in the starter diet and the addition or not of feed additives on broiler performance, intestinal microflora, gut morphology, and immune response.
MATERIAL AND METHODS
Bird management and diets
A total of 810 one-d-old, straight-run Ross 308 broiler chicks were obtained from a commercial hatchery, and individually weighed (average initial body weight of 48g). Birds were housed in pens (100×100×70 cm, L×W×H) equipped with two nipple drinkers and a hanging plastic feeder each for manual feed distribution. The pen’s concrete floor was covered with new wood-shaving litter. All birds had free access to feed and water, and were exposed to 23L:1D throughout the trial. Temperature was initially set at 32°C on d 1 and linearly decreased by 0.5°C per
day to reach a temperature of 21°C on d 22 and kept constant thereafter. All birds were vaccinated against the viral diseases Newcastle and Infectious Bursal (IBD), as scheduled by the local veterinary officials.
Birds were distributed based on a completely randomized design experiment with a 3×3 factorial arrangement, totaling of nine treatments, with six replicate pens of 15 birds each. Nine broiler starter diets were formulated to evaluate three dietary nutrient densities and the inclusion of three feed additives. Firstly, three starter broiler diets were formulated with nutrient densities of 100, 103.75, and 107.5% of the nutritional requirements as recommended by the Aviagen (Ross 308, 2014). Then, the diets with each nutrient density were divided into three equal portions and supplied with no feed additives (FA),with Maxi-GenTM Plus at the rate of 0.5 g/kg diet, or with
the combination of Maxi-GenTM Plus + SuperzymeTM
-CS+Bio-Phytase 5000Gat rates of 0.5, 0.25 and 0.1 g/kg diet, respectively (Canadian Bio-Systems Inc., Calgary, Alberta, Canada), and mixed in a mixer. The
commercial additive Maxi-GenTM Plus contains 10%
moisture, 28% crude protein, 1.5% nucleotides, and 22% yeast carbohydrates. The enzyme blend
(SuperzymeTM -CS 2X) contains 11% moisture, 12%
crude protein, 5% crude fiber, 2400 xylanase units/g, 300 glucanase units/g, 1400 invertase units/g, 2400 protease units/g, 1000 cellulase units/g, 24000 amylase units/g, and 120 mannanase units/g. The phytase product (Bio-Phytase) contains 5000 phytase units/g. The ingredients and chemical composition of the starter diets are shown in Table 1. The experimental protocol was approved by the Animal Welfare Committee, at the Ferdowsi University of Mashhad, Iran.
Performance
Birds were weighed per replicate upon arrival and on d 5, 10, 24 and 42, using a digital electronic balance at 0.1g accuracy to record body weight (BW). Feed intake (FI) was determined as the difference between feed supply and feed residue during each period. Mortality was recorded as it occurred, and the weight of individual dead birds was added to the total pen live body weight for the calculation of feed conversion ratio (FCR) during each period. The FCR were calculated by dividing total feed intake by body weight gain (BWG) of birds.
Sample collection and measurements
morphology on days 5 and 10 of age. The selected birds were weighed, sacrificed, dissected, and the ileal and/or caeca (mixture of both caecum) content of each bird was immediately collected, mixed, placed in a microtube, and stored at -70°C until microbial analysis.
Microbial populations were determined by serial dilution of the ileal and/or cecal samples in anaerobic diluents before inoculation onto Petri dishes with sterile agar. Lactobacilli were grown on Rogosa SL
agar, Bifidobacteria on BIM-25 agar, and E. coli on
EMB agar. Lactobacilli and Bifidobacteria plates were
anaerobically incubated at 37°C for 48 h, andE. coli
plates were aerobically incubated at 37°C for 24 h, after which colony-forming units (UFC) of each were counted and expressed as in common logarithms of CFU per gram of fresh ileal and/or cecal content.
Subsequently, the mid-section of duodenum,
jejunum, and ileum (1 cm2) were collected, gently
washed with physiological saline solution to remove any adherent of intestinal content, and the poured into duly identified flasks with 10% buffered formalin for histological study. Formalin solutions were changed
two times to refresh the tissues. Tissue samples dehydrated with increasing concentrations (70, 80, 95, and 100%) of ethanol, cleared with xylene, and embedded in paraffin wax. Tissue sections (2µm) were cut using a microtome (Pouyan, MK 1120, Pouyan Co., Mashhad, Iran), mounted onto slides, and stained with hematoxylin (Gill no. 2, Sigma, St. Louis, MO) and eosin (Sigma). Twelve images from three sections of each tissue sample were taken, and 24 villus heights and crypt depths were measured using animage Pro-Plus V 4.5software (Model U- TV0.5 XC-2, Olympus Corporation, BX41, Olympus, Tokyo, Japan). Villus length was measured from the tip of the villus to the valley between individual villi, and measurements for crypt depth were taken from the valley between individual villi and the basolateral membrane.
Evaluation of humoral immune response
Total antibody titers against sheep red blood cells (SRBC) were measured using hemagglutination test. About 20 mL blood of a male sheep were collected into labeled sterile tubes containing EDTA, centrifuged for
Table 1 – Ingredients and nutrient composition of the starter diets1 fed from 1 to 10 days of age
Nutrient density (% of recommendation)
100.00 103.75 107.50
Ingredient (%) No additive Maxi (Maxi+Sz+P)2 No additive Maxi Maxi+Sz+P No additive Maxi Maxi+Sz+P
Corn 8.5% 39.80 39.80 39.80 39.53 39.53 39.53 38.70 38.70 38.70
Brokenrice 18.00 18.00 18.00 19.50 19.50 19.50 19.96 19.96 19.96
Soybeanmeal 46% 19.34 19.34 19.34 21.78 21.78 21.78 16.44 16.44 16.44
ISP3 90% 4.50 4.50 4.50 5.00 5.00 5.00 8.00 8.00 8.00
Cornglutenmeal 60% 7.53 7.53 7.53 7.79 7.79 7.79 9.00 9.00 9.00
Soybeanoil 0.92 0.92 0.92 1.74 1.74 1.74 3.00 3.00 3.00
Wheatbran15% 4.42 4.42 4.42 - - -
-Casein 80% 1.00 1.00 1.00 - - -
-Dicalciumphosphate 1.66 1.66 1.66 1.81 1.81 1.81 1.96 1.96 1.96
Calciumcarbonate 1.42 1.42 1.42 1.44 1.44 1.44 1.46 1.46 1.46
Sodiumchloride 0.38 0.38 0.38 0.41 0.41 0.41 0.42 0.42 0.42
L-lysine-HCl 0.25 0.25 0.25 0.22 0.22 0.22 0.26 0.26 0.26
DL-methionine 0.24 0.24 0.24 0.24 0.24 0.24 0.25 0.25 0.25
Threonine 0.04 0.04 0.04 0.04 0.04 0.04 0.05 0.05 0.05
Vit.+min.premix4 0.50 0.50 0.50 0.50 0.50 0.50 0.50 0.50 0.50
Calculated nutrients (% unless stated)
ME (MJ/Kg) 12.55 12.55 12.55 13.02 13.02 13.02 13.49 13.49 13.49
Crudeprotein5 22.93 22.87 22.95 23.85 23.88 23.80 24.87 24.80 24.85
Lysine 1.29 1.29 1.29 1.34 1.34 1.34 1.39 1.39 1.39
Methionine 0.65 0.65 0.65 0.67 0.67 0.67 0.70 0.70 0.70
Met+cys 0.95 0.95 0.95 0.97 0.97 0.97 1.00 1.00 1.00
Threonine 0.90 0.90 0.90 0.93 0.93 0.93 0.97 0.97 0.97
Calcium 0.96 0.96 0.96 1.00 1.00 1.00 1.03 1.03 1.03
AvailableP 0.48 0.48 0.48 0.50 0.50 0.50 0.52 0.52 0.52
1 Similar commercial corn-soy grower and finisher diets were fed to all birds from 10-24 and 24-42 days of age, respectively. 2 (Maxi-GenTM Plus, SuperzymeTM-CS 2X, Bio-Phytase
15 min at 2000 rpm, the supernatant was discarded, the precipitate was washed three times in phosphate buffer solution (PBS), and diluted in PBS to 15% (vol/ vol) to provide the SRBC. Two chicks per replicate were intramuscularly injected with 1 mL of the 15% SRBC suspension at 28 and 35 d of age. Sera were collected seven days after the immune challenge in 35 and 42 d of age. The serum from each sample was collected, heat inactivated at 56°C for 30 min, and then analyzed for total, mercaptoethanol-resistant (MER), and mercaptoethanol-sensitive (MES) antibody titers. The MER and MES titers are presumably IgG and IgM, respectively. Fifty µL of serum was added in an equal amount of PBS in the first column of a 96-well V-shaped bottom plate, and the solution was incubated for 30 min at 37°C. A serial dilution was then made (1:2), and 50 µL of 2% SRBC suspension was added to each well. Total antibody titers were then read after 30 min of incubation at 37°C. The well immediately preceding a well with a distinct SRBC at the button was considered as the endpoint titer for agglutination. For IgM response, 50 µL of 0.01 M mercaptoethanol in PBS was used instead of PBS alone, followed by the aforementioned procedure. The difference between total and IgG titers was considered to be equal to the IgM antibody titer.
Statistical analysis
Data were analyzed in a completely randomized design with factorial arrangement, using the GLM procedure of SAS software (SAS Institute, 2008). Means were compared by Duncan’s multiple-range test. Difference among means was considered significant at probability level of equal or lower than 5%. Data were also subjected to orthogonal polynomial analysis for linear and quadratic trends, using SAS software (SAS Institute, 2008).
RESULTS AND DISCUSSION
Performance
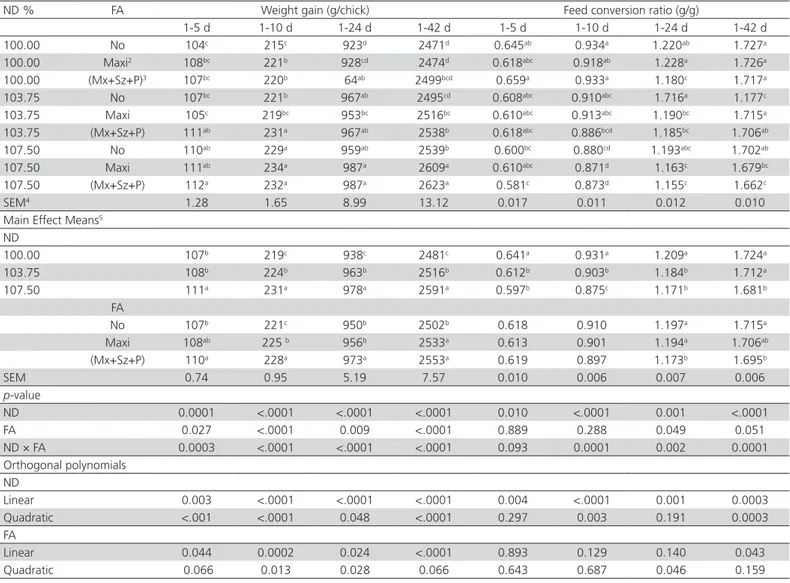
The main effects of nutrient densities (ND) and feed additives (FA) in starter diet and their interaction on broiler performance are shown in Table 2. The increase in the ND of the starter diet increased (p<0.05) the BWG of birds during all periods, except for those fed the 103.75% ND diet from 1-5 d of age. The chicks fed starter diet supplemented with both
feed additives presented higher (p<0.0001) BWG
compared with the control birds at 42 d of age. The chicks fed the 103.75% ND diet and the combination of additives, and those fed the 107.5% ND diet with
the combination of FA presented similar BWG than those fed the control or other diets at 10 d of age. Chicks fed the 107.5% ND diet with the FA and the
FA combination presented higher (p<0.05) BWG
than those fed the control or other diets at 42 d of age. The chicks fed the 107.5% ND diet presented lower (p<0.0001) FCR than those fed the control diet (100% of the requirements) during the entire rearing period (1-42 d of age). The starter diet containing the combination of feed additives improved (p<0.05) the FCR compared with those fed the control diet during 1-24 and/or 1-42 d of age. The effect of nutrient density diet showed that chicks fed starter diet with 107.5% ND and supplemented with the
FA combination had lower (p<0.05) FCR compared
with those fed the control (1.662 vs. 1.727) and/ or other diets with the exception of those fed the 107.5% ND diet and supplemented with Maxi-Gen
during 1-42 d of age. Powell et al. (2016) reported
that methionine concentration in the pre-starter diet did not have a significant effect on FI, BWG and FCR during 0 to 7 or 0 to 42 d of age. Similarly, Zhai et
al. (2014) reported that amino acid (AA) density did
not have a significant effect on FI, BWG, and FCR. In contrast, other studies have stated that high AA
density improves FCR (Wang et al., 2015; Gottardo
et al., 2016), and BWG (Wang et al., 2015). Also, it has been reported that the increase in ND of the starter diet enhanced growth rate in all growing
periods (Zhai et al., 2013) and improved economic
efficiency (Sklan & Noy, 2003). Amino acids act as signal mediators of protein synthesis, such that a high protein pre-starter diet can up regulate the initiation of protein translation in broiler breast muscle (Everaert
et al., 2010). Hence, the optimization of dietary AA density in the first week of post-hatch is an important consideration for long-term muscle growth.
Cowieson et al. (2017) reported that the beneficial
effects of exogenous protease in diet based on SBM may be due to a reduction in the allergenicity of antigenic proteins, reducing intestinal inflammation. The beneficial effects of exogenous protease may be related to increase in protein and energy digestibility and also improving gut morphological characteristics (Cowieson et al., 2017).
Intestinal microflora counts
the main effects are presented. The ND and FA did not have any effect (p>0.05) on E. coli, Lactobacillii or Bifidobacteria counts in the ileal content or on E. coli
counts in the cecal content. On the other hand, the increase in ND linearly increased (p=0.007) Lactobacilli counts in cecal content of 10-d-old chicks. Feeding starter diet containing different ND caused a linear increase (p=0.039) in Bifidobacteria counts in cecal content of 10 d chicks. The dietary inclusion of the additive and the combination of additives significantly increased Lactobacilli and Bifidobacteria counts in the cecal content at 10 d of age. There was no effect of the treatments on the microflora counts in the ileal content of 10-d-old chicks. Similarly, Yang et al. (2007) did not find any significant differences in the small intestine microflora counts in broilers fed a range of FA including probiotics, organic acids, mannan oligosaccharides,
and antibiotics. Kim et al. (2016) reported that dietary ND did not have any effect on the cecal microflora counts of broiler chickens. The current study showed that the starter diet ND or FA supplementation significantly increased Bifidobacteria counts and decreased E. coli counts in the cecal content. The ceca is the main fermentative chamber of broiler chickens and, in comparison with other gastrointestinal tract segments, contains the largest number of bacteria, and present high ability to ferment carbohydrates (Józefiak
et al., 2004). Exogenous enzymes increase the levels of substrate available for microbial fermentation and the production of short chain fatty acids (SCFA) in the
cecum (Choct et al., 1996). Increasing SCFA density
causes a gradual decrease in the proliferation rate of Enterobacteria, but not that of Lactobacilli (Van der Wielen et al., 2000).
Table 2 – Effect of starter diet contained three nutrient densities (ND) and different feed additives (FA) on performance of broiler chickens1
ND % FA Weight gain (g/chick) Feed conversion ratio (g/g)
1-5 d 1-10 d 1-24 d 1-42 d 1-5 d 1-10 d 1-24 d 1-42 d
100.00 No 104c 215c 923d 2471d 0.645ab 0.934a 1.220ab 1.727a
100.00 Maxi2 108bc 221b 928cd 2474d 0.618abc 0.918ab 1.228a 1.726a
100.00 (Mx+Sz+P)3 107bc 220b 64ab 2499bcd 0.659a 0.933a 1.180c 1.717a
103.75 No 107bc 221b 967ab 2495cd 0.608abc 0.910abc 1.716a 1.177c
103.75 Maxi 105c 219bc 953bc 2516bc 0.610abc 0.913abc 1.190bc 1.715a
103.75 (Mx+Sz+P) 111ab 231a 967ab 2538b 0.618abc 0.886bcd 1.185bc 1.706ab
107.50 No 110ab 229a 959ab 2539b 0.600bc 0.880cd 1.193abc 1.702ab
107.50 Maxi 111ab 234a 987a 2609a 0.610abc 0.871d 1.163c 1.679bc
107.50 (Mx+Sz+P) 112a 232a 987a 2623a 0.581c 0.873d 1.155c 1.662c
SEM4 1.28 1.65 8.99 13.12 0.017 0.011 0.012 0.010
Main Effect Means5 ND
100.00 107b 219c 938c 2481c 0.641a 0.931a 1.209a 1.724a
103.75 108b 224b 963b 2516b 0.612b 0.903b 1.184b 1.712a
107.50 111a 231a 978a 2591a 0.597b 0.875c 1.171b 1.681b
FA
No 107b 221c 950b 2502b 0.618 0.910 1.197a 1.715a
Maxi 108ab 225 b 956b 2533a 0.613 0.901 1.194a 1.706ab
(Mx+Sz+P) 110a 228a 973a 2553a 0.619 0.897 1.173b 1.695b
SEM 0.74 0.95 5.19 7.57 0.010 0.006 0.007 0.006
p-value
ND 0.0001 <.0001 <.0001 <.0001 0.010 <.0001 0.001 <.0001
FA 0.027 <.0001 0.009 <.0001 0.889 0.288 0.049 0.051
ND × FA 0.0003 <.0001 <.0001 <.0001 0.093 0.0001 0.002 0.0001
Orthogonal polynomials ND
Linear 0.003 <.0001 <.0001 <.0001 0.004 <.0001 0.001 0.0003
Quadratic <.001 <.0001 0.048 <.0001 0.297 0.003 0.191 0.0003
FA
Linear 0.044 0.0002 0.024 <.0001 0.893 0.129 0.140 0.043
Quadratic 0.066 0.013 0.028 0.066 0.643 0.687 0.046 0.159
1All birds were fed a similar corn-soy commercial grower and finisher diets during 10-24 and 24-42 d of age, respectively. a, b, …Means in the same column with no common
Table 3 – Effect of starter diet containing three nutrient densities (ND) and different feed additives (FA) on microflora counts in the ileal and cecal contents of 10-d-old chicks (log10 cfu/g content)
Ileum Caeca
Treatments E. coli Lactobacillus Bifidobacteria E. coli Lactobacillus Bifidobacteria
ND% (as recommended)
100.00 4.487 6.693 6.121 4.776 7.304b 6.379b
103.75 4.658 6.771 6.092 4.786 7.734a 6.540ab
107.50 4.527 6.605 5. 902 4.854 7.667a 6.766a
FA
No additive 4.602 6.731 6.064 4.780 7.199b 6.340b
Maxi 4 .619 6.686 6.048 4.861 7.815a 6.685a
(Maxi + Sz+ P)1 4.451 6.652 6.003 4.776 7.691a 6.660a
SEM 0.099 0.071 0.082 0.093 0.114 0.105
p-value
ND 0.4515 0.2713 0.1349 0.8100 0.0224 0.0419
FA 0.4245 0.7372 0.8630 0.7645 0.0009 0.0440
ND × FA 0.1200 0.0696 0.0829 0.9042 0.2016 0.3513
Orthogonal polynomials ND
Linear 0.3922 0.9497 0.2246 0.6990 0.0066 0.0392
Quadratic 0.3552 0.1084 0.1090 0.6046 0.6784 0.1361
FA
Linear 0.5814 0.4809 0.7010 0.7371 0.0003 0.0131
Quadratic 0.2367 0.7431 0.7039 0.5170 0.4458 0.8672
1 (Maxi-GenTM Plus, SuperzymeTM-CS 2X, Bio-Phytase 5000G at the rate of 0.5, 0.25 and 0.1 g/kg diet, respectively). a, b Means in the same column with no common superscript for
each effect are significantly different at p≤0.05. SEM= standard error of the mean.
Table 4 – Effect of three nutrient densities (ND) and different feed additives (FA) in starter diet on intestinal morphology of 5 and 10 d chicks
Villus height (µm) Villus height to crypt depth ratio
Duodenum Jejunun Ilenum Duodenum Jejunun Ilenum
Treatments 5 d 10 d 5 d 10 d 5 d 10 d 5 d 10 d 5 d 10 d 5 d 10 d
ND% (as recommended)
100.00 999b 1178b 708c 829b 435b 525c 5.52c 6.47b 4.37c 4.98c 3.39b 4.04c
103.75 1041a 1193a 757b 847b 454ab 533b 5.96b 6.85a 4.98b 5.53b 3.68a 4.26b
107.50 1060a 1193a 784a 866a 462a 542a 6.46a 7.15a 5.80a 5.99a 3.83a 4.47a
FA
No additive 1017b 1184 735b 843 441 531 5.82b 6.69 4.90 5.38 3.54 4.17b
Maxi 1032ab 1189 749ab 855 454 534 5.93ab 6.87 5.04 5.46 3.62 4.24ab
(Maxi+Sz+P)1 1051a 1190 765a 844 456 536 6.19a 6.92 5.22 5.66 3.73 4.36a
SEM 7.14 2.15 7.22 6.70 7.05 1.75 0.10 0.12 0.13 0.12 0.08 0.05
p-value
ND <.0001 <.0001 <.0001 0.001 0.027 <.0001 <.0001 0.001 <.0001 <.0001 0.001 <.0001
FA 0.005 0.100 0.018 0.389 0.283 0.127 0.040 0.332 0.241 0.254 0.197 0.029
ND × FA 0.669 0.139 0.375 0.573 0.705 0.482 0.397 0.571 0.153 0.189 0.630 0.369
Orthogonal polynomials ND
Linear <.0001 <.0001 <.0001 <.0001 0.001 <.0001 <.0001 0.001 <.0001 <.0001 0.0003 <.0001
Quadratic 0.073 0.957 0.012 0.048 0.426 0.001 0.001 0.075 <.0001 0.011 0.150 0.004
FA
Linear 0.006 0.034 0.016 0.472 0.117 0.055 0.061 0.151 0.158 0.233 0.129 0.037
Quadratic 0.064 0.828 0.115 0.242 0.846 0.505 0.079 0.724 0.354 0.250 0.330 0.086
1 (Maxi-GenTM Plus, SuperzymeTM-CS 2X, Bio-Phytase 5000G at the rate of 0.5, 0.25 and 0.1 g/kg diet, respectively). a, b, … Means in the same column with no common superscript for
Intestinal morphology
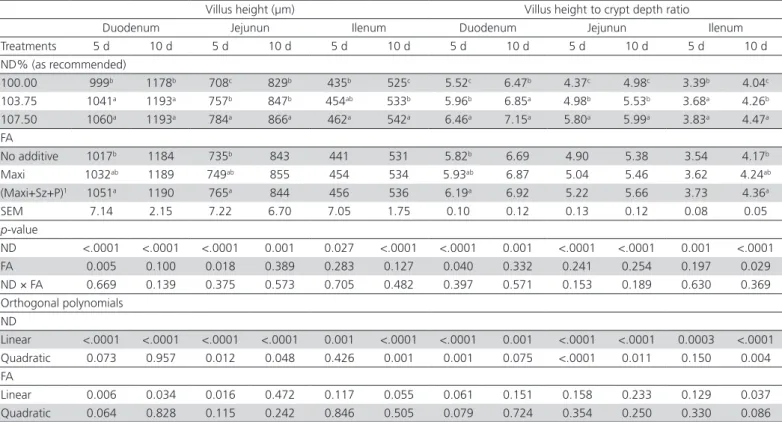
Effect of the starter diet containing different ND and FA on the intestinal morphology of broiler chicks at 5 and 10 d of age are shown in Table 4. There was no interaction between ND and FA on intestinal morphology, and thus the main effects are presented. Villus height and villus height to crypt depth ratio (VCR)
in the duodenum and jejunum increased (p<0.05)
when chicks fed starter diet containing 103.75% and 107.5% ND at 5 and 10 d of age. Feeding starter diet containing the additive combination increased (p<0.05) villus height in the duodenum and jejunum of 5-d-old chicks. The inclusion of FA in the starter diet linearly increased (p<0.055) villus height in ileum at 10 d of age. The VCR in jejunum was not affected by additive supplementation at 5 or 10 d of age, but the supplementation with the additive combination
increased (p<0.05) the VCR in the duodenum and
ileum at 5 and 10 d of age, respectively. The inclusion of Maxi-Gen alone in starter diet did not have a significant effect on intestinal morphology of broiler chicks at 5 or 10 d of age. Chen et al. (2016) reported that higher dietary levels of branched-chain amino acids increased villus height (p=0.08) of the jejunum of broiler chickens at 20 d of age. In contrast, Wang et al. (2015) reported that dietary protein source and ND did not have any effect on the length of small intestine and intestinal
morphology. Zhu et al. (2014) reported that enzyme
supplementation improved intestinal morphology in broiler chickens. Our data showed that enzyme supplementation increased duodenum, jejunum and ileum villus height at 5 and/or 10 d chicks. Increased villus height may indicate a general increase in the digestive and absorptive capacity of the small intestine in
Table 5 – Effect of three nutrient densities (ND) and different feed additives (FA) in starter diet on total anti-SRBC, IgG, and IgM titers of 35 and 42 d broiler chickens
Total anti-SRBC (mg/dL) IgG (mg/dL) IgM (mg/dL)
ND % FA 35d 42d 35d 42d 35d 42d
100.00 No 6.33c 7.83bc 4.00b 5.33cd 2.33b 2.50
100.00 Maxi1 6.33c 8.00abc 4.50ab 5.17d 1.83b 2.83
100.00 (Mx+Sz+P)2 7.83ab 8.50abc 5.83a 6.50ab 2.00b 2.00
103.75 No 6.83bc 9.00ab 5.33ab 6.33abc 1.50b 2.67
103.75 Maxi 7.00bc 8.00abc 4.50ab 5.33cd 2.50b 2.67
103.75 (Mx+Sz+P) 7.00bc 8.50abc 4.50ab 5.67bcd 2.50b 2.83
107.50 No 6.67bc 7.67c 4.33ab 5.83abc 2.33b 1.83
107.50 Maxi 7.33abc 9.17a 5.50ab 7.00a 1.83b 2.17
107.50 (Mx+Sz+P) 8.33a 8.50abc 4.67ab 5.50bcd 3.67a 3.00
SEM3 0.41 0.38 0.48 0.33 0.31 0.37
Main Effect Means4 ND
100.00 6.83 8.11 4.78 5.67 2.06b 2.44
103.75 6.94 8.50 4.78 5.78 2.17ab 2.72
107.50 7.44 8.44 4.83 6.11 2.61a 2.33
FA
No 6.61b 8.17 4.56 5.83 2.06b 2.33
Maxi 6.89b 8.39 4.83 5.83 2.06b 2.56
(Mx+Sz+P) 7.72a 8.50 5.00 5.89 2.72a 2.61
SEM 0.24 0.22 0.27 0.19 0.18 0.22
p-value
ND 0.169 0.411 0.986 0.247 0.080 0.427
FA 0.006 0.558 0.516 0.973 0.015 0.630
ND × FA 0.020 0.097 0.13 0.003 0.001 0.321
Orthogonal polynomials ND
Linear 0.224 0.189 0.934 0.245 0.137 0.753
Quadratic 0.146 0.860 0.887 0.227 0.087 0.208
FA
Linear 0.022 0.310 0.288 0.907 0.137 0.348
Quadratic 0.018 0.724 0.669 0.839 0.012 0.856
a, b Means in the same column with no common superscript for each effect are significantly different at p≤0.05. 1 Maxi-GenTM Plus at the rate of 0.5 g/kg diet. 2 (Maxi-GenTM Plus,
response to the greater flow of nutrients. Amino acids, in addition to being components of proteins, regulate essential metabolic routes for maintenance, growth, and immunity. Also, they regulate gene expression and the synthesis of hormones and molecules of great biological importance such as glutathione, nitric acid, polyamines, and purine and pyrimidine nucleotides (Li
et al., 2007).
Immune response
The main effects of ND and FA in the starter diet and their interaction on total anti-SRBC, IgG, and IgM titers of broiler chickens at 35 and 42 d of age are shown in Table 5. Feeding starter diet containing 107.5% ND and Maxi+Sz+P increased total anti-SRBC
titers (p=0.020) compared with those fed control or
other diets, with the exception of those fed the diet containing 107.5% ND and supplemented with Maxi-Gen at 35 d of age. The inclusion of Maxi-Maxi-Gen alone in starter diet with 107.5% ND increased total anti-SRBC titers (p=0.097) and IgG (p=0.003) of chicks compared with those fed control and the other diets at 42 d of age. Panda et al. (2011) reported that diets containing 1.1% Lys compared to 1.4% significantly reduced humoral immune response in broiler chickens. The ND can affect the genes expression that responsible for immune response (Klasing & Barnes, 1988) by altering the magnitude of antibody production and maturity of immune system (Latshaw, 1991). As antibodies are proteins, any essential amino acid deficiency especially during the growing period results in poor
immune competence (Latshaw, 1991). Cowieson et al.
(2017) based on gene expression patterns in jejunal tissue suggested that both dietary protein source and exogenous protease influence the expression of genes responsible for mucin secretion, amino acid transport and immune functionality in an age dependent manner.
CONCLUSION
It is concluded that higher nutrient density and the supplementation with the tested feed additive and its combination with a commercial enzyme blend and a phytase in starter diet can improve the overall growth performance of broiler chickens. The starter diet containing 107.5% ND and supplemented with
Maxi-Gen or Maxi+Sz+P promoted better (p<0.05) BWG
and FCR compared with those fed the control diet or that with 103.75% ND at 42 d of age. The present study showed that ND and FA supplementation did not have any effect (p>0.05) on the ileal microflora counts,
but increased cecal beneficial bacteria counts (p<0.05) of 10 d chicks. Duodenal and jejunal villus height and VCR increased (p<0.05) when broiler chicks were fed starter diet containing 103.75% and 107.5% ND at 5 and 10 d of age. The supplementation with the additive combination increased (p<0.05) duodenal and jejunal villus height at 5 d of age. Immune responses were enhanced with increasing ND and Maxi+Sz+P supplementation in the starter diet.
ACKNOWLEDGMENTS
The authors would like to thank the Vice President in Research and Technology, at the Ferdowsi University of Mashhad, for the funding of this study (Project # 37844). Our appreciation is also extended to the Canadian bio-systems INC. Calgary, Alberta for their contribution of the feed additives.
REFERENCES
Adedokun SA, Parsons CM, Lilburn MS, Adeola O, Applegate TJ. Endogenous amino acid flow in broiler chicks is affected by the age of birds and method of estimation. Poultry Science 2007;86:2590-2597.
Bach Knudsen KE. Carbohydrate and lignin contents of plant materials used in animal feeding. Animal Feed Science and Technology 1997;67:319-338.
Barekatain MR, Swick RA. Composition of more specialised pre-starter and starter diets for young broiler chickens:a review. Animal Production Science 2016;56:1239-1247.
Burnett GS. Studies of viscosity as the probable factor involved in the improvement of certain barleys for chickens by enzyme supplementation. British Poultry Science 1996;7:55-75.
Chen X, Zhang Q, Applegate TJ. Impact of dietary branched chain amino acids concentration on broiler chicks during aflatoxicosis. Poultry Science 2016;95(6):1281-1289.
Choct M, Hughes RJ, Wang J, Bedford MR, Morgan AJ, Annison G. Increased small intestinal fermentation is partly responsible for the anti-nutritive activity of non-starch polysaccharides in chickens. British Poultry Science 1996;37(3):609-621.
Cowieson AJ. Factors that affect the nutritional value of maize for broilers. Animal Feed Science and Technology 2005;77:345-353.
Cowieson AJ, Lu H, Ajuwon KM, Knap I, Adeola O. Interactive effects of dietary protein source and exogenous protease on growth performance, immune competence and jejunal health of broiler chickens. Animal Production Science 2017;57(2):252-261.
Everaert N, Swennen Q, Coustard SM, Willemsen H, Careghi C, Buyse J, et al. The effect of the protein level in a pre-starter diet on the post-hatch performance and activation of ribosomal protein s6 kinase in muscle of neonatal broilers. British Journal of Nutrition 2010;103:206-211.
Józefiak D, Rutkowski A, Martin SA. Carbohydrate fermentation in the avian ceca – A review. Animal Feed Science and Technology 2004;113:1-15.
Klasing KC, Barnes DM. Decreased amino acid requirements of growing chick due to immunological stress. Journal of Nutrition 1988;118:1158-1164.
Kidd MT, McDaniel CD, Branton SL, Miller ER, Boren BB, Fancher BI. Increasing amino acid density improves live performance and carcass yields of commercial broilers. Journal of Applied Poultry Research 2004;13:593-604.
Kim SJ, Lee KW, Kang CW, An BK. Growth performance, relative meat and organ weights, cecal microflora, and blood characteristics in broiler chickens fed diets containing different nutrient density with or without essential oils. Asian Australian Journal of Animal Science 2016;29(4):549-554.
Latshaw JD. Nutrition-mechanisms of immunosuppression. Veterinary Immunology and Immunopathology 1991;30:111-112.
Li P, Yin YL, Li DF, Kim SW, Wu G. Amino acids and immune function. Journal of Nutrition 2007;98:237-252.
Noy Y, Sklan D. Post hatch development in poultry. Journal of Applied Poultry Research 1997;6:344-354.
Noy Y, Uni Z. Early nutritional strategies. World’s Poultry Science Journal 2010;66:639-646.
Panda AK, Rama Rao SV, Raju MVLN, Lavanya G, Pradeep Kumar Reddy E, et al. Early growth response of broilers to dietary lysine at fixed ratio to crude protein and essential amino acids. Asian Australian Journal of Animal Science 2011;24(11):1623-1628.
Powell DJ, Velleman SG, Cowieson AJ, Muir WI. Methionine concentration in the pre-starter diet:its effect on broiler breast muscle development. Animal Production Science 2016;57(3):448-457.
Sklan D, Noy Y. Crude protein and essential amino acid requirements in chicks during the first week post hatch. British Poultry Science 2003;44:266-274.
Swennen Q, Everaert N, Debonne M, Verbaeys I, Careghi C, Tona K, et al. Effect of macronutrient ratio of the pre-starter diet on broiler performance and intermediary metabolism. Journal of Animal Physiology and Animal Nutrition 2010;94:375-384.
Van der Wielen PW, Biesterveld S, Notermans S, Hofstra H, Urlings BAP, van Knapen F. Role of volatile fatty acids in development of the cecal microflora in broiler chickens during growth. Journal of Applied & Environmental Microbiology 2000;66:2536-2540.
Wang X, Peebles ED, Morgan TW, Harkess RL, Zhai W. Protein source and nutrient density in the diets of male broilers from 8 to 21 d of age: effects on small intestine morphology. Poultry Science 2015;94:61-67.
Willemsen H, Everaert N, Witters A, De Smit L, Debonne M, Verschuere F, et al. Critical assessment of chick quality measurements as an indicator of post hatch performance. Poultry Science 2008;87:2358-2366.
Yang Y, Iji PA, Kocher A, Mikkelsen LL, Choct M. Effects of Mannan oligosaccharide on growth performance, the development of gut microflora, and gut function of broiler chickens raised on new litter. Journal of Applied Poultry Research 2007;16:280-288.
Zhai W, Peebles ED, Zumwalt CD, Mejia L, Corzo A. Effects of dietary amino acid density regimens on growth performance and meat yield of Cobb × Cobb 700 broilers. Journal of Applied Poultry Research 2013;22:447-460.
Zhai W, Peebles ED, Mejia L, Zumwalt CD, Corzo A. Effects of dietary amino acid density and metabolizable energy level on the growth and meat yield of summer reared broilers. Journal of Applied Poultry Research 2014;23:501-515.
Zhu HL, Hu LL, Hou YQ, Zhang J, Ding BY. The effects of enzyme supplementation on performance and digestive parameters of broilers fed corn-soybean diets. Poultry Science 2014;93:1704-1712.