Recebido para publicação em 28/3/2009 Aceito para publicação em 8/7/2009 (004133)
1 Universidade Estadual de Ponta Grossa – UEPG, Campus Uvaranas, Av. General Carlos Cavalcanti, 4748, CEP 84030-900, Ponta Grossa - PR, Brasil, E-mail: [email protected]
*A quem a correspondência deve ser enviada
Foresight of physical-chemical characteristics of apple juice
blends appointed to sparkling drink elaboration
Previsão das propriedades físico-químicas de misturas de sucos de maçãs
destinadas à elaboração de espumantes
Catherine Valente de CARVALHO1*, Nelci Catarina CHIQUETTO1
1 Introduction
In Brazil, there is no apple production intended only for industrial use. In Brazilian cider production, only table fruits are used, i.e., apples that have desirable features for in natura consumption but, due to some deformities, were discarded of the trade (WOSIACKI, 2002).
For the sparkling drink elaboration, it is desirable that the must hold a combination of high acidity with high content of phenolic compounds and sugar, besides fruity aroma. This combination of parameters is not achieved in a single apple cultivar, being necessary the use of individual characteristics of each cultivar in blends (JORGE; TREPTOW; ANTUNES, 1998). According to Wosiacki and Nogueira (2005), some cultivars currently used as pollinating have more significant levels of
organic acids and phenolic compounds and can be used in processed juice blends to give “body” to the beverages produced.
The most indicated statistical method to a blend elaboration is the component blend design, which adjusts models to represent the response on a surface. The goal of the method is to find a model that describes the physical-chemical characteristics of blends with the smallest error margin possible, when compared to the real results of the experiments. The simplest model of this design is the linear, which tries to explain the behavior of a property only with the results obtained with the utilization of each component individually. Besides this model, the design can be raised to quadratic and special cubic levels. In the former, one must employ the results of the interaction effects between two components, whereas in the latter, the effects of Resumo
O objetivo desta pesquisa foi utilizar o planejamento para misturas de componentes aliado à metodologia de superfície de resposta para prever o efeito da mistura ternária de sucos de maçãs (cultivares Catarina, Granny Smith e Pink Lady) nas características físico-químicas de mostos destinados à elaboração de espumantes. Foram formuladas 12 misturas (3 amostras individuais, 3 misturas binárias e 6 ternárias), as quais foram analisadas quanto ao teor de açúcares redutores totais, acidez total titulável e compostos fenólicos e ajustados, respectivamente, aos modelos linear, quadrático e cúbico especial. Os resultados foram organizados em gráficos ternários de superfície de resposta e, a partir da sobreposição destes gráficos, foi determinada uma região viável que delimitou a gama de composições de sucos de maçãs que formulam mostos físico-quimicamente aptos para a elaboração de espumantes. Para representar as diversas combinações possíveis, foi calculado o ponto central da área triangular da região viável e este ponto, que representa as proporções de 23,22% da cultivar Catarina, 66,23% da cultivar Granny Smith e 10,55% da cultivar Pink Lady, foi escolhido para constituir a formulação do mosto a ser utilizado na elaboração de espumantes de maçã. Palavras-chaves: mistura; planejamento estatístico; mosto; maçã.
Abstract
The purpose of this research was to combine the use of the component blend design to the response surface methodology, in order to foresee the effect of ternary apple juice blends (Catarina,GrannySmith and PinkLady cultivars) on the physical-chemical characteristics of musts appointed to sparkling drink elaboration. Twelve mixes were made (three individual samples, three binary mixes and six ternary mixes), analyzed on the content of total reducing sugars, total titratable acidity and phenolic compounds; and adjusted, respectively, to the linear, quadratic and special cubic models. The results were organized in ternary charts of surface response and, from the overlap of these charts, it was determined a viable region which delimited the range of apple juice compositions that make musts physically and chemically suitable to sparkling drink elaboration. To represent the various possible combinations, the central point of the triangular area of the viable region was calculated and, this point, which represents the proportions of 23.22% of Catarina, 66.23% of Granny Smith and 10.55% of Pink Lady cultivars, was chosen to constitute the formulation of the must to be used in the elaboration of apple sparkling drinks.
Keywords: blend; statistical design; must; apple.
3 Results and discussion
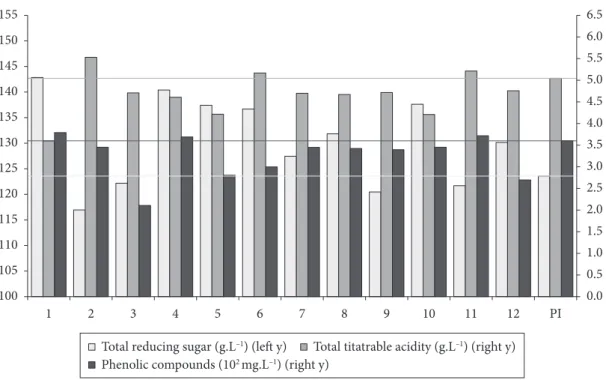
Figure 1 shows the values of total reducing sugars, total acidity and phenolic compounds for the 12 assays made, besides the representative point of the viable region (Intersection Point – IP).
Analyzing the chart (Figure 1), one can observe that the cultivar Catarina (assay 1) shows up more clearly, with higher content of total reducing sugars, than the other cultivars: Granny Smith and Pink Lady (assays 2 and 3, respectively), which have high acidity, in agreement with the reasons given for their selections.
According to Jorge, Treptow and Antunes (1998), cultivars with high degree of aroma generally have low acidity, so it must be mixed with higher acidity cultivars. The Pink Lady cultivar was selected for having more fruity aroma, in addition to its relatively high acidity (4.70 g.L–1).
From the results obtained for the different compositions, it was possible to generate regression models at different levels, correlating the proportions of the apples juices to the results of the parameters studied. The models for each parameter were chosen from the validation of these models in a significance level of 95%. For each property, different regression models were generate and evaluated by variance analysis (ANOVA). Table 2 shows the statistic parameters used to analyze the linear, quadratic and special cubic models for all variables.
To evaluate whether the models had a significant regression in the confidence level of 95%, the F values obtained (related to regression and to the models fit) were compared to the respective F tabulated values. The R2 value, which represents the variation
explained by the model, had to be as close as possible to the maximum explainable value.
The residue charts of each model were seen as random, and, for better representation of data, the chart should display randomly. These parameters were observed in all models of each variable and the model that was significant for all parameters interaction of three compounds must be used (BARROS NETO;
SCARMINIO; BRUNS, 2007).
This research had as objective to foresee the physical-chemical characteristics of ternary blends of apple juices using the component blend design with the response surface methodology, where the selection of the cultivars was based on the physical-chemical characteristics that better adapt to the requirements of a must intended to sparkling drink elaboration.
2 Materials and methods
2.1 Raw materials
Three apple cultivars were selected to the elaboration of the ternary blend design, namely, Catarina, Granny Smith and Pink Lady. The Catarina cultivar was selected because it has a high content of phenolic compounds (377.97 mg.L–1)
and total reducing sugars (142.86 g.L–1). The Granny Smith
and Pink Lady cultivars were selected for having high acidity (5.52 and 4.70 g.L–1, respectively). The Pink Lady has fruity
aroma as well. All of the cultivars were from the 2007/2008 harvests of the State of Santa Catarina and were provided by the company ‘Agrícola Fraiburgo Ltda’ (Videira - SC, Brazil).
The selected apples were washed in running water and crushed in a manual processor. The juice obtained was kept frozen (–20 °C) until the time of the analysis
2.2 Physical-chemical analysis
The total reducing sugars analysis was performed by the Somogyi-Nelson colorimetric method, and the result was expressed in g.L–1 (TANNER; BRUNNER, 1985). For
the determination of total titratable acidity, the technique of the ‘Instituto Adolfo Lutz’ was used, and the result was expressed as malic acid in g.L–1 (INSTITUTO..., 2008). The
phenolic compounds were analyzed colorimetrically with the reagent Folin-Ciocalteau and expressed in mg.L–1 of catechin
(SINGLETON; ORTHOFER; LAMUELA-RAVENTOS, 1999).
2.3 Components blend design
Initially, the linear models for all properties considered were tested and these models were adjusted to more complex ones (quadratic and especial cubic) as a need to make them more meaningful.
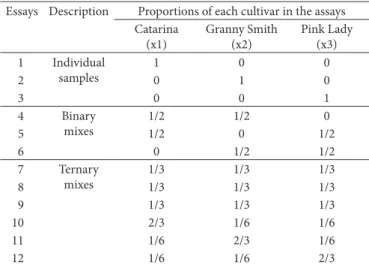
For the determination of the equation coefficients, 12 experimental essays were used, where the blends proportions were defined by use of the components blend design, as Table 1. The blends were made with the juices of Catarina, Granny Smith and Pink Lady cultivars, represented by x1, x2 and x3, respectively. The sum of the percentages of these samples met the restriction mentioned by Bruns, Scarminio and Barros Neto (2001) where the sum should be equal to 1.
The response variables used in the design were: total reducing sugars (TRS), total titratable acidity (TTA) and phenolic compounds (PC). The results were organized in charts and analyzed by the response surface methodology.
Table 1. Proportions of each cultivar in the elaboration of 12 experimental assays, by use of the components blend design.
Essays Description Proportions of each cultivar in the assays Catarina (x1) Granny Smith (x2) Pink Lady (x3) 1 Individual samples
1 0 0
2 0 1 0
3 0 0 1
4 Binary mixes
1/2 1/2 0
5 1/2 0 1/2
6 0 1/2 1/2
7 Ternary mixes
1/3 1/3 1/3
8 1/3 1/3 1/3
9 1/3 1/3 1/3
10 2/3 1/6 1/6
11 1/6 2/3 1/6
the residual graphics of these models showed a linear trend, demonstrating that the model is not signifi cant.
To the phenolic compounds variable, all models had a signifi cant regression, but all of them had lack of fi t, too. Nevertheless, the especial cubic model had the lowest error among the three models (24.816) and the best explanation of variation percentage (97.90 of 99.95% possible).
Aft er discarding the not signifi cant coeffi cients, a simplifi ed equation for each property considered was obtained, resulting in a linear model for the total reducing sugars variable (Equation 1), quadratic model for the total titratable acidity (Equation 2) and special cubic model for the phenolic compounds (Equation 3).
1 2 3
142.857 116.891 122.185
TRS= ×x + ×x + ×x (1)
mentioned above, was chosen to represent the variable in question.
Th e fruity aroma is also an important parameter of must defi nition. However, as the aroma analysis has no numerical results, it was not possible to add it as a variable on the research, although this characteristic was also taken into account when choosing the ideal formulation.
Analyzing Table 2 data, we can see that no model had lack of fi t for the total reducing sugar variable, but just the linear model had signifi cant regression. To the variable total titratable acidity, all models had signifi cant regression and just the quadratic and special cubic models had not had lack of fi t. Th e third order interaction of the special cubic model was very low (0.465), not infl uencing signifi cantly the model, though. In addition,
Table 2. Variance analysis (ANOVA) of regression models made to the variables total reducing sugar, total titratable acidity and phenolic compounds.
Variables Model Test F F tabulated
(5%)
Test F to lack of fi t
Flf tabulated (5%)
R2 explained
variation R2
ex explainable
varitation
Total reducing sugar Linear 13.684a 5.140 0.273d 19.250 0.8202 0.8837
Quadratic 1.432b 4.390 7.002d 19.250 0.5441 0.9696
Special cubic 5.050b 4.950 0.427d 19.160 0.8584 0.9136
Total titratable acidity Linear 99.281a 5.140 36.208c 19.250 0.9707 0.9996
Quadratic 238.595a 4.390 6.694d 19.250 0.9950 0.9997
Special cubic 225.112a 4.950 6.398d 19.160 0.9963 0.9997
Phenolic compound Linear 13.980a 5.140 161.903c 19.250 0.8233 0.9995
Quadratic 11.992a 4.390 85.409c 19.250 0.9090 0.9995
Special cubic 38.791a 4.950 24.816c 19.160 0.9790 0.9995
Label: aSignifi cant regression; bNot signifi cant regression; cTh ere is a lack of adjustment in the model; dTh ere is no lack of fi t in the model. Analysis based on a confi dence level of 95%.
Figure 1. Average values of TRS, TTA and PC to the diff erent assays established by the components blend design, applied to the three apples cultivars (Catarina, Granny Smith and Pink Lady). Label: TRS - total reducing sugars (10 g.L–1) on the left y axis; TTA – total titratable acidity
(g.L–1 in malic acid) on the right y axis; PC – phenolic compounds (102 mg.L–1) on the right y axis. Values relative to all assays made (1 to 12) and
1 2 3 1 2
1 3 2 3
3.589 5.517 4.697 0.222
0.266 0.222
TTA x x x x x
x x x x
= × + × + × + × ×
+ × × + × × (2)
1 2 3 1 2
1 3 2 3 1 2 3
377.971 344.927 209.565 32.868
50.252 89.293 673.591
PC x x x x x
x x x x x x x
= × + × + × + × ×
− × × + × × + × × × (3)
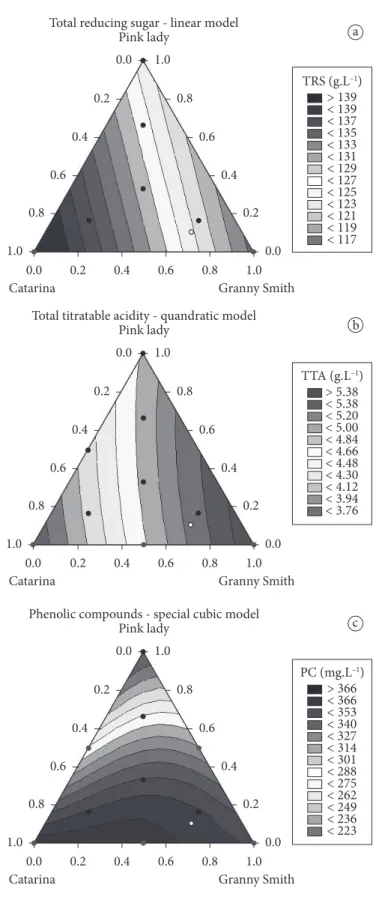
From the regression models, ternary diagrams of response surfaces were made for each studied variable. Figure 2a shows the total reducing sugar, Figure 2b the total titratable acidity and Figure 2c the phenolic compounds variable.
Th e highest concentration of total reducing sugar was found in the compositions with the highest levels of the Catarina cultivar, in other words, near the vertex that represents this juice (Figure 2a). Th is fact that can also be observed in Equation 1, where the highest parameter is the one that represents the proportion of the cultivar Catarina (x1).
To the total titratable acidity variable, the Granny Smith and Pink Lady cultivars contributed to the increase of juice acidity (Figure 2b). In Equation 2, the greatest parameters were those that represented the individual proportions of the cultivars Granny Smith (x2) and Pink Lady (x3), as observed in Figure 2b. Besides, in these models, it is observed that, as all interaction binary coeffi cients are positive, the binary species interacted synergistically, i.e., the interaction between the juices contributed to increase the acidity.
Figure 2c shows that the higher the Catarina and Granny Smith cultivars proportions, the higher the phenolic compounds content of the blend. In Equation 3, the parameter of interaction between Catarina and Pink Lady cultivars (x1 × x3) showed a negative value, demonstrating that the binary interaction contributes to decrease the phenolic compounds content of the blend (antagonistic interaction). Nevertheless, the signifi cant value of the ternary interaction variable (x1 × x2 × x3) showed the substantial contribution of the blend to the increase of the phenolic compounds content.
Th e ideal blend under study must provide the highest possible values in all studied parameters, in conformity with what is necessary for a good sparkling drink. According to Rizzon, Meneguzzo and Gasparin (2005), the must has to show high acidity, high content of phenolic compounds and sugars, plus a highly fruity aroma.
To delimit the minimum values for the studied parameters, the following values were used: minimum of 123.0 g.L–1 of total
reducing sugar, once this is the quantity of sugar necessary to obtain a 7.0 %v/v alcohol wine (considering a conversion of 17.5 gL–1 for each alcoholic degree); minimum of 5.0 g.L–1 of
acidity in malic acid, since Brazilians high quality sparkling drinks have around 75.0 meq.L–1 of total acidity (RIZZON;
MENEGUZZO; GASPARIN, 2005); and minimum of 340.0 mg.L–1 of phenolic compounds, where the value was
defi ned by the conditions established at the charts intersection.
With the boundaries, a viable region was demarcated (gray region in Figure 3) representing an intersection area between all variables, where it is possible to fi nd minimum and maximum proportions for each used juice, so that all variables have values within the pre-established standards. From this region, a central
Figure 2. Response surfaces ternary diagrams concerning the variables: a) TRS; b) TTA; c) PC. Label: TRS - total reducing sugar (10 g.L–1);
b) TTA - total titratable acidity (g.L–1 malic acidity); c) PC - phenolic
compounds (102 mg.L–1). Th e points represents: the necessary assays
of 132.3 and 117.8 g.L–1 of total reducing sugar, 3.3 and 3.6 g.L–1
of total titratable acidity and 340.0 and 316.0 mg.L–1 of phenolic
compounds, respectively.
Based on these results, one can verify that the total reducing sugar value of the must made with the blend it is within the values presented by the authors. Th e blend acidity proved to be considerably above the indicated average, what is a positive point of the blend, since the intention was to obtain a must with high acidity. Regarding to the phenolic compounds content, it is believed that the use of a cultivar with more signifi cant values of this variable in the formulation of the blend, would make the must more interesting; once, according to Rizzon, Meneguzzo and Gasparin (2005), for the elaboration of a quality sparkling drink, a must with high content of phenolic compounds is necessary, and the value obtained for this variable was very close to the values found by the authors.
4 Conclusions
Th e application of the components blend design, allied to the response surface methodology, allowed to defi ne a range of apple juice compositions that make a must able to be employed in the sparkling apple drink preparation.
To the studied situation and according to the established models, the proportion of the blends that provides the physical-chemical characteristics more suited to the sparkling development, i.e., a must that holds high values for the properties total reducing sugars, total titratable acidity and phenolic compounds and has fruity aroma, should be composed, on average, by the following blend: 23.22% of the cultivar Catarina, 66.23% of the cultivar Granny Smith and 10.55% of the cultivar Pink Lady, being this the central point among the many combinations that satisfy the pre-set restrictions.
To obtain a must with more specifi c characteristics, like a high content of phenolic compounds, for example, it would be interesting to use another apple cultivar that has more expressive value of this characteristic. In this case, however, all the design must be performed again.
Acknowledgements
Th e authors would like to thank the ‘Universidade Estadual de Ponta Grossa’ for the support and the ‘Agrícola Fraiburgo Ltda’ for the yielded infrastructure and for the grants supplied for the development of this research.
References
BARROS NETO, B.; SCARMINIO, I. S.; BRUNS, R. E. Como fazer experimentos: pesquisa e desenvolvimento na ciência e na indústria. 3. ed. Campinas: Unicamp, 2007. 480 p.
BRUNS, R. E.; SCARMINIO, I. S.; BARROS NETO, B. Como fazer experimentos: pesquisa e desenvolvimento na ciência e na indústria. Campinas: Unicamp, 2001.
INSTITUTO ADOLFO LUTZ - IAL. Métodos físicos e químicos para análise de alimentos. In: IAL. Normas analíticas. 4. ed. São Paulo: Instituto Adolfo Lutz, 2008. 1020 p.
JORGE, Z. L. C.; TREPTOW, R. O.; ANTUNES, P. L. Avaliação físico-química e sensorial de suco de maçãs cultivares fuji, granny smith e
point was calculated (identifi ed as IP – intersection point), being this point just one of all possible compositions that satisfy the restrictions.
Analyzing the viable region, it is observed that to satisfy the restrictions: i) the Catarina cultivar must be used in a maximum of 29.19% and, in this case, the Granny Smith cultivar must be used in 70.81% and the Pink Lady in 0.00%; ii) the Granny Smith cultivar must be used in a maximum of 76.47% and, in this case, the cultivar Catarina must be used in 23.54% and the Pink Lady in 0.00%; iii) the Pink Lady cultivar must be used in a maximum of 31.66% and, in this case, the Catarina cultivar must be used in 16.94% and the Granny Smith in 51.40%. Th ese three points refer to the three vertexes of the triangle that represents the viable region.
Th e intersection point (IP) represented by the blue point on Figure 3, represents the percentages 23.22% of Catarina cultivar, 66.23% of Granny Smith cultivar and 10.55% of Pink Lady cultivar and it was chosen to represent the results, i.e., these proportions was chosen to, subsequently, make the must to be submitted to fermentation process. According to the obtained models, the juice made with these proportions should have the following characteristics: 123.48 g.L–1 of total reducing sugar,
5.04 g.L–1 of total titratable acidity and 359.31 mg.L–1 of phenolic
compounds, values that satisfy the established restrictions in this work for sparkling drink preparation. Th e usage of this point is justifi ed because it is within the specifi ed limits of the viable region and because it is a central point of this area.
TA N N E R , H . ; B RU N N E R , H . R . G e t r ä n k e a n l y t i k : untersuchungsmethode für dia Labor und Betriebspraxis. Wädesnwill: Verlag Helles, 1985. 206 p.
WOSIACKI, G. Apple varieties growing in subtropical areas: the situation in Santa Catarina – Brazil. Fruit Processing, Schönborn, v. 12, n. 1, p. 19-28, jan. 2002.
WOSIACKI, G.; NOGUEIRA, A. Suco de maçã. In: FILHO, W. G. V. (Org.). Tecnologia de bebidas: matéria prima, processamento, BPF/APPCC, legislação e mercado. São Paulo: Edgard Blücher, 2005. cap. 12. p. 255-292.
WOSIACKI, G.; PHOLMAN, B. C.; NOGUEIRA, A. Características de qualidade de cultivares de maçã: avaliação físico-química e sensorial de quinze cultivares. Ciência e Tecnologia de Alimentos. Campinas, v. 24, n. 3, p. 347-352, jul./set. 2004.
seus “blends”. Revista Brasileira de Agrociência, v. 4, n. 1, p. 15-19, jan./abr. 1998.
PAGANINI, C. et al. Análise da aptidão industrial de seis cultivares de maçãs, considerando suas avaliações físico-químicas (dados da safra 2001/2002). Ciência Agrotecnológica, Lavras, v. 28, n. 6, p. 1336-1343, nov./dez. 2004.
RIZZON, L. A; MENEGUZZO, J.; GASPARIN, A. M. Elaboração do vinho moscatel espumante. Bento Gonçalves: Embrapa Uva e Vinho, 2005. 42 p.