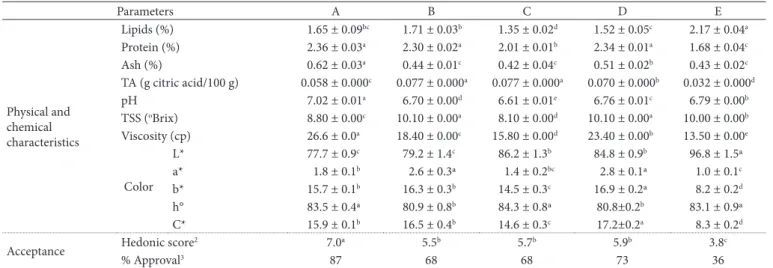
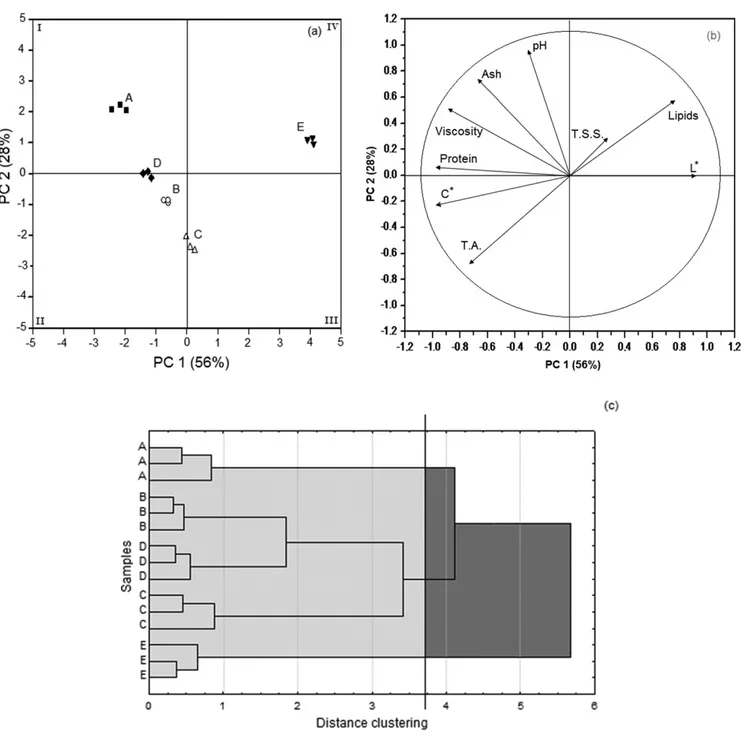
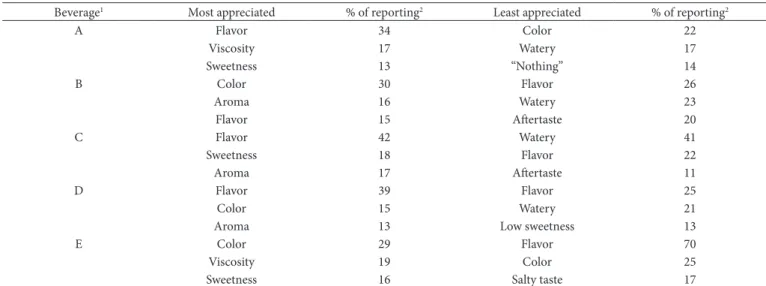
Soymilk plain beverages: correlation between acceptability and physical and chemical characteristics
Texto
Imagem


Documentos relacionados
Quadro 18 – Valores de custos totais das operações necessárias para a implantação do sistema silvipastoril eucalipto + pecuária leiteira na Zona da Mata de Minas Gerais
Por isso, este trabalho tem como objetivo estender o SGBD PostgreSQL/Postgis com novos tipos de dados para representação de trajetória semântica.. Para facilitar a
Em sua pesquisa sobre a história da imprensa social no Brasil, por exemplo, apesar de deixar claro que “sua investigação está distante de ser um trabalho completo”, ele
Em 2003, foi proposto um modelo de atenção à saúde de pessoas com condições crônicas pela Organização Mundial de Saúde, considerando as singularidades do cuidado
This log must identify the roles of any sub-investigator and the person(s) who will be delegated other study- related tasks; such as CRF/EDC entry. Any changes to
Cometeu a acusada, a Senhora Presidente da República, Dilma Vana Rousseff, os crimes de responsabilidade correspondentes à tomada de empréstimos junto à instituição
• The VL skills have been specified as (a) to read/ decode/interpret visual statements, and (b) to write/encode/create visual statements. • The VL skills are not isolated from
Nesta pesquisa objetivou-se verificar a existência de setor de controle interno em uma entidade “sui generis” – autarquia, que possui a ordem personalidade jurídica própria –
