H
ybrid squash Tetsukabuto is an interspecific hybrid, male sterile, resulting from crossbreeding between squash lines (Cucurbita maxima) (female parent) and pumpkin lines (C. moschata) used as the male parent(Sediyama et al., 2009).
Cultivation and consumption of Tetsukabuto squash has shown great expansion in Brazil. According to Sediyama et al. (2009), this increase
is due to positive characteristics of growing (rusticity, earliness, uniformity and high productive potential), high nutritional quality, excellent organoleptic characteristics, great cooking versatility and extended postharvest conservation of fruits, especially when compared to open-pollinated squash cultivars.
Among the essential elements for the production, water and nutrients are the ones that more frequently limit crop yield (Mohammad, 2004; Vidal et al.,
2013). Concerning irrigated agriculture, application of nitrogen (N) is closely related to water management, being the main responsible for the efficiency of N use by the plants (Shock et al., 2007;
Vidal et al., 2013). Whereas the water
deficit in the soil limits the solubilization and the transport of N through mass flow to the roots, excess irrigation favors leaching.
Although the squash crop is moderately tolerant to water deficit (Kemble & Sanders, 2000), irrigation allows productivity gains, especially in regions characterized by irregular
rainfall distribution and soils with low water-holding capacity (Napier, 2009; Fandika et al., 2011). Yields can also
be adversely affected by excess water, which reduces soil aeration, promotes nutrient leaching and increases disease occurrence (Shock et al., 2007; Zvalo &
Respondek, 2007; Amer, 2011; Aegerter
et al., 2013).
The fruit growth stage is the most sensitive to water deficit, considering the cultivation cycle of the squash, followed by flowering and fruit setting. According to Zvalo & Respondek (2007) and Napier (2009), fruit setting rate and fruit growth are directly controlled by soil water availability.
Among irrigation systems, sprinkler irrigation is the most used in squash
MAROUELLI, WA; AMARO, GB; BRAGA, MB. 2017. Response of hybrid squash Tetsukabuto to water depths and doses of nitrogen. Horticultura Brasileira
35: 402-409. DOI - http://dx.doi.org/10.1590/S0102-053620170314
Response of hybrid squash Tetsukabuto to water depths and doses of nitrogen
Waldir A Marouelli; Geovani B Amaro; Marcos B Braga
Embrapa Hortaliças, 70275-970 Brasília-DF, Brasil; [email protected]; [email protected]; [email protected]
ABSTRACT
The aim of this work was to evaluate, under the Cerrado
conditions of Central Brazil, the effect of different amounts of water and nitrogen (N) on the production performance of hybrid squash Tetsukabuto. Five water depths were tested in 2008 (185, 265, 343, 408 and 477 mm) and four in 2009 (286, 360, 430 and 540 mm), using line source sprinkler irrigation. The doses of N (0, 50, 100, 150 and 200 kg/ha) were the same in both experiments. The experimental design was a split-plot strip block with three replications. Fruit productivity was affected by the interaction between water depths and doses of N. Higher marketable productivity was observed on plants cultivated with the use of 477 and 492 mm of water and 105 and 146 kg/haof N in 2008 and 2009, respectively. Ninety-five percent of the maximum productivity was reached by using 422 and 442 mm of water and 62 and 96 kg/ha of N in 2008 and 2009, respectively. The soil water tension thresholds, associated with the water depths that enabled 95 to 100% of the maximum productivity, ranged from 24 to 55 kPa. Higher water use efficiency occurred for water depths of 334 and 423 mm and doses of N of 90 and 120 kg/ha in 2008 and 2009, respectively. The use efficiency of applied N improved with increasing water depth and decreasing dose of N. Density, total soluble solids content and fruit pulp yield neither were affected by water depths nor by the doses of N.
Keywords: Cucurbita maxima x C. moschata, squash, sprinkler line.
RESUMO
Resposta da abóbora híbrida tipo Tetsukabuto a lâminas de água e doses de nitrogênio
O objetivo deste trabalho foi avaliar a resposta da abóbora híbrida tipo Tetsukabuto a diferentes lâminas de água e doses de nitrogênio (N), nas condições de Cerrado do Brasil Central. Foram testadas cinco lâminas de água em 2008 (185, 265, 343, 408 e 477 mm) e quatro em 2009 (286, 360, 430 e 540 mm), usando aspersão em linha, e cinco doses de N (0, 50, 100, 150 e 200 kg/ha) nos dois experimentos. O delineamento foi em faixas, com parcela subdividida e três repetições. A produtividade de frutos foi influenciada pela interação entre lâmina de água e dose de N. Maior produtividade comercial foi obtida em plantas cultivadas com 477 e 492 mm de água e 105 e 146 kg/ha de N em 2008 e 2009, respectivamente. Da produtividade máxima, 95% foram alcançados com 422 e 442 mm de água e 62 e 96 kg/ha de N em 2008 e 2009, respectivamente. As tensões-limite de água no solo, associadas às lâminas que possibilitaram 95 a 100% da produtividade máxima, variaram de 24 a 55 kPa. Maior eficiência de uso de água ocorreu para as lâminas de 334 e 423 mm e doses de N de 90 e 120 kg/ha em 2008 e 2009, respectivamente. A eficiência de uso de N aplicado aumentou com o acréscimo da lâmina de água e a diminuição da dose de N. Densidade, teor de sólidos solúveis totais e rendimento de polpa de frutos não foram influenciados pelas lâminas de água nem doses de N.
Palavras-chave: Cucurbita maxima x C. moschata, moranga,
aspersão em linha.
production, especially in wavy topography areas and/or soils presenting high water infiltration rate (Zvalo & Respondek, 2007; Napier, 2009), as occurs in the Cerrado region of Central
Brazil.
Souza et al. (2001) obtained
maximum yield of marketable fruit dry mass, Tetsukabuto type, cv. Jabras (2.7 t/ha), by applying 102 kg/ha of N (N exported by fruits was 73 kg/ha). Vidigal et al. (2007), on the
other hand, determined that the total amount of N exported by cv. Suprema, Tetsukabuto type squash, was 51 kg/ha, for a population of 2,222 plants/ha. The N amount recommended for mature squash varies from 50 to 160 kg/ha (Bratsch, 2009; Napier, 2009; Sediyama
et al., 2009; Silva et al., 2014).
The aim of this study was to evaluate, in edaphoclimatic conditions of Cerrado
region of Central Brazil, the influence of irrigation water depths and N doses in the production of hybrid squash Tetsukabuto.
MATERIAL AND METHODS
Two experiments were carried out at Embrapa Hortaliças, Distrito Federal, Brazil (15o56’S, 48o08’W, altitude 997
m), considering that one experiment was carried out in 2008 and the other in 2009. The soil is classified as typic distrophic Red Latosol, cerrado phase, clayey texture. The soil water retention (θ, % vol.), in the 0-40 cm layer and tension interval (Ψm) from 5 to 1,500 kPa, was adjusted to the van Genuchten equation (Marouelli et al., 2011):
Soil fertility attributes in the 0-20 cm layer of the experimental areas, in 2008 and 2009, were respectively: pH= 6.0 and 6.2; P= 18.7 and 15.5 mg/dm3; K=
104 and 137 mg/dm3; Ca= 3.8 and 4.1
cmolc/dm
3; Mg= 1.9 and 2.0 cmol c/dm
3;
Al= 0.00 and 0.00 cmolc/dm
3; H+Al=
3.9 and 5.2 cmolc/dm
3; and organic
matter = 33.5 and 29.8 g/dm3.
In 2008, five water depths were evaluated (185, 265, 343, 408 and 477 mm) with a combination of five doses of N (0, 50, 100, 150 and 200 kg/ha).
The experiment in 2009 consisted of a combination of four water depths (286, 360, 430 and 540 mm) with five doses of N (0, 50, 100, 150 and 200 kg/ha). A split-plot experimental design with three replications was used.
Line sprinkler irrigation system was used, according to Hanks et al. (1976), which provides a variable and continuous water gradient, perpendicular to the sprinkler line. The plots, containing the water depths (irrigation + effective rainfall), were placed in non-randomized lines, parallel to the sprinkler line, whereas doses of N were arranged randomly within the irrigation plots.
Water depths were obtained by using sprinklers 6.0x9.5 mm nozzles, jet interceptor screw, span range of 22 m and operation pressure of 3.5 kgf/cm2, spaced every 6 m
along a single irrigation line. The water application intensity (ŷ; mm/h) using the system decreases linearly (ŷ= 73.9 - 4.04** L; R2= 0.99) from the sprinkler
line (L; m). In order to reduce the effect of wind on water distribution profile, all replicates were positioned on the same side of the sprinkler line and irrigations were carried out in calm wind conditions (velocity <2 m/s).
The hybrid squash Tetsukabuto ‘Jabras’, developed at Embrapa, was used. Two seedlings per pit were transplanted in the second half of June, in both experiments, spacing of 2.0 m among rows and 2.0 m among plants. Unit area of the plots was 160.0 m2
(40x4 m), and for the subplots it was 32.0 m2 (8x4 m).
From the total doses of N, 1/3 was applied in pre-planting, together with phosphorus (P) (450 kg/ha of P2O5) and
potassium (K) (300 kg/ha of K2O), 1/3 at
30 days after planting (DAT) and 1/3 at 50 DAT. The remaining N was applied in two lateral grooves, 50 cm long, close to each plant, before irrigation. Ammonium sulfate was used as source of N in 2008, and urea in 2009.
Irrigations were uniform during the first 14 DAT in 2008, and 20 DAT in 2009, in order to guarantee a homogeneous plant establishment. Irrigations, during this period, were carried out every 1-2 days, applying a
total water depth of 48 mm in 2008 and 72 mm in 2009.
Irrigation scheduling was established from the average readings of fifteen tensiometer installed in the two rows of plants of the first plot of each replicate, in relation to sprinklers line (10 cm depth and 15 cm from the plant), up to flowering, and 20 cm depth and 30 cm distant from the plant, posteriorly.
To ensure that the availability of soil water in the plots closest to the sprinkler line was beyond that required to maximizing the squash production, irrigations were performed considering the limit-tension ranging from 20 to 25 kPa (Kemble & Sanders, 2000; Marouelli
et al., 2011). Once the irrigation moment
was reached, the water depth applied to the plots next to the sprinkler line (defined by the adjusted van Genuchten equation) was the necessary one for the soil to return to the condition of field capacity up to the effective root depth. The effective depth, evaluated visually according to Marouelli et al. (2011),
reached the maximum value of 40 cm. The total average water depths applied by irrigation were measured in rain gauges installed in the center of each plot and distributed in four transversal rows to sprinkler lines. To quantify the deep drainage of water, tensiometers were installed, at a depth of 45 cm, in the same places as those used to indicate when to irrigate.
Soil water content before irrigations was determined by direct gravimetric method. Soil samples were collected with a half-cane auger, at a depth from 5 to 15 cm, at a distance of 15 cm, until the begining of flowering, and in the layer from 15 to 30 cm, at 30 cm from the plant, posteriorly. The samples were taken from two subplots, up to 3 hours before irrigation, being one in each plant row.
water depths provided to the plants (W; mm) were adjusted to the following equations:
ŷ = 7,245 - 50.952**W + 1.209x10⁻¹**
W2 - 9.606x10⁻⁵**W3 (R2= 0.99)
in the agricultural year 2008; and ŷ = 6,174 - 37.359**W + 7.584x10⁻²**
W2 - 5.141x10⁻⁵**W3 (R2= 0.99) in 2009.
The roughing was carried out at 30 DAT, leaving one plant per pit. In order to obtain higher efficiency in relation to fecundation and fructification processes, induced fruiting technique was used, applying synthetic hormone 2.4-D for 40 days (Sediyama et al., 2009). The
branches of eight plants were manually kept inside the subplots. Harvest was carried out in two stages: one at 102 DAT in 2008, and at 103 DAT in 2009; and others were performed two weeks later. Irrigations had been stopped 10 days before the second harvest was carried out.
Weather conditions during the experiments were characterized by the averages of temperature and relative air humidity, reference evapotranspiration (ETo), determined by the Penman-Monteith method (Allen et al., 1998),
and total rainfall. Daily data were obtained at the Agroclimatic Station located at 550 m from the experimental area.
The production characteristics evaluated were: final stand, total and commercial number of fruits/plant, total and commercial productivity, average mass of commercial fruits, water use efficiency (WUE) and N-use efficiency (NUE) by the crop, pulp and peel thickness of commercial fruits, density and total soluble solids content of commercial fruits and yield of pulp. The production of eight plants of each subplot was evaluated, considering commercial the fruits with fresh mass higher than 1.0 kg, removing damaged, rotten and sunburned fruits (Sediyama
et al., 2009; Santos et al., 2012).
The WUE was calculated by the ratio between commercial fruit production and total amount of water evapotranspirated by the crop (Fandika
et al., 2011). Since the water losses due to
deep drainage associated with irrigation were negligible, even in the treatment
with higher water depths (average of soil water tension at 45 cm depth equal to 21 kPa in 2008, and 19 kPa in 2009), the crop evapotranspiration (ETc) was considered equal to the water depth applied via irrigation + effective rainfall, which was determined according to Marouelli et al. (2011).
The NUE was determined by the ratio between the difference of commercial fruit production with and without applying N and the amount of N applied to the crop (Fageria & Baligar, 2005), in an interval from 50 to 200 kg/ha.
The quality of the fruits was determined evaluating four commercial fruits, with mass of 1.6 to 2.5 kg, when available. The total volume of the fruit, for density proposes, was determined by immersion. The thickness of peel and pulp were measured using a caliper rule, in four equidistant positions of one of the halves of each fruit. Total soluble solid content was determined by the thawing method (Luengo et al, 2000),
using a digital refractometer. Pulp yield was calculated by the relation between the fresh mass of pulp and the total mass of fruit, after removing the peel and placenta.
The data of each experiment were analyzed through F test at 5% of significance separately in each agricultural year. Since the result of the analysis of variance for water depth is not valid in design using line-source sprinkler irrigation system (Hanks et al., 1976), the significance of water
depths was tested, at 5% probability, using analysis of repeated measures in the spacing (Fernandez, 1991). The variables affected by the treatments were analyzed using linear regression (orthogonal polynomials method), with coeficients of regression and determination at 5% of significance.
RESULTS AND DISCUSSION
The daily averages of temperature, relative air humidity, ETo and total rainfall during the experiments were, respectively, 25.2oC, 48%, 5.8 mm and
73 mm in 2008, and 23.9oC, 42%, 6.0
mm and 169 mm in 2009. The effective
rainfall ranged from 54 to 72 mm, in 2008, and from 82 to 149 mm, in 2009.
Plant final stand was not affected by water depths and doses of N – average 2,488 plants/ha in 2008 and 2,476 plants/ha in 2009, probably because the irrigations were uniform up to the seedling establishment and because two seedlings were, initially, transplanted per pit. This fact highlights that squash plants are tolerant to water deficit (Ghanbari et al.,
2007; Zvalo & Respondek, 2007). A significant interaction among water depths and doses of N was found for total and commercial productivity of fruits, in both experiments, for total number of fruits per plant in 2009, and for number of marketable fruits per plant and average mass of marketable fruits in 2008. The number of total and marketable fruits per plant, total and commercial productivities and average mass of marketable fruits were influenced by water depths and by doses of N in both experiments.
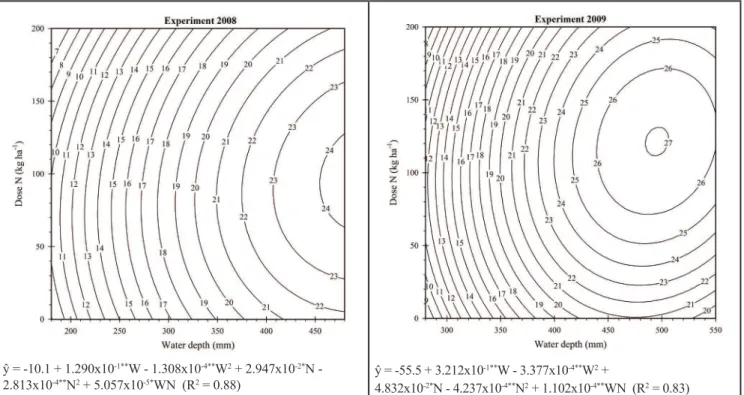
In the first year, the highest total productivity (24.3 t/ha) was under water application of 477 mm (highest depth evaluated) and 95 kg/ha of N, whereas in the second year, the productivity was 27.0 t/ha under 495 mm water application and 121 kg/ha of N (Figure 1). The productivity increase of 11% in 2009, as well as the increase of 4% in water use by plants and 27% in amount of N, may be related to weather and soil variations, among other facts, during the two years of the experiment.
The highest total number of fruits per plant (7.24 fruits) in 2008 occurred under water application of 477 mm and 108 kg/ha of N, whereas in 2009, the highest number (8.54 fruits) occurred under water application of 515 mm and 120 kg/ha of N (Figure 2). There was a significant decrease in total number of fruits per plant when the plants were submitted to increasing water deficit and fertilized with doses of N lower than 50 kg/ha and higher than 150 kg/ha. Silva et al. (2014)
reported similar response to doses of N in ‘Butternut’ squash. In 2009, on the other hand, a water depth higher than 510 mm reduced the total number of fruits per plant, depending on the dose of N.
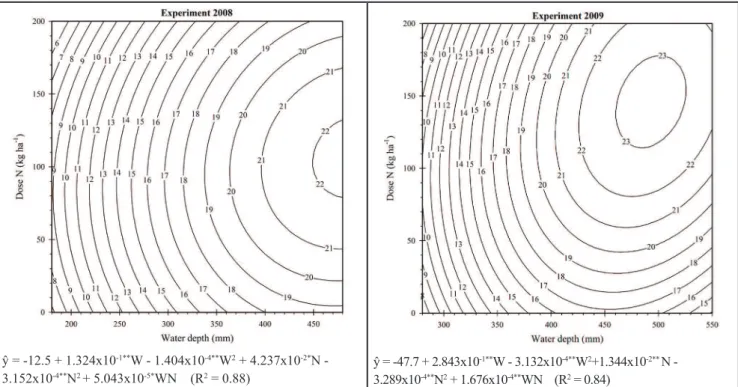
to water depths and doses of N and linear response to interaction among factors, in both experiments. The highest productivity (22.2 t/ha) in 2008 occurred under water application of 477 mm (the highest water depth evaluated) and
105 kg/ha of N, whereas the highest productivity (23.3 t/ha) in 2009 occurred under water application of 492 mm and 146 kg/ha of N (Figure 3). The soil water tension related to the highest commercial productivity was 24 kPa in 2008, and 29
kPa in 2009.
It was verified that the effect of irrigation on the fruit productivity was more pronounced than that of nitrogen fertilization in both experiments. On average, the commercial productivity
ŷ = -10.1 + 1.290x10⁻¹**W - 1.308x10⁻⁴**W2 + 2.947x10⁻²*N -
2.813x10⁻⁴**N2 + 5.057x10⁻⁵*WN (R2 = 0.88)
ŷ = -55.5 + 3.212x10⁻¹**W - 3.377x10⁻⁴**W2 +
4.832x10⁻²*N - 4.237x10⁻⁴**N2 + 1.102x10⁻⁴**WN (R2 = 0.83)
Figure 1. Total squash productivity (t/ha) related to water depth (W) and dose of nitrogen (N) in experiments carried out in 2008 and 2009.
Brasília, Embrapa Hortaliças, 2008 and 2009.
ŷ = -1.4 + 2.866x10⁻²**W - 2.728x10⁻⁵*W2 + 1.662x10⁻²*N -
7.656x10⁻⁵**N2 (R2 = 0.86)
ŷ = -15.8 + 9.464x10⁻²**W - 9.741 10-5**W2 - 1.332x10⁻³*N - 1.021x10⁻⁴**N2 + 5.028x10⁻⁵*WN (R2 = 0.80)
Figure 2. Total number of squash fruits per plant related to water depth (W) and dose of nitrogen (N) in experiments carried out in 2008
decreased up to 60% for water depths evaluated and up to 25% for doses of applied N (Figure 3).
The reduction of productivity verified under conditions of water deficit, even
when moderate (Figures 1 and 3), may have happened, according to Zvalo & Respondek (2007), Bratsch (2009) and Napier (2009), due to the restriction imposed on the physiological activities
of plants, which affected negatively the vegetative growth, fructification rate and fruit growth. However, reduction in productivity observed in 2009 for water depths higher than 500 mm (Figures 1
ŷ = -12.5 + 1.324x10⁻¹**W - 1.404x10⁻⁴**W2 + 4.237x10⁻²*N - 3.152x10⁻⁴**N2 + 5.043x10⁻⁵*WN (R2 = 0.88)
ŷ = -47.7 + 2.843x10⁻¹**W - 3.132x10⁻⁴**W2+1.344x10⁻²** N -
3.289x10⁻⁴**N2 + 1.676x10⁻⁴**WN (R2 = 0.84)
Figure 3. Commercial productivity of squash (t/ha) related to water depth (W) and dose of nitrogen (N) in experiments carried out in 2008
and 2009. Brasília, Embrapa Hortaliças, 2008 and 2009.
ŷ = -3.3 + 3.609x10⁻²**W - 3.836x10⁻⁵**W2 + 1.213x10⁻²* N -
6.548x10⁻⁵*WN (R2 = 0.91)
ŷ = -13.7 + 7.654x10⁻²**W - 7.822x10⁻⁵**W2 + 2.322x10⁻²**N -
8.543x10⁻⁵**N2 (R2 = 0.80)
Figure 4. Number of marketable squash per plant related to water depth (W) and dose of nitrogen (N) in experiments carried out in 2008
and 3) may have occurred because the squash is, according to Sediyama et al. (2009), Amer (2011) and Aegerter et al. (2013), little tolerant to excess
of soil water and moisture in leaves,
which promotes nutrient leaching, reduces oxygen availability to roots and promotes soil-borne and foliar diseases.
Doses of N, both near zero and 200 kg/ha, reduced the fruit productivity in
both agricultural years (Figures 1 and 3). Such pattern of response is similar to that one verified by Vidal et al. (2013), for
‘Menina Brasileira’ squash, and Silva et al. (2014), for ‘Butternut’ squash, which
ŷ = 1.02 + 1.941x10⁻³**W - 1.965x10⁻⁶*W2 + 1.173x10⁻³*N-
5.996x10⁻⁶*WN (R2 = 0.62)
ŷ = 0.82 + 3.023*W - 3.658x10⁻⁶*W2 + 6.719x10⁻⁴**N -
1.749x10⁻⁶*N2 (R2 = 0.54)
Figure 5. Average mass of marketable squash fruits (kg) related to water depth (W) and dose of nitrogen (N) in experiments carried out in
2008 and 2009. Brasília, Embrapa Hortaliças, 2008 and 2009.
ŷ = -0.20 + 3.068x10⁻²**W - 4.593x10⁻⁵**W2 + 1.585x10⁻²**N -
8.732x10⁻⁵*N2 (R2 = 0.61)
ŷ = -9.89 + 6.572x10⁻²*W - 7.764x10⁻⁵**W2 + 1.969x10⁻²*N -
8.273x10⁻⁵*N2 (R2 = 0.68)
Figure 6. Water use efficiency (kg/m3) of squash crop related to water depth (W) and dose of nitrogen (N) in experiments carried out in
obtained maximum productivities for 77 and 91 kg/ha of N, respectively. According to Zvalo & Respondek (2007), Santos et al. (2012) and Vidal et al. (2013), the reduction in productivity
under N deficiency conditions is due to the lowest plant growth, resulting from the decrease of chlorophyll content in leaves and, consequently, of the lowest photosynthesis rate of plants. Yet the excess of N, according to Bratsch (2009), Napier (2009) and Havlin et al. (2013),
promotes excessive plant growth, to the detriment of production, and may cause flower set failure and base imbalance in the soil-plant system, affecting the plant physiological activities.
The rate of the reduction in commercial productivity (Figure 3), when water depth and dose of N vary, was minimal at the border adjacent to the maximum productivity, but a significant increase was noticed as this rate goes beyond this limit. Considering that 5% in reduction in productivity, the productivity is equivalent to 95% of the maximum commercial productivity (21.1 t/ha in 2008 and 22.1 t/ha in 2009). The water depths and doses of N, which allow obtaining 95% of the maximum productivity, minimizing water and N, were water application of 422 mm and 62 kg/ha of N, in 2008, and water application of 442 mm and 96 kg/ha of N in 2009. The soil water tension that allowed 95% of the maximum productivity reached 55 kPa in 2008, and 38 kPa in 2009.
The doses of N that allowed obtaining 95 to 100% for the maximum commercial productivity of squash are usually in the recommended range for mature squash (50 to 160 kg/ha) (Souza
et al., 2001; Napier, 2009; Sediyama et al., 2009; Silva et al., 2014). However,
Pôrto et al. (2014) verified that the total
productivity (17 kg/ha) of Tetsukabuto squash cv. Suprema was maximized with 260 kg/ha of N. Considering that necessity of N is dependent on the content of organic matter in the soil, squash type and productivity level (Santos et al., 2012; Havlin et al.,
2013), other variables, such as irrigation management, are able to justify the differences among the N doses in other studies. Whereas deep drainage and, consequently, N leaching was
possibly negligible in this study, Pôrto
et al. (2014) do not mention the use of
water irrigation management or rainfall occurrence.
The highest number of marketable fruits per plant (5.73 fruits) was obtained in 2008 under water application of 477 mm (highest depth evaluated) and 90 kg/ha of N; whereas in 2009, the highest number of fruits was 6.73 fruits, under 489 mm of water and 119 kg/haof N (Figure 4). Amer (2011) and Silva et al. (2014), evaluating different irrigation levels and doses of N, respectively, also verified a decrease in number of fruits per plant when the squash plants were submitted to both deficit and excess of water and N. The reduction in number of fruits can occur, according to Zvalo & Respondek (2007) and Napier (2009), due to plants show flower set failure and poor fruit setting when submitted to stress conditions.
Marketable fruits showing greater average mass (1.55 kg) were obtained under water apllication of 477 mm and 97 kg/ha of N in 2008, whereas in 2009 the highest mass (1.51 kg) was under water application of 410 mm and 200 kg/ha of N (Figure 5). Whereas the fruit mass decreased both for doses of N (year 2008) and for water depths (year 2009) reduced and high, in accordance with Amer (2011) and Vidal et al. (2013), the
water depths in 2008 and the doses of N in 2009 were not apparently raised to reduce fruit mass.
Higher WUE (5.6 kg/m3) occurred
under water application of 334 mm and 90 kg/haof N; whereas in 2009, NUE was maximized (5.2 kg/m3) under water
application of 423 mm and 120 kg/ha of N (Figure 6). Limit-tensions of soil water that maximized WUE were equivalent to 135 kPa in 2008, and 50 kPa in 2009. Identically to that observed in the present research, Mohammad (2004) verified positive correlation between WUE and doses of N up to 120 kg/ha. Commercial productivities obtained for water depths and doses of N which maximized WUE were 18.8 and 21.9 t/ha in the years of 2008 and 2009 (Figure 3), respectively, considering 15 and 6%, lower than the highest productivities obtained in each experiment.
NUE showed increasing linear
response for water depths (W) and decreasing linear response for doses of N, without showing any interaction among factors. The equations were adjusted: ŷ= 23.0 + 1.911x10⁻¹**W-
4.685x10⁻¹**N (R2= 0.74) for the
experiment in 2008; and ŷ= 43.0 + 1.453x10⁻¹**W - 4.424x10⁻¹**N (R2=
0.69) for the experiment in 2009. Therefore, the NUE was maximized (90.7 kg/kg in 2008; 99.3 kg/kg in 2009) for the highest water depths evaluated and the lowest dose of N considered when determining NUE. Mohammad (2004) also verified reduction of NUE with an increase of N provided to the squash crop. Commercial productivities reached when maximizing NUE were 21.2 and 18.8 t/hain 2008 and 2009 (Figure 3), respectively, which represents a reduction of 5 and 19% in relation to the highest productivities obtained in each experiment.
Peel thickness in 2008, and pulp thickness in 2008 and 2009 were affected only by the water depths evaluated. The response, for both characteristics, was positive linear, being the equations adjusted: ŷ= 1.4 + 5.792x10⁻⁴**W
(R2= 0.53) for peel thickness in
2008; ŷ= 19.1 + 1.505x10- 2 * *W
(R2= 0.85) for pulp thickness in 2008;
and ŷ= 19.0 + 1.295x10⁻²**W (R2= 0.94)
for pulp thickness in 2009. Whereas the increase of peel and pulp thicknesses was directly related to the increase of fruit mass in 2008, pulp thickness increased in 2009, even when fruit mass, for water depths higher than 410 mm, was reduced (Figure 5).
Density, total soluble solid content, and yield of commercial fruit pulp were not influenced by treatments, with average values of 0.85 g/cm3, 7.2oBrix and 75.6%,
in 2008, and of 0.82 g/cm3, 7.3oBrix and
76.0%, in 2009, respectively. Similarly, Swiader et al. (1994) did not verify
effect of N fertilization on the total soluble solid content in mature squash fruits. In relation to irrigation, there was no increase in total soluble solid content in proportion to the increase in the water deficit to which the plants were submitted, as expected (Marouelli
et al., 2011). This fact was probably
crop cycle.
The highest commercial fruit productivity of hybrid squash Tetsukabuto was obtained in plants grown with water depth from 477 to 492 mm and doses of N from 105 to 146 kg/ha, being 95% of maximum productivity reached with water application of 422 to 442 mm and 62 to 96 kg/ha of N. In order to obtain from 95 to 100% of maximum productivity, consider the soil water limit-tension ranging from 24 to 55 kPa. Irrigation and nutrient management aiming to maximize water use efficiency and N-use efficiency caused reduction up to 19% in fruit productivity.
ACKNOWLEDGEMENTS
The first author thanks to The National Council for Scientific and Technological Development (CNPq) for the PQ-CNPq Research Productivity Grant.
REFERENCES
AEGERTER, B; SMITH, R; NATWICK, E; GASKELL, M; RILLA, E. 2013. Pumpkin production in California. Davis: UCLA. 5p.
(ANR Publication, 7222).
ALLEN, RG; PEREIRA, LS; RAES, D; SMITH, M. 1998. Crop evapotranspiration: guidelines
for computing crop water requirements. Rome: FAO. 328p. (Irrigation and Drainage Papers, 56).
AMER, KH. 2011. Effect of irrigation method and quantity on squash yield and quality.
Agricultural Water Management 98:
1197-1206.
BRATSCH, A. 2009. Specialty crop profile: pumpkin. Petersburg: Virginia Cooperative Extension. 8p. (Publication, 438-100).
FAGERIA, NK; BALIGAR, VC. 2005. Enhancing nitrogen use efficiency in crop plants. Advances in Agronomy 88: 97-185.
FANDIKA,, IR; KEMP, PD; MILLNER, JP; HORNE, DJ. 2011. Yield and water use efficiency in buttercup squash (Cucurbita maxima Duchesne) and heritage pumpkin
(Cucurbita pepo Linn). Australian Journal of Crop Science 5: 742-747.
FERNANDEZ, GCJ. 1991. Repeated measure analysis of line-source sprinkler experiments.
HortScience 26: 339-342.
GHANBARI, A; NADJAFI, F; SHABAHAN, J. 2007. Effects of irrigation regimes and row arrangement on yield, yield components and seed quality of pumpkin (Cucurbita pepo L.). Asian Journal of Plant Sciences 6: 1072-1079.
HANKS, RJ; KELLER, J; RASMUSSEM, VP; WILSON, GA. 1976. Line source sprinkler for continuous variable irrigation-crop production studies. Soil Science Society of America Journal 40: 426-429.
HAVLIN, JL; TISDALE, SL; NELSON, WL; BEATON, JD. 2013. Soil fertility and fertilizers: an introduction to nutrient management. 8.ed. New York: Macmillan Publishing Company. 528p.
KEMBLE, JK; SANDERS, DC. 2000. Basis of vegetable crop irrigation. Alburn: Alabama
Cooperative Extension Service. 5p. (ANR, 1169).
LUENGO, RFA; MAROUELLI, WA, CALBO, AG. 2000. Metodologia para extração de sólidos solúveis em abóbora. Horticultura Brasileira 18(suplemento): 334-335.
MAROUELLI, WA; OLIVEIRA, ÁS; COELHO, EF; NOGUEIRA, LC; SOUSA, VF. 2011. Manejo da água de irrigação. In: SOUSA, VF; MAROUELLI, WA; COELHO, EF; PINTO, JM; COELHO FILHO, MA. (eds). Irrigação e fertirrigação em fruteiras e hortaliças. Brasília: Embrapa Informação Tecnológica. p.157-232.
MOHAMMAD, MJ. 2004. Utilization of applied fertilizer nitrogen and irrigation water by drip-fertigated squash as determined by nuclear and traditional techniques. Nutrient Cycling in Agroecosystems 68: 1-11.
NAPIER, T. 2009. Pumpkin production. Yanco:
NSW Department of Industry and Investment. 8p. (Primefact, 964).
PÔRTO, MLA; PUIATTI, M; FONTES, PCR; CECON, PR; ALVES, JC. 2014. Produtividade e acúmulo de nitrato nos frutos da abóbora ‘Tetsukabuto’ em função da adubação nitrogenada. Horticultura Brasileira 32: 280-285.
SANTOS, MR; SEDIYAMA, MAN; MOREIRA, MA; MEGGUER, CA; VIDIGAL, SM. 2012. Rendimento, qualidade e absorção de nutrientes pelos frutos de abóbora em função de doses de biofertilizante. Horticultura Brasileira 30: 160-167.
SEDIYAMA, MAN; VIDIGAL, SM; SANTOS, MR; MASCARENHAS, MH. 2009. Cultura da moranga híbrida ou abóbora Tetsukabuto. Belo Horizonte: EPAMIG. 58p. (Boletim Técnico, 92).
SHOCK, CC; PEREIRA, AB; HANSON, BR; CAHN, MD. 2007. Vegetable irrigation. In: LASCANO, RJ; SOJKA, RE (eds). Irrigation of agricultural crops. Madison, USA: ASA:
CSSA: SSSA. p.535-606.
SILVA, MVT; LIMA, RMS; OLIVEIRA, FL; SILVA, NKC; MEDEIROS, JF. 2014. Produção de abóbora sob diferentes níveis de água salina e doses de nitrogênio. Revista Verde 9: 287-294.
SOUZA, AF; MAROUELLI, WA; MESQUITA FILHO, MV; SILVA, HR; PEREIRA, W. 2001. Exportação de macronutrientes pela abóbora híbrida submetida a diferentes lâminas de irrigação e níveis de N em um Latossolo. Horticultura Brasileira 19 (suplemento). CD-ROM.
SWIADER, JM; SIPP, SK; BROWN, RE. 1994. Pumpkin growth, flowering, and fruiting response to nitrogen and potassium sprinkler fertigation in sandy soil. Journal of the American Society for Horticultural Science 119: 414–419.
VIDAL, VM; PIRES, WM; PINA FILHO, OC; SCHWERZ, T; TEIXEIRA, MB; SOARES, FAL. 2013. Doses de nitrogênio na produção de frutos de abóbora Menina Brasileira irrigada. Global Science and Technology 6: 48-54.
VIDIGAL, SM; PACHECO, DD; FACION, CE. 2007. Crescimento e acúmulo de nutrientes pela abóbora híbrida tipo Tetsukabuto. Horticultura Brasileira 25: 375-380. ZVALO, V; RESPONDEK, A. 2007. Winter