FUNDAÇÃO GETULIO VARGAS
ESCOLA DE ADMINISTRAÇÃO DE EMPRESAS DE SÃO PAULO
CAIO VIEIRA RÊGO
INVESTOR PROTECTION AND CONSTRAINTS RELIEF
SÃO PAULO 2016
CAIO VIEIRA RÊGO
INVESTOR PROTECTION AND CONSTRAINTS RELIEF
Dissertação apresentada à Escola de Administração de Empresas de São Paulo da Fundação Getulio Vargas, como requisito para obtenção do título de Mestre em Administração de Empresas Campo de conhecimento:
Finanças
Orientador: Prof. Dr. Paulo Renato Soares Terra
SÃO PAULO 2016
Rêgo, Caio Vieira.
Investor Protection and Constraints Relief / Caio Vieira Rêgo. - 2017. 39 f.
Orientador: Paulo Renato Soares Terra
Dissertação (mestrado) - Escola de Administração de Empresas de São Paulo.
1. Investidores (Finanças). 2. Mercado financeiro. 3. Fluxo de caixa - Administração. 4. Sociedades comerciais - Relações com investidores. I. Terra, Paulo Renato Soares. II. Dissertação (mestrado) - Escola de Administração de Empresas de São Paulo. III. Título.
CAIO VIEIRA RÊGO
INVESTOR PROTECTION AND CONSTRAINTS RELIEF
Dissertação apresentada à Escola de Administração de Empresas de São Paulo da Fundação Getulio Vargas, como requisito para obtenção do título de Mestre em Administração de Empresas
Campo de Conhecimento: Finanças Data da aprovação: __/__/____ Banca examinadora: ________________________________
Prof. Dr. Paulo Renato Soares Terra (Orientador) FGV-EAESP
________________________________ Prof. Dr. Wesley Mendes da Silva FGV-EAESP
________________________________ Prof. Dr. Guilherme Kirch
AGRADECIMENTOS
Agradeço a Flávia pela paciência, ao Fred pelas iluminações, ao Marcelo pela experiência que me emprestou e ao Orlando por sempre indicar boas referências. Aos professores Paulo Terra pela orientação, Henrique Martins por dividir seu trabalho e Christophe Spaenjers pelo apoio técnico. Também agradeço a meus familiares.
Agradeço ainda ao Itaú, cujo suporte financeiro foi essencial para que fosse possível completar essa etapa.
ABSTRACT
Under financial constraints, firms are kept from following first-best policies. It is in the best interests of the regulators to diminish this inefficiencies as firms play such a important roles in the economy as generating employment and contributing to the GDP. One of the channels through which regulation may interfere with firms funding availability is by protecting investors. This research assesses the relationship between investor protection and firms’ financial constraints. I split some of the most common measures of investor protection among three classes: creditor protection, minority protection and external investor protection. This division is relevant to screen the importance of a given class to alleviate the constraints: constrained firms are likely to share some characteristics that make them more akin to rely on given funding source, for example: firms facing asymmetric information problems are more suitable to debt financing. The cash-flow sensitivity of cash is used as a proxy for financial constraints.
I construct cash saving models based on a sample of 27471 firms in 393 industries (3 digit-SIC), from 2001 to 2015. The models are fitted in two groups: for firms more likely to be constrained, and for firms less likely. To classify the firms between this two groups I rely on the Size and Age index, and on switching regressions with unknown separation points.
The results points that creditor protection is related to lower cash-flow sensitivities of cash for the constrained firms, while external investor protection are related to more prevalent constraints. Minority protection present a negative interaction with the cash-sensitivity of cash in the panel model (indicating constraints relief) but positive coefficient relative to the switching regression.
For the unconstrained batch, however, the results are mixed for the creditor protection measure, while external investor protection always diminish the firms’ propensity to save cash.
Keywords: Cash-flow sensitivity of cash, investor protection, shareholder protection, creditor protection, switching regressions.
RESUMO
Sob restrição financeira, as firmas se distanciam de suas políticas ótimas. É do interesse dos reguladores diminuir as essas ineficiências pois as empresas desempenham funções importantes como contribuir para o PIB e gerar empregos. Uma das formas com que a regulação pode contribuir com a disponibilidade de financiamento para as companhias é estipulando leis que protegem seus investidores. Essa pesquisa investiga a relação entre proteção ao investidor e a restrição financeiro no meio corporativo. Nela, eu divido as leis que protegem os investidores em três tipos: proteção ao credor, ao acionista e ao investidor externo. A importância dessa divisão se dá por permitir identificar o efeito relativo de uma certa categoria de proteção em aliviar restrições financeiras: firmas restritas possuem características que podem torná-las mais suscetíveis a se financiar por certa forma de financiamento, por exemplo: firmas enfrentando assimetria de informação têm no endividamento sua forma de financiamento mais adequada. Para identificar restrição financeira eu me apoio na sensibilidade do caixa ao fluxo de caixa. Eu construo modelos de formação de caixa baseados em uma amostra de 27471 firmas em 393 industrias (SIC de 3 dígitos). A amostra compreende os anos entre 2000 e 2016. Os modelos são ajustados para 2 grupos: o das firmas mais prováveis de enfrentarem restrição financeira e o das menos prováveis. Para realizar essa classificação eu utilizo o índice de Tamanho e Idade, e em uma switching regression com pontos de separação desconhecidos. Os resultados apontam que proteção ao credor está relacionada a menores sensibilidades do caixa ao fluxo de caixa para ao grupo restrito, enquanto proteção ao investidor externo está relacionada ao restrições mais prevalentes. Proteção ao acionista apresenta uma interação negativa com a sensibilidade da caixa ao fluxo de caixa no modelo em painel, mas o sinal oposto no modelo de switching regression. No conjunto de firmas irrestritas por outro lado, os resultados são inconclusivos para a variável de proteção ao credor, enquanto proteção ao investidor externo sempre aparece relacionado a uma diminuição da restrição financeira.
Palavras-chave: Sensibilidade do caixa ao fluxo de caixa, proteção ao investidor, proteção ao credor, proteção ao acionista, switching regressions
Contents
Introduction . . . 9
1 Introduction . . . 9
2 Theoretical Background . . . 11
2.1 Cash Management . . . 11
2.1.1 Can financial variables influence corporate policies? . . . 11
2.2 The Cash-Flow Sensitivity of Cash . . . 12
2.3 External Mechanisms of Investor Protection . . . 13
2.4 Financial Development . . . 13 3 Hypotheses . . . 15 4 Methodology. . . 15 4.1 Data . . . 15 4.2 Descriptive Statistics. . . 16 4.3 Empirical Strategy . . . 16 4.3.1 Variables . . . 16
4.4 Measure of investor Protection . . . 19
4.4.1 Creditor Protection . . . 19
4.4.2 Shareholder Protection . . . 20
4.4.2.1 Shareholder Protection: Insiders vs Minority Shareholders . . . 20
4.4.2.2 Shareholder Protection: External Investor Protection . . . 21
4.4.3 Analysis . . . 21
4.4.4 Model. . . 25
4.5 Classification Scheme . . . 26
4.5.1 Size and Age index . . . 27
4.6 Switching Regressions . . . 28
5 Results . . . 29
5.1 OLS . . . 29
5.1.1 Investor Protection and The Cash-Flow Sensitivity of Cash . . . 30
5.2 Switching Regression . . . 30
5.2.1 Selection Model . . . 31
5.2.2 Cash Savings Equation . . . 32
5.3 Investor Protection . . . 33
6 Conclusion . . . 34
BIBLIOGRAPHY . . . . 36
Introduction 9
1
Introduction
A firm’s corporate governance seeks to protect its investors from expropriation by other stakeholders, often managers and controlling shareholders. This effort is conducted in order to facilitate the firm’s funding, for example: creditors believing insiders won’t impel riskier behavior to benefit shareholders, and minority shareholders sure about not being expropriated through tunneling will require smaller risk premia to invest in the company.
Protection mechanisms are also established at country-level to foster investment. The so called External Mechanisms of Investor Protection have been linked to financial, both bank and stock market development, faster economic growth and depicted as a driver of firms’ ownership structure and dividend policy patterns (LOPEZ DE SILANES,1998). In this paper I ask whether countries’ investor protection mechanisms can also alleviate firms’ financial constraints.
To quantify investor protection I perform a factor analysis to obtain the common factor of some of the measures of investor protection existing in the literature. The factors are extracted from three bundles: the creditor protection bundle, which is composed by Legal Reserve (LOPEZ DE SILANES,1998), Creditor Rights (DJANKOV,2007) and Debt Enforcement Efficiency (DJANKOV,2006). The shareholder protection bundle, composed of Mandatory Dividends (SPAMANN,2010), Anti-Selfdealing (DJANKOV,2008) and the Revised Anti-Director Rights (DJANKOV,2008). And the protection against bad securities’ issuance bundle, extracted from the Disclosure Requirements measure (LA PORTA,2006) and the Liability Standard measure (LA PORTA,2006).
To do so I identify financial constrained firms relying on the expected impact that they cause on corporate cash policy, likewiseKhurana, Martin and Pereira(2006),Sufi(2009). As pointed byAlmeida, Campello and Weisbach(2004),Faulkender and Wang(2006),Almeida, Campello, Cunha and Weisbach(2014), precautionary cash hoarding by constrained firms cause them to present a behavior that is distinct from unconstrained ones: they are expected to hold larger cash reserves and also to save more cash out of cash inflows in order to fund future growth opportunities.
This latter feature gave rise to a measure of the marginal cash hoarding given a firm’s cash inflow- the cash-flow sensitivity of cash- which was shown, both theoretically and empirically, to be positive for firms with characteristics akin to what is expected of constrained firms and statistically indistinguishable from zero in firms more likely to be unconstrained.Riddick and Whited(2009) on the other hand, develops a cash-savings model where firms lower cash reserves in order to invest after receiving positive shocks to cash-flow, and vice versa, therefore they expect the CFSC to be negative.
As I support my arguments over the differences between sensitivities of cash-hoarding to cash inflows in different institutional environments (the interaction between the investor protection measures and cash-flow) a caveat emerges: simply obtaining a lesser cash flow
Introduction 10
sensitivity of cash would be consistent with a higher predominance of unconstrained firms in a given country. What is troublesome is that, since countries more protective of investors are also more developed, this predominance could be due to economic factors other then investor protection and therefore the relationship obtained would be spurious. Therefore, I compare this measure between firms more likely to be constrained separately from the ones more likely to be unconstrained and interpret a positive coefficient for the interaction between cash-flow and the measures of protection as related to higher predominance of actually constrained firms.
The first step of the analysis involves classifying firms between constrained and un-constrained. To do this, I rely on two strategies: First the more trivial classification method: ex-ante classification based on the Hadlock and Pierce Index (HADLOCK; PIERCE,2010). Classification is a critical element in this analysis because it has been pointed as causing the conflicts in the investment sensitivity to financial constraints literature (KAPLAN; ZINGALES, 1997;KAPLAN; ZINGALES,2000;WHITED; WU,2006a;MOYEN,2004;CLEARY,1999).
To add robustness to potential classification issues I also rely on a second strategy for classifying firms: I make use of switching regressions (as doHu and Schiantarelli(1998) and Hovakimian and Titman(2006)). This technique demands only that the researcher knows ex-ante the number of different regimens that describes the firms policies, and then concomitantly fits the regimen equations and estimates a rule of allocation for the firms among those models. Another benefit is that this rule of classification allows the researcher to measure how much characteristics of the sample contribute to the classification of firms in constrained and unconstrained.
The results obtained contribute to the literature of determinants of firms constraints. The selection equation, obtained as a step in the endogenous switching regression, estimates coefficients that relate firms’ characteristics to the probability of being in one of two cash regimes. This method was used in a number of studies (ALMEIDA; CAMPELLO, 2007; HOVAKIMIAN; TITMAN, 2006; HU; SCHIANTARELLI, 1998) to assess the probability that firms are constrained. In these studies, whenever a firm was screened to a regime where its investment policy showed positive cash-sensitivity, it was classified as constrained. However, the association connecting liquidity and investment was challenged overtime (MOYEN,2004; KAPLAN; ZINGALES,1995;KAPLAN; ZINGALES,1997;KAPLAN; ZINGALES,2000; CLEARY,1999), with claims that positive sensitivity (a priori indicating constrained firms) could actually mean that the firms are less constrained. By using the less disputed relationship between cash policies and financial constraints, this research strengthens the evidence that size, liquidity and profitability are related to less constraints and so is economic development and minority investors protection at country level. On the other hand, earnings volatility and long term debt are linked to firms that fit better the constrained regimes (with creditor protection and protection against bad securities issuance at country-level).
A second contribution is the separation of investor protection in three categories, as previously discussed. The prevalent practice in the literature is to pool the different dimensions
Theoretical Background 11
of investor protection (creditor, minority shareholder, bad securities) in one group or in a split between creditor and shareholder. This distinction is of importance on a policy-maker point of view, as the three dimensions presented starkly distinct relevance and towards different profiles of firms.
The third contribution is the appraisal of the link between investor protection and firms’ financial constraints. The results confirm the hypothesis that creditor protection is efficient at reducing constrained firms’ propensity to save out of cash inflows, but do not present favorable evidence toward protection of minority shareholders and external investor (the potential acquirers new securities). The evidence for creditor protection is robust to economic development (proxied by GDP per capta) and unobserved time-invariant characteristics at industry, country and year level.
2
Theoretical Background
2.1
Cash Management
2.1.1 Can financial variables influence corporate policies?
Departures from theModigliani and Miller(1958) frictionless environment make the channel through which researchers try to explain unexpected/irrational/non-first-best behaviour by firms. Amongst the distortions explored are: Agency costs (JENSEN; MECKLING,1976), bankrupcy costs and information asymmetry (MYERS; MAJLUF,1984) and financial constraints (FAZZARI,1988). The present research contributes to the literature initiated byFazzari, Hubbard, Petersen, Blinder and Poterba(1988).
Fazzari, Hubbard, Petersen, Blinder and Poterba(1988) aims to capture the effect of market imperfections over firms’ investment policy. They conjecture that, for firms more likely to face financial contraints, investment must be contingent on internal availability of funds. To test this hypothesis, the authors split their sample into three levels of financial constraints based on the ratio of dividend payment- in which they classify firms that pay lower ratios as more constrained. They conclude that the resulting coefficients on the cash-flow variable grow monotonically with the level of financial constraint and interpreted it as confirming what was later named the monotonicity hypothesis.
Although this framework gave rise to a volume of publications on the subject, it later generated much critique.Kaplan and Zingales(1995),Kaplan and Zingales(1997) questioned the validity of this methodology. They show that the implied monotonic relationship between sensitivity of investment to cash-flow and the level of financing constraints is not a logical consequence of transaction costs causing firms to finance their projects through internal funds. They also argue that the classification rule was not accurate, as they estimate that only 15% of the firms classified as the most constrained were, indeed, constrained.Kaplan and Zingales
Theoretical Background 12
(1997),depict elements such as the form of production function, Q mismeasurements and hard-wired growth in cash during periods which lack growth opportunities (in which firms hoard cash simply because investing is not profitable) as permiting one to find firms that are unconstrained and yet present high investment sensitivity to cash-flow. Another confounding effect that an-tagonizeFazzari, Hubbard, Petersen, Blinder and Poterba(1988) predictions is the predictive power cash-flow has over a firm’s investment opportunities: since firms will want to invest more when investment opportunities are better, the unconstrained ones will invest above their internal funds because they can raise external funding to enhance their investment therefore making their cash-flow-investment sensitivity starker (ALMEIDA; CAMPELLO,2007).
2.2
The Cash-Flow Sensitivity of Cash
A sidestep to the shortcomings stated above was proposed byAlmeida, Campello and Weisbach(2004). They argue that the link between financial constraints and a firm’s demand for liquidity provides an instrument to assess if availability of external funds can influence firm’s behavior. They expect constrained firms to hoard cash antecipating financial constraints. By doing so, they make it possible to fund future growth opportunities but, as hoarding resources is costly because it means foregoing contemporaneous investment (as they can not raise external funds efficiently), their optimal cash policy requires balancing present and future profitability. After solving a model for cash-holdings where management maximizes expected cash flows, they predict constrained firms to hoard a higher percentage of cash when their cash-flow rises. Unconstrained firms, on the other hand, bear no benefits or costs in maintaining cash stocks, so the authors point that no systematic behavior is expected.
The presumed relation is dichotomous. One should not expect more constrained firms to hoard more cash. Instead, what the theory predicts is that constrained firms will save more cash when cash inflows are higher while the unconstrained won’t (we expect the coefficient of cash-inflows in the unconstrained firms sample to be not significantly different from zero).
Although Almeida, Campello and Weisbach (2004) model indicates that cash-flow sensitivity of cash of constrained firms should always be positive, later (ALMEIDA, 2011) augment the model to investigate the impact of financial restriction on inter-temporal investment decisions. The analysis indicates that investing in liquid real investments alleviate the need for holding cash out of cash-flows in order to transfer resources across time. Therefore, in the presence of alternative liquid investments, the cash flow sensitivity of cash is smaller and can become negative.
Riddick and Whited(2009) also explores the Cash-Flow Sensitivity of Cash, but they expect it to be negative, given that in an intertemporal framework, the lowering of cash reserves would ocurr to fund investment following a positive shock to cash-flow. They conclude that the CFSC is subject to many forces (most notably, earnings uncertainty and financial distress) and therefore to rely on it to assess financial constraints may be inappropriate.
Theoretical Background 13
2.3
External Mechanisms of Investor Protection
Corporate Governance is a mechanism through which a firm binds its decision making capabilities in order to make investors less susceptible to expropriation. The outcome of such practices is broader access to funding and at a cheaper cost. Additional mechanisms to protect investors are often dictated by the Estate (in order to attract financing and/or develop financial market and foster growth). The so called External Mechanisms of Investor Protection have been linked to financial market development (both bank and stock) faster economic growth, firm’s ownership structure and dividend policy patternsLopez de Silanes, Porta, Shleifer and Vishny (1998). They are specially important in countries where enforcement of private contracts is weak. Porta, Silanes, Shleifer and Vishny(2000) write that, although reputations and bubbles ease the access to funding, changes in law and its enforcement are central do understanding why firms raise more funds in given countries than in others.
Almeida, Campello and Weisbach(2011) propose a model of how investor protection relates to the costs of external financing. It follows from their model that the cost of external financing increases with the level of investment that is prone to expropriation and is reduced by greater investor protection. The underlying relation can then be framed as a source of financial constraints. This raises a concern that, when classifying firms as constrained, if one relies on the same rule of classification for countries of uneven levels of investor protection one will incurr in too much misclassification. The latter problem will be addressed with switching regression in a manner similar toHu and Schiantarelli(1998) who includes macroeconomic variables when classifying firms financial status.
Faulkender and Wang(2006) estimates how much a dollar on cash balance is valued to shareholders. They find that its value varies subject to the likelihood that it will be distributed to shareholders, used to increase market value of debt or to mitigate underinvestment. As a result they obtain that for constrained firms, which are more likely to use extra cash holdings to exercise investment opportunities, an extra dollar of cash in cash balance is worth more than for an unconstrained one. Therefore we would expect their cash savings to be more sensitive to cash inflows. In a similar paper,Pinkowitz, Stulz and Williamson(2006) points that the marginal value of a dollar in cash balances and of a dollar payed as dividends also correlates with the level of investor protection and of enforcement of private contracts and find that this value diminishes when shareholders are less protected. The rationale is that lack of regulation permits controlling shareholders to consume cash at expense of minority shareholders, the difficulty on accruing perks from cash balances to controllers may cause them to lessen their saving propensities on environments of stronger protection.
2.4
Financial Development
Porta, Silanes, Shleifer and Vishny(2000) states that the most basic prediction for investor protection is that it encourages the development of financial markets, and more, they affirm
Theoretical Background 14
that, even in countries with well functioning judiciaries, those with laws and regulations more protective of investors have better developed capital markets. If one embraces that point of view, the research most similar to the one developed here is the one ofKhurana, Martin and Pereira (2006). Their work links financial development and the CFSC. The authors conjecture that the less developed the financial market, the larger is the magnitude of the Cash Flow Sensitivity of Cash. They also predict that bank market development has a starker effect over CFSC (more negative), although they admit this hypothesis was formulated as an educated guess.
The research ofKusnadi and Wei(2011) also tackles the impact of investor protection on the cash-flow sensitivity of cash. They show that investor protection (proxied by legal origin, the investor protection index and the anti-self-dealing index) is related to lower propensities to save out of cash inflows. The research also shows that, following the inclusion of the in-vestor protection measures on the cash-savings model, the financial development index loses significance.
Porta, Silanes, Shleifer and Vishny(2000), in a similar spirit, predict banks to be more suited to attenuate financial restriction: they rely onGerschenkron(1962), who argues that bank centered financial market are better suited for developing countries. As causes for financial constraints are more in line with the control and asymmetric information theories (than with the competing ones) and, first, banks’ value is their efficiency in gathering information (DIAMOND, 1984), second, control theories focus on manager-shareholders conflict of interests and in the lower costs a bank (compared to shareholders) incur to take control of a firm, banks do seem like the most appropriate source of funding for constrained firms. In fact, Mayer(1990) uses exploratory statistics to build 10 stylized facts, one of which states that small firms are more dependent on bank lending, linking this to the result ofHadlock and Pierce(2010) that size is the main driver of financial constraint, one can make chorus toKhurana, Martin and Pereira(2006) hypothesis.Mayer(1998) survey the financial systems and corporate governance literature and concludes that evidence of banks reducing the costs of financial distress are conflicting: there is evidence of such in Japan, but the same result is not present in Germany.
What my research offers above what was shown in Kusnadi and Wei (2011) is the assessment of the impact of investor protection categorized among creditor protection, minor-ity (shareholder) protection and external investor protection. That resemblesKhurana, Martin and Pereira (2006), in which the authors explore credit and stock market development sepa-rately.Although Khurana, Martin and Pereira(2006) hypotheses are not rejected, they do not split firms between constrained and unconstrained, so their results may obtain due to a larger predominance of unconstrained firms relative to constrained ones.
In order to differentiate furtherKhurana, Martin and Pereira(2006) work from the one proposed, here it is worth noticing thatPorta, Silanes, Shleifer and Vishny(2000) concludes that investor protection measures work better to explain differences among countries. They also posit that investor rights are a more primitive determinant of financial development then a measure of
Hypotheses 15
the size of particular institutions.Mayer(1998) shows that the usage of a funding source is not closely related to financial market development. He also states that differences across countries relate to ownership and control, which, in turn,La Porta, Silanes and Shleifer(1999) report to be linked to legal origin and therefore to legal protection of investors.
3
Hypotheses
The first prediction about the impact of external mechanisms of investor protection over a firm’s cash policy is taken fromAlmeida, Campello and Weisbach(2011). They contend that poor investor protection is a source of financial constraints and build a model that relates weaker investor protection to higher external financing costs and so, predict that one should observe "a stronger preference for shorter-term, safer investments that use more liquid assets(such as cash)" in countries where costs of external finance is high.
H1: The cash-flow sensitivity of cash decreases as the level of investor protection
in-creases.
The second hypothesis investigates uneven effects on shareholder and creditor protection. Mayer(1990) concludes that the control and information asymmetry theories are the best fit to describe financial constraints. As banks suffer smaller costs to take control of firms and are intermediaries specialized in generating information, they are better suited to alleviate financial constraints.Gerschenkron(1962) also describes banks as more adequate to developing countries, in which financial constrained firms do prevail. Let’s move on to the hypothesis 2:
H2: The effect of creditor protection on the decrease in the CFSC of constrained firms is
starker than the effect of shareholder protection.
4
Methodology
4.1
Data
The data comes from Bureau Van Dijk’s ORBIS database. Initially we manage the data to comprehend the 49 countries in (LOPEZ DE SILANES,1998), with time-span from 1982 to 2015. Only SIC (Standard Industrial Classification) codes from 2000 to 3999 are included. Later, I exclude observations from India, Kenya, Zimbabwe, Pakistan, Nigeria due to incomplete data on one of the dimensions of investor protection.
As inAlmeida and Campello(2007): firm-years whose capital stock are below 5 million 1982 US dollars, the ones that experienced above 100% growth in gross sales or total assets from a year to the next, negative or above 10 market to book ratio. Also, as some variables are measured as yearly variation we miss information due to data discontinuities.
Methodology 16
4.2
Descriptive Statistics
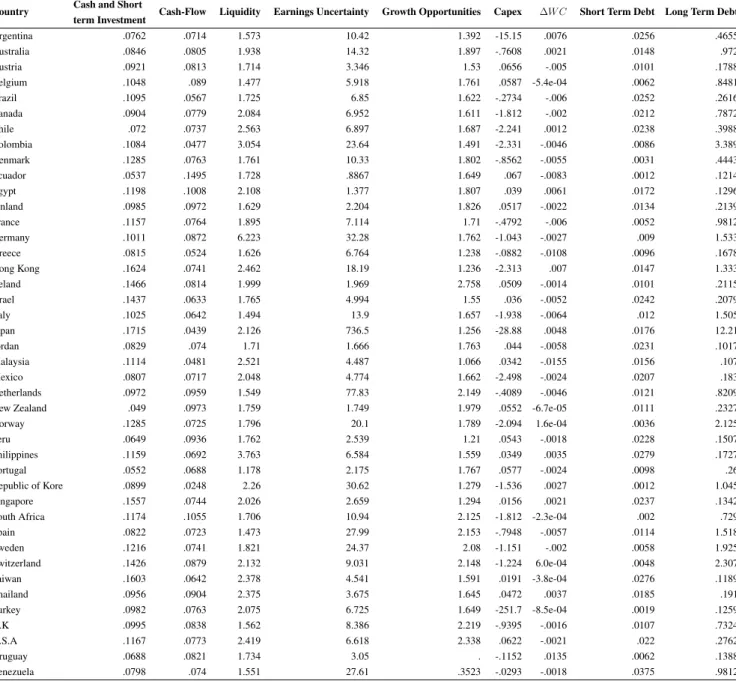
Table 1 shows great cross country variability on the variables that are part of the model. This statistics are based on 1% winsorization of total assets. The Cash Stocks range from 4.9% of Total Assets in New Zealand to 17% in Japan. The between country correlation investor protection measures and median cash stocks ranges from -0.14 on the creditors’ protection to 0.07 on the insiders vs minority measure, with insiders vs external measure correlating to -.10. The negative correlations agrees with the Dittmar, Mahrt-Smith and Servaes(2003) and Kalcheva and Lins(2007), who present empirical evidence that in less protective countries the private benefits of control extracted from liquid assets will make managers indulge in higher cash hoarding. The relationship between insiders vs minority shareholders may stem from dynamics of the constrained companies, who may have less access to the stock market. Making use of the probability of following the constrained regime, obtained in the switching regression section, while in companies below 30% of being unconstrained this correlation surpasses 0.10, it is approximately 0.03 when we look at companies with more than 70% probability of being unconstrained.
Cash-flow ranges from 4% of total assets in Japan to circa 15% in Ecuador.
A problem highlighted by the absence of data on growth opportunities for Uruguay is that the choice to proxy it by Market to Book ratio avoids the contribution of companies which are either not listed or for which this information was not available. This may tilt the effective sample towards bigger companies, which also tend to be less constrained.
Short term debt and long term debt both show great volatility. As expected the mean short term debt is negatively correlated to creditor protection. Long term Debt, on the other hand is positively correlated with this measure. Short term debt is indeed pointed as a way for riskier, less known companies to be indebted. Median short term debt and median long term debt both correlate positively with the insiders vs minority and insiders vs external measures (although short term debt and insider vs minority correlation is close to null).
4.3
Empirical Strategy
4.3.1 VariablesTable 1 depicts the firm-level variables comprehended in the model. Income uncertainty makes it into the model for the reasoning presented inRiddick and Whited(2009). In this paper the authors contend that income uncertainty prevent firms to modify its savings policy because shocks to cash-flow will convey little information about future cash-flow. They obtain that highly uncertain income increases the cash-flow sensitivity of cash.
From the research ofAlmeida, Campello and Weisbach(2011) I take the rationale for the addition of liquidity as an independent variable. In the presence of liquid investments other than cash, the cash-flow sensitivities of cash need not be positive as they can be used to transfer
Methodology 17
Methodolo
gy
18
Table 1 – Country-level Descriptive Statistics
Country Cash and Short
term Investment Cash-Flow Liquidity Earnings Uncertainty Growth Opportunities Capex ∆W C Short Term Debt Long Term Debt Argentina .0762 .0714 1.573 10.42 1.392 -15.15 .0076 .0256 .4655 Australia .0846 .0805 1.938 14.32 1.897 -.7608 .0021 .0148 .972 Austria .0921 .0813 1.714 3.346 1.53 .0656 -.005 .0101 .1788 Belgium .1048 .089 1.477 5.918 1.761 .0587 -5.4e-04 .0062 .8481 Brazil .1095 .0567 1.725 6.85 1.622 -.2734 -.006 .0252 .2616 Canada .0904 .0779 2.084 6.952 1.611 -1.812 -.002 .0212 .7872 Chile .072 .0737 2.563 6.897 1.687 -2.241 .0012 .0238 .3988 Colombia .1084 .0477 3.054 23.64 1.491 -2.331 -.0046 .0086 3.389 Denmark .1285 .0763 1.761 10.33 1.802 -.8562 -.0055 .0031 .4443 Ecuador .0537 .1495 1.728 .8867 1.649 .067 -.0083 .0012 .1214 Egypt .1198 .1008 2.108 1.377 1.807 .039 .0061 .0172 .1296 Finland .0985 .0972 1.629 2.204 1.826 .0517 -.0022 .0134 .2139 France .1157 .0764 1.895 7.114 1.71 -.4792 -.006 .0052 .9812 Germany .1011 .0872 6.223 32.28 1.762 -1.043 -.0027 .009 1.533 Greece .0815 .0524 1.626 6.764 1.238 -.0882 -.0108 .0096 .1678 Hong Kong .1624 .0741 2.462 18.19 1.236 -2.313 .007 .0147 1.333 Ireland .1466 .0814 1.999 1.969 2.758 .0509 -.0014 .0101 .2115 Israel .1437 .0633 1.765 4.994 1.55 .036 -.0052 .0242 .2079 Italy .1025 .0642 1.494 13.9 1.657 -1.938 -.0064 .012 1.505 Japan .1715 .0439 2.126 736.5 1.256 -28.88 .0048 .0176 12.21 Jordan .0829 .074 1.71 1.666 1.763 .044 -.0058 .0231 .1017 Malaysia .1114 .0481 2.521 4.487 1.066 .0342 -.0155 .0156 .107 Mexico .0807 .0717 2.048 4.774 1.662 -2.498 -.0024 .0207 .183 Netherlands .0972 .0959 1.549 77.83 2.149 -.4089 -.0046 .0121 .8209 New Zealand .049 .0973 1.759 1.749 1.979 .0552 -6.7e-05 .0111 .2327 Norway .1285 .0725 1.796 20.1 1.789 -2.094 1.6e-04 .0036 2.125 Peru .0649 .0936 1.762 2.539 1.21 .0543 -.0018 .0228 .1507 Philippines .1159 .0692 3.763 6.584 1.559 .0349 .0035 .0279 .1727 Portugal .0552 .0688 1.178 2.175 1.767 .0577 -.0024 .0098 .26 Republic of Kore .0899 .0248 2.26 30.62 1.279 -1.536 .0027 .0012 1.045 Singapore .1557 .0744 2.026 2.659 1.294 .0156 .0021 .0237 .1342 South Africa .1174 .1055 1.706 10.94 2.125 -1.812 -2.3e-04 .002 .729 Spain .0822 .0723 1.473 27.99 2.153 -.7948 -.0057 .0114 1.518 Sweden .1216 .0741 1.821 24.37 2.08 -1.151 -.002 .0058 1.925 Switzerland .1426 .0879 2.132 9.031 2.148 -1.224 6.0e-04 .0048 2.307 Taiwan .1603 .0642 2.378 4.541 1.591 .0191 -3.8e-04 .0276 .1189 Thailand .0956 .0904 2.375 3.675 1.645 .0472 .0037 .0185 .191 Turkey .0982 .0763 2.075 6.725 1.649 -251.7 -8.5e-04 .0019 .1259 U.K .0995 .0838 1.562 8.386 2.219 -.9395 -.0016 .0107 .7324 U.S.A .1167 .0773 2.419 6.618 2.338 .0622 -.0021 .022 .2762 Uruguay .0688 .0821 1.734 3.05 . -.1152 .0135 .0062 .1388 Venezuela .0798 .074 1.551 27.61 .3523 -.0293 -.0018 .0375 .9812 This table presents country-wise means of the firm level variables.
Methodology 19
4.4
Measure of investor Protection
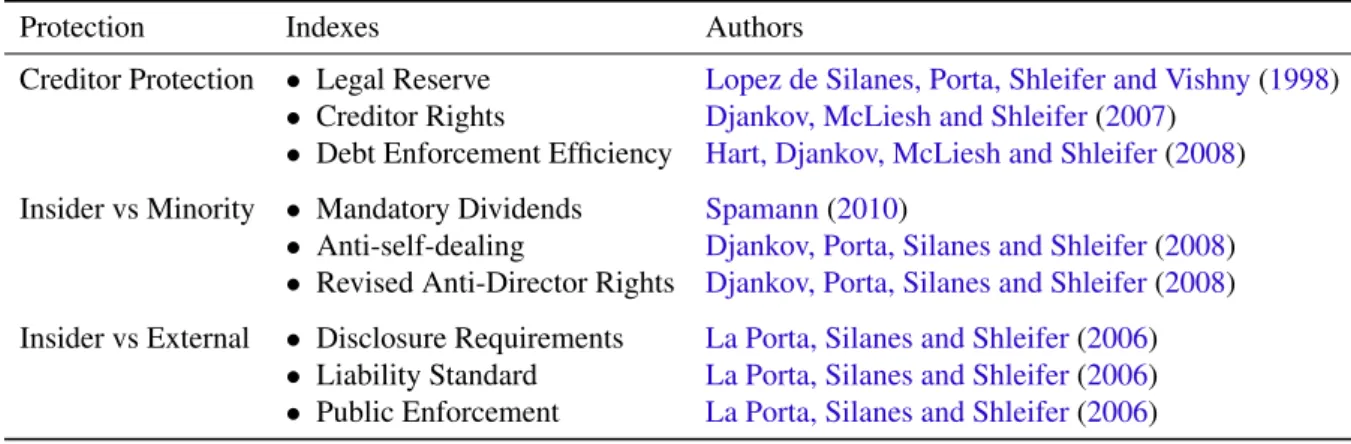
There are a number of measures to evaluate investor protection. I make use of the following:
Table 2 – Investor Protection Indices
Protection Indexes Authors
Creditor Protection • Legal Reserve Lopez de Silanes, Porta, Shleifer and Vishny(1998) • Creditor Rights Djankov, McLiesh and Shleifer(2007)
• Debt Enforcement Efficiency Hart, Djankov, McLiesh and Shleifer(2008) Insider vs Minority • Mandatory Dividends Spamann(2010)
• Anti-self-dealing Djankov, Porta, Silanes and Shleifer(2008) • Revised Anti-Director Rights Djankov, Porta, Silanes and Shleifer(2008) Insider vs External • Disclosure Requirements La Porta, Silanes and Shleifer(2006)
• Liability Standard La Porta, Silanes and Shleifer(2006) • Public Enforcement La Porta, Silanes and Shleifer(2006)
I aggregate these indices by factorial analysis. It was conducted with Interactive Principal Components as the extraction method and the only factor which presented an eigenvalue superior to one was retained. The scores were obtained via Bartlett’s method.
4.4.1 Creditor Protection
The Creditor Protection index incorporates the Legal Reserve, Creditor Rights Index and Debt Enforcement Efficiency.
Legal Reserve is described by La Porta, Silanes and Shleifer (2006) as a remedial measure. It means that it may be stated to counterbalance poor creditor protection. In the case of liquidation, it makes sure the litigation process begins before all the capital is stolen or wasted by insiders. As expected from a remedial measure it does present negative correlation with the other two measures of creditor protection, -0.12 with the Debt Enforcement Efficiency and -0.296 with the Creditor Rights Index. Creditor Rights and Enforcement Efficiency correlation in 0.235
As explained inDjankov, McLiesh and Shleifer(2007), Creditor rights is composed of elements such as "whether there are restrictions when a debtor files for reorganization", automatic stay on the assets, if senior creditors are paid first on liquidation and whether it is an administrator or a manager who is responsible for running the business during reorganization: it is the same measure as inPorta, Silanes, Shleifer and Vishny(1997), with differences stemming from the sources (e.g. the data from India inPorta, Silanes, Shleifer and Vishny(1997) is coded using the Companies Act(1956) and using the Sick Industrial Companies Act(1985) inDjankov, McLiesh and Shleifer(2007)).
The last measure concerning creditor rights: Debt Enforcement EfficiencyHart, Djankov, McLiesh and Shleifer(2008).The measure is based on data on time and cost of the litigation, and
Methodology 20
the likely form of disposition of the assets (preservation as a going concern vs. piecemeal sale).
The time-series nature of theDjankov, McLiesh and Shleifer(2007) measure made it necessary to choose one year of the time-span and fix it, so the factor analysis could be performed along with the other two measures which are fixed over time (since the only variation for such happens at the country level, not fixing an year for Creditor Rights would deflate the correlation between this variable and the other two).
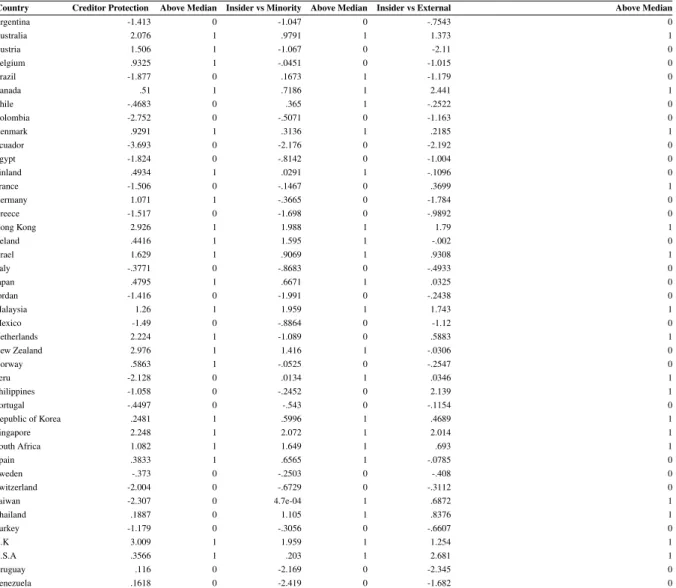
The obtained results shows stronger protection in common law countries, with UK presenting the stronger index, followed by New Zealand, the Netherlands and Singapore, and a concentration of french legal origin countries on the other end of the spectrum, Ecuador appears as the least protective of its creditors. These results are presented in Table 4.
4.4.2 Shareholder Protection
The indices that accrue to shareholders, on the other hand, can be aggregated in two different dimensions. mandator y dividends (SPAMANN,2010), anti-self-dealing (DJANKOV, 2008) and revised anti-director right(DJANKOV,2008) are related to the extent to which minority shareholders are protected from expropriation from insiders1.Disclosure requirements,liability standard and public enforcement (LA PORTA,2006) are measures linked to the "promoter’s problem", namely the possibility that insiders will sell bad securities to the public.
4.4.2.1 Shareholder Protection: Insiders vs Minority Shareholders
The revised anti-director rights is similar to the one inLopez de Silanes, Porta, Shleifer and Vishny (1998), the differences are due to improvements in coding and the resolve of conceptual ambiguities. This happened to change the estimates to an extent that the correlation of the anti director-rights index and the revised one is 0.53. The lack of distinction between enabling provisions and mandatory and default rules inLopez de Silanes, Porta, Shleifer and Vishny(1998) demanded changes in the 2008 version as well, enabling provisions were then ignored. Common law countries were the most affected since they presented more enabling provisions than their peers.
The Anti-self-dealing index pertains to private enforcement mechanisms governing the practice of tunneling. Disclosure requirements, approval of transactions and litigation after tort are assessed through this measure (DJANKOV,2008).
In a similar manner to legal reserve, (LA PORTA,2006) classifies mandatory dividends as a remedial measure. I choose to rely on the data onSpamann(2010), which contains coding
1 SEC describes insiders as: a company’s officers and directors, and any beneficial owners of more than ten percent
of a class of the company’s equity securities registered under Section 12 of the Securities Exchange Act of 1934 – must file with the SEC a statement of ownership regarding those securities
Methodology 21
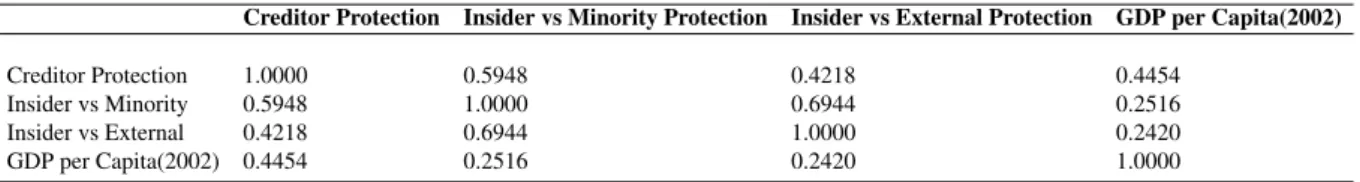
Table 3 – Correlation among investor protection indexes.
Creditor Protection Insider vs Minority Protection Insider vs External Protection GDP per Capita(2002)
Creditor Protection 1.0000 0.5948 0.4218 0.4454
Insider vs Minority 0.5948 1.0000 0.6944 0.2516
Insider vs External 0.4218 0.6944 1.0000 0.2420
GDP per Capita(2002) 0.4454 0.2516 0.2420 1.0000
This table displays the correlations among the investor protection indices obtained through factor analysis.
enhancements2. Again, the remedial measure is negatively correlated to the two other measures of shareholder protection, as expected: -.29 in respect to the anti-selfdealing index and -0.311 to the Revised Anti-director Rights index. Anti-selfdealing and anti-director rights correlation amounts to 0.694.
Once again common-law countries are more protective: Hong kong and Singapore leads in this dimension while french law countries populate the opposite side, Venezuela at the bottom.
4.4.2.2 Shareholder Protection: External Investor Protection
Disclosure requirements relates to information that need to be disclosed previous and during the issuance process and the liability standard to the degree of which promoter’s or insiders can be held reliable for the operation. The public enforcement index encompasses characteristics of the institution designated to supervise the securities issuance: independence from government, power to regulate and power to investigate and to apply sanctions are part of the measure.
This dimension is intended to cover the quality of the protection of the investors acquiring any securities, but I choose to locate them as a subcategory of shareholder’s protection based on the following: the creation of this measure follows lawyers description of how an hypothetical litigation would disentangle in a given country, the conflict litigate however is an IPO, so there is doubt concerning whether a bond issuance would be prone to the similar mechanisms.
The correlation among the disclosure requirements and the liability standard measure is moderate: 0.552, disclosure requirements show a 0.4286 correlation with public enforcement and the former correlates to a 0.3457 coefficient with liability standard. The United Stats leads this dimension, followed by Canada. Ecuador, Austria and Germany present the worse performance in this indicator: legal origin-wise the pattern is the same in the three measures.
4.4.3 Analysis
Table 3 and figures from 1 to 3 plots present the correlation among the indices created and the country pairwise distribution:
2 Although I make one further change: in Brazil the mandatory dividend is presumed 50%, unless stated in the
corporate bylaw. However, scholar do use the 25% mandatory dividend pervasively and it does seem more aligned with corporate practices.
Methodology 22
Creditor Protection correlation with Insider vs Minority is 0.5948, with Insider vs External it is 0.4128, while Insider vs Minority and Insider vs External figure is 0.694.This information can be better supported by figures 1-3.
Figure 1: Scatter Plot: Creditor Protection vs Insider vs Minority Protection
This graph displays the scatter patterns of the Creditor Protection Index against the Minority Protection Index
Methodology 23
This graph displays the scatter patterns of the Creditor Protection Index against the External Investor Protection.
Methodology 24
This graph displays the scatter patterns of the Minority Protection Index against the External Protection Index
It raises a concern that any estimates obtained are tainted by an omitted variable which drive both measures. Economic development would be the likely candidate, therefore I provide in Table 3 the correlation of GDP per capita (2002) and the variables created.The high correlation between the variables depicted in Table 3 seem to be partly due to cross-sectional differences in economic development. To account for this confounding effect I include the time series of GDP per capita as a control in the model.
Another outcome from the higher correlation follows: Researches such asCastro, Martins, Schiehll and Terra(2016),Pinkowitz, Stulz and Williamson(2006) generate dummies identifying observations which are below or above the median of the protection indexes. However, the low concentration of countries in some quadrants of this graphs (fourth quadrant of the first scatter plot, second quadrant of the second and the third) imposes a diversion from this method. Any estimate generated from one of the underpopulated quadrants would be too vulnerable to unobservable characteristics of one of the countries. As a sidestep I use the crude values of the variables created instead of dummies.
Methodology 25
Table 4 – Investor Protection Descriptives
Country Creditor Protection Above Median Insider vs Minority Above Median Insider vs External Above Median
Argentina -1.413 0 -1.047 0 -.7543 0 Australia 2.076 1 .9791 1 1.373 1 Austria 1.506 1 -1.067 0 -2.11 0 Belgium .9325 1 -.0451 0 -1.015 0 Brazil -1.877 0 .1673 1 -1.179 0 Canada .51 1 .7186 1 2.441 1 Chile -.4683 0 .365 1 -.2522 0 Colombia -2.752 0 -.5071 0 -1.163 0 Denmark .9291 1 .3136 1 .2185 1 Ecuador -3.693 0 -2.176 0 -2.192 0 Egypt -1.824 0 -.8142 0 -1.004 0 Finland .4934 1 .0291 1 -.1096 0 France -1.506 0 -.1467 0 .3699 1 Germany 1.071 1 -.3665 0 -1.784 0 Greece -1.517 0 -1.698 0 -.9892 0 Hong Kong 2.926 1 1.988 1 1.79 1 Ireland .4416 1 1.595 1 -.002 0 Israel 1.629 1 .9069 1 .9308 1 Italy -.3771 0 -.8683 0 -.4933 0 Japan .4795 1 .6671 1 .0325 0 Jordan -1.416 0 -1.991 0 -.2438 0 Malaysia 1.26 1 1.959 1 1.743 1 Mexico -1.49 0 -.8864 0 -1.12 0 Netherlands 2.224 1 -1.089 0 .5883 1 New Zealand 2.976 1 1.416 1 -.0306 0 Norway .5863 1 -.0525 0 -.2547 0 Peru -2.128 0 .0134 1 .0346 1 Philippines -1.058 0 -.2452 0 2.139 1 Portugal -.4497 0 -.543 0 -.1154 0 Republic of Korea .2481 1 .5996 1 .4689 1 Singapore 2.248 1 2.072 1 2.014 1 South Africa 1.082 1 1.649 1 .693 1 Spain .3833 1 .6565 1 -.0785 0 Sweden -.373 0 -.2503 0 -.408 0 Switzerland -2.004 0 -.6729 0 -.3112 0 Taiwan -2.307 0 4.7e-04 1 .6872 1 Thailand .1887 0 1.105 1 .8376 1 Turkey -1.179 0 -.3056 0 -.6607 0 U.K 3.009 1 1.959 1 1.254 1 U.S.A .3566 1 .203 1 2.681 1 Uruguay .116 0 -2.169 0 -2.345 0 Venezuela .1618 0 -2.419 0 -1.682 0
This table displays the country-wise measures of investor protection and also the indicator variable that identifies when these measures are about the country-level median of the sample.
4.4.4 Model
The aim of this paper is to assess a moderator effect of investor protection over pre-cautionary cash savings. Therefore I choose to construct the empirical strategy in this paper as an amalgamation of the model proposed by Almeida, Campello and Weisbach(2004) and the outline ofCastro, Martins, Schiehll and Terra(2016). I also add variables indicated in the literature as influential to cash savings out of cash-inflows, as described in subsection 4.3.1
The model is constructed with variation of Cash Holding on the left side. Firm Liquidity and its interaction with Cash-Flow are also added as explanatory variables, because those ele-ments are pointed as moderators of the Cash-flow Sensitivity of Cash (ALMEIDA; CAMPELLO, 2007).GrowthOpportunitiesi,t makes it into the model to control for growth opportunities,
this way we guarantee any sensitivity estimated does not stem from correlation between invest-ment opportunities and cash inflow size. Sizei,t controls for likely economies of escale in cash
Methodology 26
Acquisitions, ∆N W Ci,tand ∆ShortDebti,t intends to control for sources and uses of funds,
so the model is less vulnerable to confounding effects.
The errors are clusterized at the Country×Year level and Year and Industry fixed effects are added to control for any time-invariant unobservable characteristic that could drive the results.
∆CashHoldingsi,t = α0+ α1CashF lowi,t+ α2Sizei,t+ α3Qi,t+
α4InsidervsM inorityi,t+ α4CreditorP rotectioni,t+ α5InsidervsExternali,t
α6InsidervsM inorityc,t× CashF lowi,t+ α7CreditorP rotectionc,t× CashF lowi,t
+ α8InsidervsExternali,t× CashF lowi,t+ Controls (1)
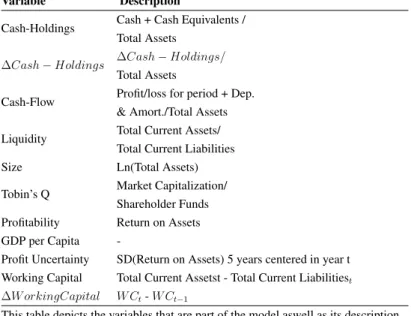
Table 5 – Description of the Variables
Variable Description
Cash-Holdings Cash + Cash Equivalents / Total Assets
∆Cash − Holdings ∆Cash − Holdings/
Total Assets
Cash-Flow Profit/loss for period + Dep. & Amort./Total Assets
Liquidity Total Current Assets/
Total Current Liabilities
Size Ln(Total Assets)
Tobin’s Q Market Capitalization/
Shareholder Funds
Profitability Return on Assets
GDP per Capita
-Profit Uncertainty SD(Return on Assets) 5 years centered in year t Working Capital Total Current Assetst - Total Current Liabilitiest
∆W orkingCapital W Ct- W Ct−1
This table depicts the variables that are part of the model aswell as its description.
4.5
Classification Scheme
The impact of Cash-Flow over the dependent variable is expected to be positive for constrained firms and indeterminate for the unconstrained ones.
In order to evaluate this pattern in the data, the next logical step is to split the samples among constrained and unconstrained firms. The spectrum of potential measures for classification is broad. Trivial classification focus on pay-out ratio, size, bond rating and commercial paper rating.There are also composite constructs such as the Kaplan Zingalez index(KZ index), the Whited Wu index (WW index) and the Size and Age index (SA index). The validity of each individual variable has been challenged overtime, a common approach to sidestep these critiques is to use bundle of classification schemes. In the choice of which ones to use I followHadlock
Methodology 27
and Pierce (2010) who classify a number of firms on levels of financial constraint based on financial reports and proceed to fit multiple ordered logits in order to measure the precision of various classification rules.
Hadlock and Pierce(2010) evaluate three compound measures: the KZ index, which is derived from theKaplan and Zingales(1997) diatribe; WW index, which was proposed inWhited and Wu(2006b), is an estimation of an investment Euler equation via GMM; and the SA index, which stands for Size and Age and was proposed byHadlock and Pierce(2010). They conclude that the KZ index is not reliable, as does Almeida, Campello and Weisbach (2004).Hadlock and Pierce(2010) points that evidence relative to the WW index is mixed and that the effect of Size- which compounds the index together with cash-flow, a dividend payer dummy, leverage, industry sales growth and firm sales growth- dominates the other five, in fact, in their sample, they find only Size and the dividend payer dummy to be significant (yet the impact of the latter is marginal). The SA index is also dominated by Size and they conjecture that Size stops impacting financial constraint at 4.5 billion (2004 dollars) and age, at 37 years.
The choice of the classification scheme is so important thatMoyen(2004) finds it can explain theKaplan and Zingales(1995),Kaplan and Zingales(1997),Kaplan and Zingales(2000) and Fazzari, Hubbard, Petersen, Blinder and Poterba (1988),Fazzari, Hubbard and Petersen (2000) quarrel. She refutes that classifying firms with low dividend payments as constrained actually originates to much of a measurement error. The results for constrained firms would be, therefore, tainted by the misclassification of unconstrained firms as constrained.Cleary(1999) also concludes thatFazzari, Hubbard, Petersen, Blinder and Poterba(1988) missclassify firms financial status and that it causes their much debated results.
In the present study, obtaining lower estimates of the cash flow sensitivity of cash for countries with stronger investor protection could be due to misclassification of firms: imagine that, as we define a threshold to sort firms as constrained depending on their characteristics, it is likely that two firms with similar characteristics should not receive the same classification. That’s straightforward when one needs to rely on classification schemes to group elements and that the characteristic one is willing to classify firms by can not be observed, most of times it is possible to argument that the misclassified itens are so few compared to the whole group that they will not influence the inferences as much. What makes it troublesome is the possibility that misclassification occur systematically with the level of investor protection. As we obtain lower cash flow sensitivities for countries with stronger investor protection, this could be due to a larger rate of misclassification of unconstrained firms (who we expect to present lower sensitivities) as constrained and not due to a relief on financial constraints on the constrained firms.
4.5.1 Size and Age index
The Hadlock and Pierce measure of financial constraint (HADLOCK; PIERCE,2010), or SA (size and age) index, is based on the observation that the impact of Size is stronger at
Methodology 28
lowers level of size, and that age contributes linearly up to the moment the firm reaches 37 years. Size is capped at 4.5 Billion US dollars (2004) and age at 37 years. The calculation follows the equation below.
SA = −0.737 × log(Sizeit) + 0.043 × log(Sizeit)2− 0.04 × Ageit (2)
I proxy Size by Total Assets, for consistency with their paper.
4.6
Switching Regressions
The problem of classifying firms by a priori characteristics was explored inHu and Schiantarelli(1998). The authors summarize the drawbacks of the approach as such: first, the variable by which the partition is made may be a inaccurate proxy, second, changes in the firms’ financial status may not be observed (as I classify firm-years, that should not be a problem) and third, a correlation between the variable used to classify firms and the dependent variable may cause endogenous selection. The authors propose the use of switching regressions to guarantee their results are not prone to these problems.
Hovakimian and Titman (2006) makes another point on the matter as they posit that conflicting results on the financial constraints literature may stem from sensitivity of results to the criterion for sample splits and also suggests the switching regression approach to deal with this problem.
The switching regression technique demands only that the number of distinct investment regimes is known ex-ante, meaning, in the case of this study, that we have two different regimes: one for constrained firms and one for the unconstrained ones. Furthermore by adjusting a switching regression with unknown separation points, one gets estimates for the cash-holdings equations of both groups of firms and also a set of estimates of how variables shift the probability of classifying a firm into one regime or the other, so we can investigate what drives the firm’s status.
This framework should perform well for the purposes of this research as the theory predicts two regimens: one with a positive propensity to save out of cash-inflows and one with a trendless propension, namely the constrained regime and the unconstrained.
A switching regression where one expects to exist two different cash saving regimes fits three equations:
∆Cash − Holdings1it = Xitβ1+ u1it (3)
∆Cash − Holdings2it = Xitβ2+ u2it (4)
Results 29
Where Xit is the vector of variables who makes into the model and Zitis the set of
variables which are relevant to classify a firm as constrained or unconstrained.β1, β2 and γ are
obtained via maximum likelihood estimation. The sets Xitand Zitmay share as many elements
as desired.
Equations (3) and (4) are the Cash-Holding equations for the two regimes and equation (5) gives the likelihood that a firm operates on regime 1 (equation(3)) or regime 2(equation(4)), Yit∗measures the likelihood that a firm is part of the first or the second regime:
Iit = I1it if Yit∗ < 0 (6)
Iit= I2itif Yit∗ ≥ 0 (7)
The selection regression (4) includes Size, Short Term Debt, Long Term Indebtedness, Liquidity, GDP per Capita, Earnings Volatility and the measures of investor protection. This equation allow us to assess the relative importance of a given classification variable, while controlling for other factors that jointly determine the likelihood of being in one of the regimes. A rather complete discussion of the factors in this equation can be read in Hovakimian and Titman(2006).
The regimes are composed of the variables of most interest for this text: Cash-Flow, the measures of investor protections and its interactions with Cash-Flow; and also the controls: Growth Opportunities, Size, GDP per Capita, ∆W C, Capex, Short Term Debt.
5
Results
5.1
OLS
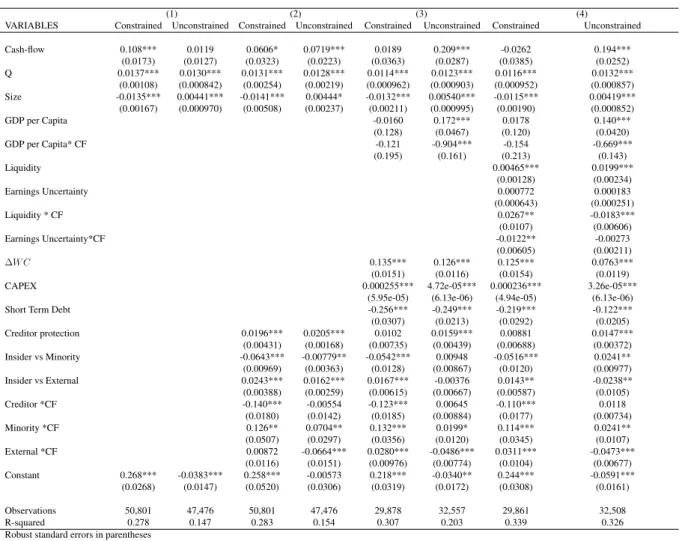
Table 6 presents the coefficients for the regressions. The constrained sample comprehends firms whose the SA index is in the upper 3 deciles, and the constrained one, firms in the lower 3 deciles. Industry and Year fixed effects are always included. Error is clustered at the Country × Y ear level.
The first two columns are a plain simple estimation of the cash-flow sensitivity of cash when we add only size and Growth Opportunities as controls. As expected the coefficient on cash is positive and significant for the constrained firms and not significantly different from 0 for the unconstrained firms. The Growth opportunities coefficient- a proxy for the Q-sensitivity of cash- is associated with higher cash reserves in both sub-samples, conflicting with ??) that it should be positive for the constrained firms but unsigned for the unconstrained firms.
Results 30
5.1.1 Investor Protection and The Cash-Flow Sensitivity of Cash
From the second set of variables on, I present the variables of most importance for the scope of this research, and include some controls to add some robustness to the results: the interactions between cash-flow and the measures of investor protection. The effect of creditor protection on the cash-flow sensitivity of cash is always negative for the constrained sub-sample and always not significantly different from 0 for the unconstrained ones.
The insiders vs minority protection interacts positively with cash-flows and is significant for all the specifications, however the economic significance for the unconstrained firms is small when compared with the constrained ones. This result is puzzling. Although stock market may not be an appealing funding option for constrained firms (as they tend to be smaller and suffer from higher information asymmetry problems), the fact that is related to a higher sensitivity is conflicting with evidence discussed inDittmar, Mahrt-Smith and Servaes(2003),Kalcheva and Lins(2007) and with my hypothesis 1. The Insider vs External × cash-flow coefficient is always negative for unconstrained firms and positive for the constrained. The result concerning the unconstrained batch is straightforward as this usually larger more well known companies should be more likely to search funding at public markets (GOMES; PHILLIPS,2005). The coefficient for the constrained firms, however,also refutes hypothesis number one. A likely explanation could be that constrained firms competing in environments where the capital markets development favors the unconstrained ones, are driven to keep higher cash reserves.
In a separate set of regressions I substitute the level of investor protection for dummies indicating that a given measure is above the median for that measure. This set-up reduces the number of conflicting evidence as the creditor protection remains related to a reduction on the cash-flow sensitivity of cash for the constrained firms and unrelated to it in the unconstrained ones. Also, while still related to higher CFSC for the constrained firms, the Minority protection × cash-flow coefficient is now negative for the unconstrained sub-sample. External investor protection × cash-flow is never significant. The sensitivity of the results for the protection measures to the parametrization methods cast doubts on the robustness of this results.
5.2
Switching Regression
Another possibility to accommodate the conflicting results present on the first portion of this section is that the Hadlock and Pierce index is not screening the firms financial status efficiently. I perform a Switching Regressions approach to evaluate this possibility.
The correlation coefficient between the Hadlock and Pierce index and the Probabilities obtained in the Selection equation equals -0.001. This is virtually 0 correlation. Note: we should expect a negative correlation, as lower scores in the Hadlock and Pierce index mean unconstrained status and the selection equation estimates the probability of being unconstrained.
Results 31
Table 6 – OLS Regression on the Constrained and Unconstrained Sub-samples
(1) (2) (3) (4)
VARIABLES Constrained Unconstrained Constrained Unconstrained Constrained Unconstrained Constrained Unconstrained
Cash-flow 0.108*** 0.0119 0.0606* 0.0719*** 0.0189 0.209*** -0.0262 0.194*** (0.0173) (0.0127) (0.0323) (0.0223) (0.0363) (0.0287) (0.0385) (0.0252) Q 0.0137*** 0.0130*** 0.0131*** 0.0128*** 0.0114*** 0.0123*** 0.0116*** 0.0132*** (0.00108) (0.000842) (0.00254) (0.00219) (0.000962) (0.000903) (0.000952) (0.000857) Size -0.0135*** 0.00441*** -0.0141*** 0.00444* -0.0132*** 0.00540*** -0.0115*** 0.00419*** (0.00167) (0.000970) (0.00508) (0.00237) (0.00211) (0.000995) (0.00190) (0.000852) GDP per Capita -0.0160 0.172*** 0.0178 0.140*** (0.128) (0.0467) (0.120) (0.0420) GDP per Capita* CF -0.121 -0.904*** -0.154 -0.669*** (0.195) (0.161) (0.213) (0.143) Liquidity 0.00465*** 0.0199*** (0.00128) (0.00234) Earnings Uncertainty 0.000772 0.000183 (0.000643) (0.000251) Liquidity * CF 0.0267** -0.0183*** (0.0107) (0.00606) Earnings Uncertainty*CF -0.0122** -0.00273 (0.00605) (0.00211) ∆W C 0.135*** 0.126*** 0.125*** 0.0763*** (0.0151) (0.0116) (0.0154) (0.0119) CAPEX 0.000255*** 4.72e-05*** 0.000236*** 3.26e-05***
(5.95e-05) (6.13e-06) (4.94e-05) (6.13e-06) Short Term Debt -0.256*** -0.249*** -0.219*** -0.122*** (0.0307) (0.0213) (0.0292) (0.0205) Creditor protection 0.0196*** 0.0205*** 0.0102 0.0159*** 0.00881 0.0147*** (0.00431) (0.00168) (0.00735) (0.00439) (0.00688) (0.00372) Insider vs Minority -0.0643*** -0.00779** -0.0542*** 0.00948 -0.0516*** 0.0241** (0.00969) (0.00363) (0.0128) (0.00867) (0.0120) (0.00977) Insider vs External 0.0243*** 0.0162*** 0.0167*** -0.00376 0.0143** -0.0238** (0.00388) (0.00259) (0.00615) (0.00667) (0.00587) (0.0105) Creditor *CF -0.140*** -0.00554 -0.123*** 0.00645 -0.110*** 0.0118 (0.0180) (0.0142) (0.0185) (0.00884) (0.0177) (0.00734) Minority *CF 0.126** 0.0704** 0.132*** 0.0199* 0.114*** 0.0241** (0.0507) (0.0297) (0.0356) (0.0120) (0.0345) (0.0107) External *CF 0.00872 -0.0664*** 0.0280*** -0.0486*** 0.0311*** -0.0473*** (0.0116) (0.0151) (0.00976) (0.00774) (0.0104) (0.00677) Constant 0.268*** -0.0383*** 0.258*** -0.00573 0.218*** -0.0340** 0.244*** -0.0591*** (0.0268) (0.0147) (0.0520) (0.0306) (0.0319) (0.0172) (0.0308) (0.0161) Observations 50,801 47,476 50,801 47,476 29,878 32,557 29,861 32,508 R-squared 0.278 0.147 0.283 0.154 0.307 0.203 0.339 0.326 Robust standard errors in parentheses
*** p<0.01, ** p<0.05, * p<0.1.
Panel OLS with Year and Industry Fixed Effects. Dependent variable is ∆CashHoldings scaled by Total Assets.The independent variables Cash-Flow, Q, Size, ∆W C, earnings uncertainty and Short Term Debt are obtained from Bureau Van Dijk’ Osiris database. GDP per capita is obtained from World Bank,
except from Taiwan, which is obtained from the IMF. The measures of investor protection are calculated as exposed in session 4.4. Errors clustered at Country*Year Level.
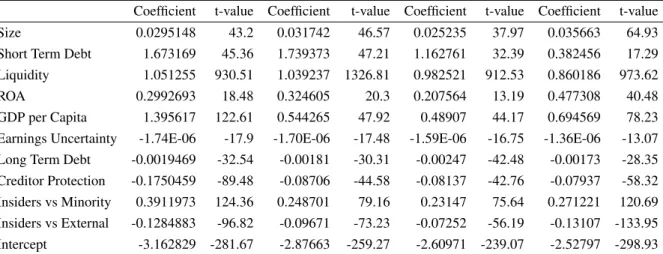
5.2.1 Selection Model
I present a table with 4 columns for the selection model because I fitted three distinct models at the Cash Savings Equation Stage. The coefficients are nearly unchanged among the columns. All coefficients are significant at the 1% level.
These coefficients are used to generate the measure which discriminates firms between the constrained regime and the unconstrained one. As the coefficients for Size and ROA are positive, we associate higher scores with the unconstrained regime and lower score with the constrained one.
Most of the results are according to the literature: Higher levels Size, higher ROA and Liquidity will cause an increase on the probability of being unconstrained. At the country level, higher GDP per capita and the Insider vs Minority measure are associated with less constraints. The former can be interpreted as an effect of the economic development. Higher Long Term Debt to total assets is associated more constraints. Firms with higher costs of bankrupcy face in order to obtain extra financing.
Results 32
Table 7 – Median probability of being unconstrained by legal origin
French Common Law Scandinavian German Median Probability
of being unconstrained 17.2% 26.1% 21.0% 26.6%
Short term debt increases the probability that a firm will be classified in the unconstrained regime. This result is partially puzzling asHovakimian and Titman(2006) obtains the inverse of this result. As this work fits investment equations and mine cash management equation, this result I obtained could be due to usage of Short Term Debt as a source of liquidity for firms with low access to capital markets.
The coefficient for the creditor protection and insiders vs external protection present results opposing to what my hypotheses suggest, since their interpretation is that companies in environments with a greater degree of protection are in a higher probability of following the constrained regime. On the other hand it suggests that GDP per capita may be performing well in capturing the correlation between investor protection and economic development. It could be straightforward to point that creditor protection and insiders vs external investor protection could work similarly to the legal reserves or the mandatory dividends, but the descriptive analysis section shows that the french law countries are the ones less protective of its investors. The mean probability of being unconstrained for each legal origin is shown in table. This result is hard to accommodate with the evidence.
The coefficients for the regimes are in accordance with the cash-flow sensitivity of cash: they are positive for the constrained firms, negative or not distinguishable from zero for the unconstrained and the factors associated with a constrained one are also associated with larger CFSC (notice the negative interactions). This gives substance for the view that, despite some of the coefficients posing strange signals, the allocation rule performs fairly.
5.2.2 Cash Savings Equation
I fit three models to assess how robust are the coefficients of the interactions between the measures of protection and the cash-flow to the inclusion of liquidity, earnings uncertainty and GDP per capita.
In Table 10, Equations (1) and (2) for the constrained batch present significant positive CFSC. This measure becomes negative on equation (3). On this equation I added earnings uncertainty and liquidity together with their interaction with Cash-flow, these results corroborates with the results fromRiddick and Whited(2009) that states that earnings volatility is one of the main drivers for the cash hoarding, and so, when controlling for this variable, the CFSF is sharply reduced for the constrained equation. The effect of liquidity on the CFSC also relates to the research ofFrancis, Hasan, Song and Waisman(2013), which points that higher liquidity makes firms less dependent on internal funding.Almeida, Campello and Weisbach(2011) Also
Results 33
Table 8 – Selection Equation
Coefficient t-value Coefficient t-value Coefficient t-value Coefficient t-value Size 0.0295148 43.2 0.031742 46.57 0.025235 37.97 0.035663 64.93 Short Term Debt 1.673169 45.36 1.739373 47.21 1.162761 32.39 0.382456 17.29 Liquidity 1.051255 930.51 1.039237 1326.81 0.982521 912.53 0.860186 973.62 ROA 0.2992693 18.48 0.324605 20.3 0.207564 13.19 0.477308 40.48 GDP per Capita 1.395617 122.61 0.544265 47.92 0.48907 44.17 0.694569 78.23 Earnings Uncertainty -1.74E-06 -17.9 -1.70E-06 -17.48 -1.59E-06 -16.75 -1.36E-06 -13.07 Long Term Debt -0.0019469 -32.54 -0.00181 -30.31 -0.00247 -42.48 -0.00173 -28.35 Creditor Protection -0.1750459 -89.48 -0.08706 -44.58 -0.08137 -42.76 -0.07937 -58.32 Insiders vs Minority 0.3911973 124.36 0.248701 79.16 0.23147 75.64 0.271221 120.69 Insiders vs External -0.1284883 -96.82 -0.09671 -73.23 -0.07252 -56.19 -0.13107 -133.95 Intercept -3.162829 -281.67 -2.87663 -259.27 -2.60971 -239.07 -2.52797 -298.93 Selection Equation. Regimen equation is given by equation 1.The independent variables Cash-Flow, Q, Size, Short Term Debt, Long Term Debt, ROA and Liquidity, Earnings Uncertainty obtained from Bureau Van Dijk’ Osiris database. GDP per capita is obtained from World Bank,except from Taiwan, which is obtained from the IMF. The measures of investor protection are calculated as exposed in session 4.4.
notice that if a given firm has other means, that not holding cash, to transfer wealth through time, the CFSF can be negative, being the maintenance of liquidity one of such means. Also note that the CFSC for the constrained batch is always higher than for the equivalent unconstrained one, even when the constrained sub-sample presents negative coefficient on cash-flow, the model fit with the unconstrained portion will present a more negative coefficient. Notice, however, that these effects are subject to the same discussion on section 5.1.2.
Also notice that, again the Q-sensitivity of cash is always positive and significant.
5.3
Investor Protection
Now a turn to the interactions between Investor protection measures and Cash Flow. Creditor × Cash-Flow is always negative, and significant for both sets of companies, suggesting that creditor protection is efficient not only to relief firms financial constraints but also makes unconstrained companies less prone to build up financial slack. This evidence is favorable towards hypothesis 2.
The fact that the Insiders vs Minority interaction with cash-flow is positive is particularly puzzling. Once again I obtain that the environments where law is more protective of minority shareholders are related to a higher sensitivity of savings to the size of the cash inflows.
For the Investor vs External coefficients, on the other hand, evidence is such that more protection means smaller cash stocks and less cash hoardings out of cash inflows. It must be no-ticed that the Investor vs External × Cash-Flow interaction is only significant for the constrained batch after the inclusion of the Earnings Uncertainty and Liquidity and the correspondent interac-tions, and still with little economic relevance. That is not surprising as constrained firms are less