Chemical composition of cork, phloem and xylem of
Quercus suber L. from different provenances
Ricardo Alexandre Rodrigues Costa
Dissertação para obtenção do Grau de Mestre em
Engenharia Florestal e dos Recursos Naturais
Orientador: Professora Helena Margarida Nunes Pereira
Co-orientador: Doutora Ana Carina dos Santos Lourenço
Júri:
Presidente: Doutora Maria da Conceição Brálio de Brito Caldeira, Professora Auxiliar do Instituto Superior de Agronomia da Universidade de Lisboa
Vogais: Doutor José Afonso Rodrigues Graça, Professor Auxiliar com Agregação do Instituto Superior de Agronomia da Universidade de Lisboa
Doutora Ana Carina dos Santos Lourenço, Bolseira de Pós-Doutoramento da Fundação para a Ciência e a Tecnologia
Doutora Vanda Cristina Paiva Tavares de Oliveira, Bolseira de Pós-Doutoramento da Fundação para a Ciência e a Tecnologia
i
“Tomorrow owes you the sum of your yesterdays.
No more that than. And no less.”
Robin Hobb
ii
A composição química de cortiça, floema e xilema foi determinada em árvores jovens de
Quercus suber L. de três proveniências (Alcácer do Sal, Azeitão e Santiago do Cacém) de
uma importante região de produção suberícola em Portugal, tendo em vista a análise de eventuais diferenças entre proveniências. Foram estudadas três árvores por proveniência, determinando-se o conteúdo em cinzas, extractivos (solubilizados em diclorometano, etanol e água), suberina (no caso da cortiça), lenhina e polissacáridos. Os três tecidos mostraram grandes diferenças na sua composição química. A composição química média da cortiça foi a seguinte: 0,66 % em cinzas, 11,7 % extractivos, 42,3 % suberina, 24,1 % lenhina e 16,2 % polissacáridos; do floema 2,9 % cinzas, 4,5 % extractivos, 38,0% lenhina e 49,1 % polissacáridos; e do xilema 1,1 % cinzas, 5,6 % extractivos, 23,4 % lenhina e 64,6 % polissacáridos. A análise estatística mostrou que a proveniência apenas foi um factor de variação significativo para os extractivos em etanol no caso da cortiça e os polissacáridos no floema.
A composição monomérica da lenhina de todas as amostras foi analisada por pirólise analítica a 650 ºC. A lenhina dos três tecidos difere substancialmente: o rácio S/G foi 0,12 na cortiça, 1,1 no floema e 2,3 no xilema. Os compostos obtidos por pirólise foram também identificados e, sempre que foi possível determinar a sua origem, agrupados em açúcares, lenhina e suberina (apenas nas amostras de cortiça). Os açúcares representaram 58,6 %, 63,1 % e 25,4 %, a lenhina 14,4 %, 10,4 % e 12,6 % respectivamente no floema, xilema e cortiça, e a suberina na cortiça representou 33,0 % do total dos picos dos pirogramas.
iii The chemical composition of cork, phloem and xylem of young Quercus suber trees from three different provenances (Alcácer do Sal, Azeitão e Santiago do Cacém) was studied in order to evaluate possible differences between provenances. Three trees per provenance were studied and the content of ashes, extractives (soluble in dichloromethane, ethanol and water), suberin (in case of cork), lignin and polysaccharides of each tissues was quantified. There were great differences in the chemical composition between tissues. The average chemical composition in cork was 0.66 % of ashes, 11.7 % of extractives, 42.3 % of suberin, 24.1 % of lignin and 16.2 % of polysaccharides; in phloem was 2.9 % of ashes, 4.5 % of extractives, 38.0 % of lignin and 49.1 % of polysaccharides; and in xylem was 1.1 % of ashes, 5.6 % of extractives, 23.4 % of lignin and 64.6 % of polysaccharides. Statistical analysis showed that only the ethanol extractives in cork and the total polysaccharides in phloem had a significant factor of variation between provenances.
The lignin monomeric composition of all samples was studied by analytical pyrolysis at 650 ºC. Lignin from the three tissues is substantially different: S/G ratio was 0.12, 1.1 and 2.3 in cork phloem and xylem respectively. The compounds obtained by pyrolysis were identified and were grouped in carbohydrates, lignin and suberin (in cork samples only). Carbohydrates accounted to 58.6 %, 63.1 % and 25.4 %, lignin 14.4 %, 10.4 % and 12.6 %, respectively in phloem, xylem and cork, and the suberin in cork represented 33.0 %.
iv
Três proveniências de Quercus suber foram selecionadas para a determinação da composição química sumativa da cortiça, floema e xilema com o objectivo de averiguar se existem diferença na composição química dos três tecidos entre proveniências diferentes. As mesmas são provenientes de um ensaio de proveniências estabelecido em 1998 e localizado na Herdade do Monte da Fava, em Santiago do Cacém, onde foram estabelecidas trinta e cinco proveniências de Quercus suber de países da Europa (Espanha, França, Itália e Portugal) e do Norte de África (Algéria, Marrocos e Tunísia) representativos da distribuição natural do sobreiro no mundo. As proveniências seleccionadas para este estudo foram as seguintes: 14 (Alcacer do Sal), 15 (Azeitão) e 19 Santiago do Cacém).
Foram escolhidas três árvores por proveniência, perfazendo um total de nove árvores estudadas. As árvores, de seis anos, foram cortadas em discos, e os três tecidos (cortiça, floema e xilema) foram separados manualmente. Os tecidos foram moídos num moinho de facas, inicialmente com uma malha de saída de 6 x 6 mm e depois com uma de 1 x 1 mm e crivados num crivo vibratório, e a fracção 20 – 80 mesh (180 μm – 850 μm) recolhida para a determinação da análise química sumativa. As cinzas, extractivos, suberina (apenas na cortiça), lenhina e polissacáridos (celulose e hemiceluloses) totais de todos os tecidos foram determinados de acordo com normas estandardizadas (TAPPI). Cada análise foi feita em duplicado e os resultados expressos em percentagem do material original.
Para quantificação das cinzas, 2 gramas de amostra foram incinerados a 525 ºC durante 6 horas, e o resíduo correspondeu às cinzas. Para a determinação dos extractivos totais, as amostras foram extraídas sucessivamente pelo método de Soxhlet com diclorometano (6 horas), etanol (16 horas) e água (16 horas). Após a extração das amostras procedeu-se à remoção da suberina da cortiça através de uma despolimerização por metanólise alcalina. As amostras foram refluxadas com uma solução de metóxido de sódio seguido de filtração do resíduo. A fracção líquida foi acidificada até pH 6, concentrada num rotavapor até à secura e decantada três vezes com diclorometano. A solução foi então concentrada novamente e o resíduo seco correspondido a suberina. Para a determinação da lenhina (das amostras de cortiça livres de extractivos e de suberina, e as amostras de floema e xilema livres de extractivos) foi usado o método de Klason, que consiste numa hidrólise ácida dos polissacáridos com ácido sulfúrico a 72 %. O resíduo correspondeu à lenhina Klason, e a lenhina solúvel foi estimada através da leitura do hidrolisado a 205 nm num espectrofotómetro de ultravioleta. A lenhina total correspondeu à soma da lenhina Klason e da lenhina solúvel. Para a determinação dos polissacáridos totais, os monossacáridos neutros (arabinose, galactose, glucose e xilose, os ácidos urónicos (galacturónico e glocurónico) e acético foram
v Os três tecidos mostraram grandes diferenças na sua composição química. A composição química média (nas três proveniências) da cortiça foi 0,66 % de cinzas, 11,7 % de extractivos, 42,3 % de suberina, 24,1 % de lenhina total e 16,2 % de polissacáridos; do floema foi 2,7% de cinzas, 4,5 % de extractivos, 38,0% de lenhina de lenhina total e 49,1 % de polissacáridos; e do xilema foi 1,1 % de cinzas, 5,6 % de extractivos, 24,1 % de lenhina e 64,6 % de polissacáridos. A cortiça destaca-se pela elevada quantidade de suberina, inexistente nos restantes tecidos, e com uma grande variabilidade entre as nove árvores estudadas, variando de 35,2 % a 48,0 %; o floema pela elevada quantidade de lenhina; e o xilema pela elevada quantidade de polissacáridos.
Relativamente à variabilidade da composição química dos tecidos entre diferentes proveniências foi realizada análise estatística através de análise de variâncias (ANOVA) com comparações de médias (Teste de Tukey, p<0.05). Apenas os extractivos totais em etanol na cortiça, e os polissacáridos totais no floema tiveram um factor de variação significativo entre as três proveniências. Em relação aos outros componentes da análise química não houve qualquer diferença entre proveniências quer na cortiça, floema e xilema. Tal deveu-se ao pequeno número de proveniências estudadas (apenas três).
As amostras de cortiça, floema e xilema, e de cortiça sem suberina foram analisadas através de pirólise analítica. Aproximadamente 100 µg de cada amostra foram pirolisadas a 650 ºC durante 10 s num pirolisador CDS Pyroprobe 5150 e a fase gasosa separada numa coluna capilar, ZB-1701, por cromatografia gasosa numa Agilent GC 7890B e os compostos identificados num detector de massa 8977B. Os compostos identificados foram agrupados em açúcares totais, lenhina total e suberina total (apenas nas amostras de cortiça).
As amostras de cortiça livres de extractivos foram caracterizadas com 25,4 % de açúcares totais, 12,6 % de lenhina total e 33,0 % de suberina (médias das três proveniências). Nas amostras de cortiça livres de extractivos e suberina, não foram encontrados compostos de suberina, o que resultou num aumento percentual na quantidade de açúcares totais e lenhina total, 37,1 % e 34,4 %, respectivamente. As amostras de floema foram caracterizadas com 58.6 % de açúcares e 14,4 % de lenhina; e nas amostras de xilema, 63,1 % de açúcares e 10,7 % de lenhina.
As amostras de cortiça extractadas e as de cortiça desuberinizadas tiveram um valor de rácio S/G bastante semelhante, 0,12 e 0,28 respectivamente, o floema 1,1 e o xilema 2,3, o que mostra um aumento no rácio S/G da periferia para o centro da árvore, ou seja, um aumento do rácio S/G da cortiça, para o floema e para o xilema.
vi
O floema é caracterizado por lenhina do tipo G e S (1:2.6:2.7) e o xilema por lenhina do tipo S, tendo mais do dobro de unidades S relativamente às unidades G (1:2.0:4.5).
Foi também estudada a variação da cor dos três tecidos em função das sucessivas extracções. Para tal mediu-se a cor do material inicial e após cada extracção com diclorometano, etanol e água num espectrofotómetro Minolta CM-3630. Os parâmetros de cor medidos foram o CIE L*a*b*. Em relação ao parâmetro L*, os valores foram diminuindo com cada extracção ou seja, foram ficando mais escuros, 58,8, 50,9, 48,8 e 46,0 na cortiça, e 44,5, 43,5, 42,7 e 39,8 no floema, do material originário, seguido de extracção com diclorometano, etanol e água. No xilema, o valor de L* diminuíram com a extração de diclorometano e etanol, mas aumentou na extracção com água, 55,8, 54,8, 53,7 e 55,8, respectivamente. Relativamente aos parâmetros a*b* a cortiça e o floema diminuem de valor em ambos ficando relativamente mais azulados e esverdeados do material originário para cada extracção sucessiva. No xilema o valor de b* diminui com cada extração ficando relativamente mais azulado, mas no valor de a* aumenta do material originário para a última extracção, ficando relativamente mais avermelhado.
vii
1. Objectives ... 1
2. Introduction ... 2
2.1 Quercus suber L. ...2
2.2 Cork, phloem and xylem ...3
2.2.1 Formation ...3 2.2.2 Chemical composition ...5 Inorganic components...5 Extractives ...6 Suberin ...6 Polysaccharides...7 Lignin ...8
2.3 Quercus suber chemical variability ...9
3. Material and methods ... 11
3.1 Sampling ...11
3.2 Chemical analysis ...12
3.2.1 Ash determination...12
3.2.2 Extractives determination ...12
3.2.3 Cork methanolysis ...12
3.2.4 Klason and soluble lignin determination ...13
3.2.5 Neutral monosaccharides, acetate and uronic acids determination ...13
3.3 Statistical analysis ...14
3.5 Analytical pyrolysis (PY-GC/MS) ...14
3.4 Color measurements ...14 4. Results ... 16 4.1 Chemical Composition ...16 4.2 Pyrolysis ...23 4.3 Color Measurements ...28 5. Discussion ... 30
5.1 Chemical composition of cork, phloem and xylem ...30
5.2 Chemical differences between cork, phloem and xylem ...31
5.3 Provenances variation...33 5.4 Py-GC/MS ...34 5.5 Color ...35 6. Conclusion ... 37 7. References ... 38 Annex ... 43
viii
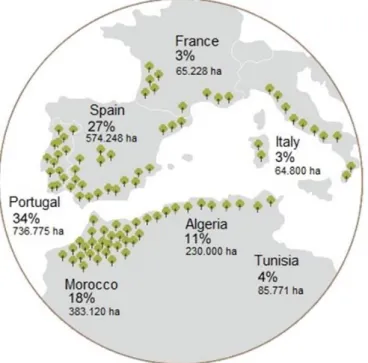
Figure 1. Distribution of the cork oak in the world. ...2
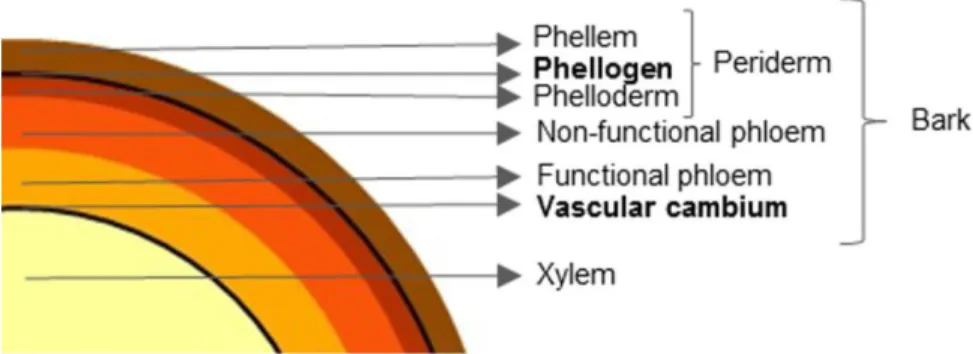
Figure 2. Cross section of a tree representing the wood (xylem), the functional and non-functional xylem and the periderm and its constituents. Adapted from (Leite & Pereira, 2017) ...3
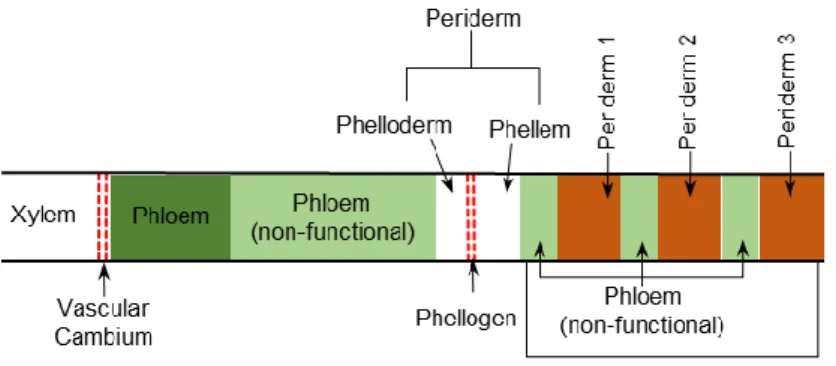
Figure 3. Schematic representation of the radial tissue organization of a tree stem. Adapted from (Pereira, 2012a; Şen, et al., 2015). ...4
Figure 4. Representation of a tree stem of the cork oak. Adapted from (Pereira, 2012a; Şen, et al., 2015). ...4
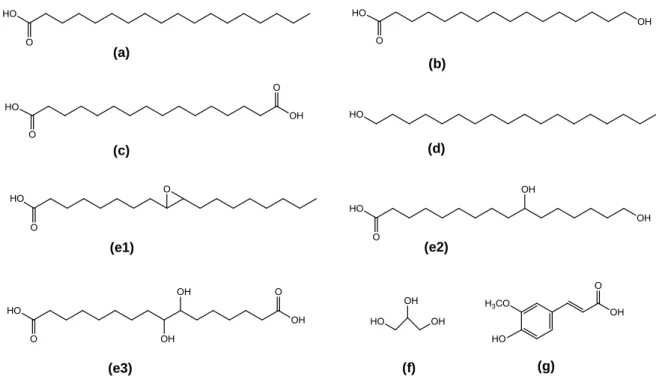
Figure 5. Common structures of suberin monomers obtained after cork depolymerasation followed by GC-MS separation and identification. (a) Unsubstituted fatty acids (C18 to C24 saturated). (b) ω-hydroxy fatty acids (C16 to C26 saturated or C18 with one insaturation). (c) α,ω-dicarboxylic acids (C16 to C26 saturated or C18 with one or two insaturations. (d) 1-alkanols (C18 to C22 saturated). (e) Mid-chain functionalized monomers; (e1) Epoxy-fatty acids (C18 saturated or with one insaturation); (e2) Polyhydroxy-fatty acids (C18 saturated); (e3) Polyhydroxy α,ω-dicarboxylic acids (C18 saturated). (f) Glycerol. (g) Ferulic acid. Adapted from (Pollard, et al., 2008). ...7
Figure 6. Partial structure of cellulose. a) Cellobiose. Adapted from (Sjöström & Alén, 2013) ...7
Figure 7. Basic monomers that make up lignin structure. ...9
Figure 8. CIE L*a*b* color scale...15
Figure 9. Suberin content of cork from the nine trees studied (% o.d. material). ...17
Figure 10. Py-GC/MC pyrograms of cork (A), desuberinized cork (B), phloem (C) and xylem (D) from Q. suber. ...24
Figure 11. Summative chemical composition of cork, phloem and xylem (mean values of nine trees, as % o.d. material). ...32
Figure 12. Monosaccharides and uronic and acetic acids composition of cork, phloem and xylem (mean values of nine trees, as percentage of total polysaccharides). ...33
Figure 13. Mean values of the three provenances of L* parameter (left figure) and a* b* parameters (right figure) from cork, phloem and xylem (values of the raw material and each successive extraction). ...36
ix
Table 1. Chemical composition of cork, phloem and xylem from the cork oak. ...5 Table 2. Details of the Quercus suber L. provenances used in this study. ...11
Table 3. Chemical composition of cork samples from the three cork oak provenances (% of
oven-dried material). Mean values, standard deviation and pairwise Tukey test. ...16
Table 4. Proportion of the extractives solubilized by dichloromethane, ethanol and water, as
% of total extractives in the cork tissue. ...17
Table 5. Composition of monosaccharides, uronic and acetic acids in the cork tissue of the
three cork oak provenances (% of total monosaccharides). ...18
Table 6. Chemical composition of phloem samples from the three cork oak provenances (%
of oven-dried material). Mean, standard deviation, and pairwise Tukey test. ...19
Table 7. Proportion of the extractives solubilized by dichloromethane, ethanol and water (% of
total extractives) in the phloem samples of the three cork oak provenances. ...20
Table 8. Composition of monosaccharides, uronic and acetic acids in the phloem tissue (% of
total monosaccharides) of the three cork oak provenances ...20
Table 9. Chemical composition of xylem samples from the three cork oak provenances (% of
oven-dried material). Mean, standard deviation values and pairwise Tukey test. ...21
Table 10. Proportion of the extractives solubilized by dichloromethane, ethanol and water (%
of total extractives) in the xylem of the three cork oak provenances. ...22
Table 11. Composition of monosaccharides, uronic and acetic acids in the xylem tissue (% of
total monosaccharides) of the three cork oak provenances. ...22
Table 12. Composition of pyrolysis products grouped by derivative families of extracted cork
and desuberinized cork (% of total chromatogram area) as determined by Py-GC/MS. ...25
Table 13. Composition of pyrolysis products grouped by derivative families of extracted
phloem and xylem (% of total chromatogram area) as determined by Py-GC/MS. ...26
Table 14. Comparison of content in carbohydrates, lignin and suberin determined by wet
chemical analysis and pyrolysis of cork, phloem and xylem. Mean of the three cork oak provenances. ...28
Table 15. Mean values of the L*, a* and b* color parameters determined in cork, phloem and
xylem for the three cork oak provenances before and after extraction with dichloromethane, ethanol and water. ...29
x
Annex
Annex 1. Chemical composition of cork samples from three trees of each provenance (mean
values of two replicates for each tree). ... 43
Annex 2. Chemical composition of phloem samples from three trees of each provenance
(mean values of two replicates for each tree)... 44
Annex 3. Chemical composition of xylem samples from three trees of each provenance (mean
values of two replicates for each tree). ... 45
Annex 4. Identified compounds and % of total area of carbohydrate, lignin and suberin derived
products from de pyrolysis of cork, desuberanized cork, phloem and xylem of Quercus suber L. C = carbohydrate derivative, CL = Low molecular carbohydrates, CP = Pyran compounds, CF = Furan compounds. Lignin derived compounds: H = p-hydroxyphenyl lignin, G = guaiacyl lignin, S = syringyl lignin units. Sub = suberin derived compounds. NI = not identified compound. ... 46
1
1. Objectives
The cork oak (Quercus suber L.) is an important tree for the western Mediterranean and North African countries. The economic value of the tree is strongly associated with the cork production, used mainly to manufacture cork stoppers for the wine industry (Pereira 2007). Therefore, to cope with bottled wine market growth and assure the sustainability of the cork oak sector, a large number of cork oak stands was planted during the last ten years of the 20th century. Since the large distribution area of the cork oak tree in Portugal, Spain, Italy, France, Algeria, Morocco and Tunisia, encompasses very different environmental conditions, it is expected that cork oaks originated from this countries are adapted to specific sets of environmental conditions, e.g. capacity to tolerate conditions of drought or temperature variance throughout the year and resistance against pests and diseases. This means, , that a cork oak originated from one of these countries may be best suited for specific types of environmental conditions and this may be used for the installation of new cork oak stands. Due to lack of knowledge on the differences in adaptation of cork oak trees originated from different regions, i.e. the lack of genetic data on the cork oak, led to creation of the European Cork Oak Network, under the EU concerted action FAIR 1 CT 95-0202, involving the seven countries in the distribution area of the cork oak. The objective of this network was to enrich the cork oak genetic research by establishing provenance trials and progeny trials in the seven countries (Varela, 2000).
In the present study, three Portuguese provenances from the provenance trial located at Herdade do Monte da Fava, in Santiago do Cacém, Southern Portugal (one of the trials established by this concerted action) were selected, and three trees per provenance were sampled. The main research objective was to evaluate if there are differences in the chemical composition of cork, phloem and xylem of the cork oak trees between the selected provenances, by using summative chemical analytical methodology and analytical pyrolysis.
2
2. Introduction
2.1 Quercus suber L.
The cork oak (Quercus suber L.) belongs to the Fagaceae family and is distributed in the southwest Europe (Portugal, Spain, France and Italy) and northwest Africa (Morocco, Algeria and Tunisia) (Figure 1), accounting to approximately a total of 2.2 million ha, with 737 thousand ha in Portugal, representing 23 % of the total area forest area in Portugal, and 34 % of the total world cork oak area (FAO 2010; Inventário Florestal Nacional 2013).
Figure 1.Distribution of the cork oak in the world. (https://www.apcor.pt/montado/floresta/)
The cork oak has a large economic importance in Portugal because of the industrial value of its outer bark i.e. the cork (Pereira 2007). The cork is removed from the tree in periodical intervals of time and although mainly used as a raw material for wine stoppers and floors, it has a set of properties that makes it very appealing for other applications. These properties, due to the cell structure and the chemical composition of cork, are as follows: i) low density, since more than 50% of the volume is air, and it can float, which can be used in floating devices (e.g. surfboards and fishing floats); ii) high compression and elastic behavior; iii) low permeability to liquids and gases, and combined with its elastic behavior makes cork excellent to be used as wine bottle stoppers; iv) high thermal and acoustic insulation and fire retardant, which makes it an insulator material (e.g. house walls and ceilings); v) high energy absorption, which makes it possible to be used in floors and in the shoes industry (Pereira, 2015).
3
Quercus suber L. has been intensely studied because of the properties and applications of
cork, but few studies exist about its phloem and wood (i.e. xylem). Some studies on cork oak wood anatomy were made by Carvalho (1996, 1997), Quilhó et al. (2003) and Sousa et al. (2009b) showingsemi-ring porosity, fibres with 1.15 mm length and vessels with 133 µm diameter. Leal et al. (2005, 2006, 2007) studied the chemical composition of wood, its properties (e.g. density and durability), and the radial vessel size variation and reported an average wood density of 0.65 g/cm3 at 12 % moisture content ; a low durability of both heartwood and sapwood. Lourenço et al. (2016) studied the chemical composition of cork, phloem and xylem of a cork oak tree and the composition and structure of the lignin in the three tissues by analytical pyrolysis and 2D-NMR spectroscopy.
2.2 Cork, phloem and xylem
2.2.1 Formation
In every tree there are two radial meristems that are responsible for diameter growth: the vascular cambium and the phellogen. The vascular cambium is the innermost meristem and produces xylem cells to the inside and phloem cells to the outside. The xylem is responsible for conducting water and gives stability to the trees and the phloem is responsible for conducting nutrients. As the tree ages and new phloem cells are produced, the phloem further away from the cambium becomes inactive. The two types of phloem are known as functional phloem (near the vascular cambium) and non-functional phloem (away from the cambium) (Figure 2) (Esau, 1960).
The phellogen is the outermost meristem and produces phelloderm cells to the inside, near the non-functional phloem, and phellem to the outside (i.e. cork cells). The phellem, phellogen and the phelloderm together are known as the periderm, and all the tissues outside the vascular cambium (i.e. the phloem, phelloderm, phellogen and the phellem) are known as the bark of trees (Figure 2) (Pereira, 2007).
Figure 2. Cross section of a tree representing the wood (xylem), the functional and non-functional xylem and the periderm and its constituents. Adapted from (Leite & Pereira, 2017)
4
In the majority of tree species, the phellogen has a limited time of life, and a new phellogen is formed inside the non-functional phloem, when the previous phellogen dies. This process can happen many times during the life of a tree, meaning that it can have several periderms alternating with non-functional phloem. The region that includes the various periderms and non-functional phloem between them is known as the rythidome (Figure 3) (Leite & Pereira, 2017).
Figure 3. Schematic representation of the radial tissue organization of a tree stem. Adapted from (Pereira, 2012a; Şen, et al., 2015).
The cork i.e. the phellem in the periderm is therefore the outer bark of the cork oak; as in other tree barks, it plays a major role in tree health (e.g. protection against animals, pathogens or environmental factors, water storage and hound healing). What is special about the outer bark of Quercus suber is the fact that the phellogen is continuous around the tree circumference and lives as long as the tree (Fig. 4). However when the cork is removed from the cork oak a traumatic phellogen is formed with the purpose of producing a new protective cork layer and this process is repeated through the life cycle of the cork oak (Pereira, 2007).
5
2.2.2 Chemical composition
Cork, as well as wood and phloem are chemically constituted by structural components and non-structural components. The structural components are macromolecules of polymeric nature that make up the cell wall and bestow most part of the physical and chemical properties of the tissues. In cork they are, by order of importance, suberin, lignin and polysaccharides (cellulose and hemicelluloses). Phloem and xylem do not contain suberin and are constituted by polysaccharides and lignin. The non-structural components are inorganic minerals (determined as ash) and low mass molecules, named extractives, that can be removed with solvents without compromising the cell structure. The mean chemical composition of virgin cork, phloem and xylem of Quercus suber is presented in table 1.
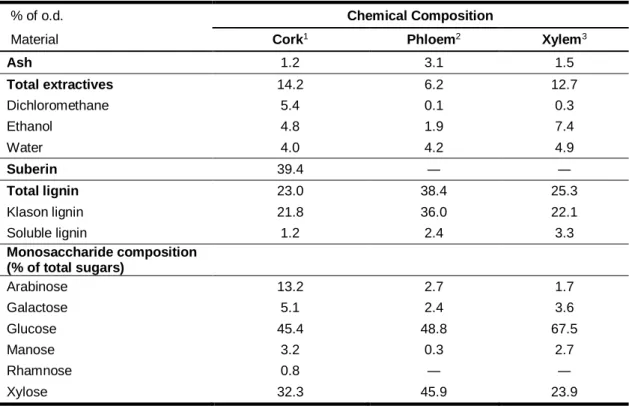
Table 1. Chemical composition of virgin cork, phloem and xylem from the cork oak.
(Adapted from: 1 - (Pereira, 1988) ; 2 - (Lourenço, et al., 2016); 3 – (Leal, et al., 2005)
Inorganic components
The inorganic components contain a wide range of elements e.g. in wood, 80 % of these elements corresponds to calcium, magnesium and potassium (Rowel, 2005).
The inorganic fraction is quantified after total incineration at 525 ºC (determined as ash). Usually barks have more ash content than wood, but in the case of the cork oak the opposite happens. The ash content of cork, phloem and xylem from Q. suber is, respectively, 1.2 %, 3.1 % and 1.5 % (Pereira, 1988; Leal, et al., 2005; Lourenço, et al., 2016).
% of o.d. Chemical Composition
Material Cork1 Phloem2 Xylem3
Ash 1.2 3.1 1.5 Total extractives 14.2 6.2 12.7 Dichloromethane 5.4 0.1 0.3 Ethanol 4.8 1.9 7.4 Water 4.0 4.2 4.9 Suberin 39.4 ― ― Total lignin 23.0 38.4 25.3 Klason lignin 21.8 36.0 22.1 Soluble lignin 1.2 2.4 3.3 Monosaccharide composition (% of total sugars) Arabinose 13.2 2.7 1.7 Galactose 5.1 2.4 3.6 Glucose 45.4 48.8 67.5 Manose 3.2 0.3 2.7 Rhamnose 0.8 ― ― Xylose 32.3 45.9 23.9
6
Extractives
Extractives are low weight molecules and are formed as a result of secondary metabolism of the cells (Pereira et al., 2003). They include a wide range and variety of molecules and are usually classified by the type of solvent e.g. polarity by which they are removed, or by chemical families. In the first they are classified in two groups: i) lipophilic compounds that are extracted by solvents with low-polarity, such as dichloromethane or chloroform; ii) polar compounds including phenolic compounds and sugars extracted by polar solvents such as ethanol and water (Pereira, 2007). Barks have a higher content of extractives than wood: for example, in softwood trees wood extractives range 2.0 – 9.0 % and barks extractives 2.0 – 25.0 %, and in hardwood trees wood has 2 - 5 % of extractives and barks 5 – 10 % (Harkin & Rowe, 1971). Cork from Q. suber has an extractives content that can go from 8 % to 24 %, with mean values ranging 14 – 18 %, and they are rich in both lipophilic and phenolic compounds (Pereira, 2007). Lipophilic compounds include triterpenes, fatty acids, n-alkanes and n-alkanols (Castola, et al., 2005; Sousa et al., 2006). Phenolic compounds are composed mainly by phenols and flavonoids.
Phloem and xylem of Q. suber have less extractives than cork and are mainly composed by compounds soluble in polar solvents. Leal et al. (2005) reported 12.7 % of extractives in xylem, where 12.4 % corresponded to compounds soluble in ethanol and water; Lourenço et al. (2016) reported 6.2 % total extractives in the phloem of the cork oak, where 6.1 % corresponded to polar compounds.
Suberin
Suberin is the typical component of cork and therefore of barks of trees (Jansson & Nilvebrant, 2009) and depending on the species can vary from 2 – 45 % of its chemical composition (Pereira, 2012b). It is the major constituent of cork, accounting approximately to 40 % of the chemical composition, although it can vary from tree to tree (Pereira, 2013). Suberin is composed by two major type of monomers, glycerol and long chain fatty acids and alcohols; it includes also small amounts of ferulic acid (figure 5). The long chain fatty acids are composed mainly by α,ω-dicarboxylic acids, ω-hydroxyacids and unsubstituted fatty acids, and the long chain alcohols mainly by 1-alkanols (Graça & Santos, 2006).
In virgin cork, ω-hydroxyacids are the most abundant monomers (47.0 %) followed by α,ω-diacids (11.7 %), while in reproduction cork the last ones account to 53.0% and the ω-hydroxyacids to 30.6 % (Leite & Pereira, 2017).
7 Figure 5. Common structures of suberin monomers obtained after cork depolymerasation followed by GC-MS separation and identification. (a) Unsubstituted fatty acids (C18 to C24 saturated). (b) ω-hydroxy fatty acids (C16 to C26 saturated or C18 with one insaturation). (c) α,ω-dicarboxylic acids (C16 to C26 saturated or C18 with one or two insaturations. (d) 1-alkanols (C18 to C22 saturated). (e) Mid-chain functionalized monomers; (e1) Epoxy-fatty acids (C18 saturated or with one insaturation); (e2) Polyhydroxy-Epoxy-fatty acids (C18 saturated); (e3) Polyhydroxy α,ω-dicarboxylic acids (C18 saturated). (f) Glycerol. (g) Ferulic acid. Adapted from (Pollard, et al., 2008).
Polysaccharides
Polysaccharides are the most abundant structural component in wood, and are formed of cellulose and hemicelluloses. Together they are known as holocellulose, accounting to 65 – 70 % in wood, with 40 – 45 % attributed to cellulose and 15 – 25 % to hemicelluloses (Rowel, 2005). In cork, polysaccharides are the least important structural component of the cell wall, representing in average 20% of its chemical composition (Pereira, 1988).
Cellulose is composed by β-D-glucopyranose units linked by β-(1→4) glycosidic bonds and the degree of polymerization in wood (number of glucose units in a molecule of cellulose), is usually around 9 000 – 10 000 units of β-D-glucopyranose but in cotton can go up to 15 000 units. The two repeating D-glucose units in cellulose is known as cellobiose (Figure 6) (Rowel, 2005; Ek et al., 2009).
Figure 6. Partial structure of cellulose, and cellobiose highlighted. Adapted from (Sjöström & Alén, 2013) (a)
(c) (d)
(e1) (e2)
(e3) (f) (g)
8
In consequence of the linearity and high tendency to form intramolecular and intermolecular hydrogen bonding, cellulose molecules aggregate into microfibrils forming crystalline regions (highly ordered conformation) and amorphous regions (less ordered); microfibrils aggregate into fibrils and then into cellulose fibers. This structural arrangement of cellulose confers wood important mechanical properties (e.g. high tensile strength) (Sjöström & Alén, 2013). In cork, cellulose plays a minor role in its properties, and the role conferred by cellulose to wood properties, is given in cork by suberin (Pereira, 2007).
Hemicelluloses, contrary to cellulose which is a homopolysaccharide (formed only by glucose), are heteropolysaccharides (e.g. glucuronoxylans, glucomannans, galactoglucomannans, arabinoglucuronoxylans) formed by monomeric components of glucose, mannose, galactose, xylose, arabinose, rhamnose with the presence of glucuronic and galacturonic acids and with a degree of polymerization between 50 and 200 (Sjöström, 1993). The role of hemicelluloses is to strengthen the cell walls by bonding with the cellulose microfibrils (Wertz, et al., 2018). The polysaccharide content in virgin cork ranges from 15.7 % to 21.3 %, and in reproduction cork is 19.9 %, with the monosaccharide composition being dominated by glucose, xylose and arabinose (Pereira, 1988). Lourenço et al., (2016), reported values of total polysaccharides in phloem and xylem of 33.8 % and 44.7 %, respectively, with glucose and xylose as the main monosaccharides in both tissues. The monosaccharide composition of cork is dominated by glucose and xylose, and with a considerable amount of arabinose (45.4 %, 32.3 % and 13.2 % of total polysaccharides, respectively (Pereira, 1988)); and phloem and xylem by glucose and xylose (48.8 % and 45.9 % in phloem, and 67.5 % and 23.9 % in xylem, respectively (Leal, et al., 2005; Lourenço, et al., 2016).
Lignin
Lignin is the second most important structural component in wood and in cork of Q. suber. The mean lignin content reported in cork, phloem and xylem of the cork oak is 23.0 %, 38.4 % and 25.3 %, respectively (Pereira, 1988; Leal, et al., 2005; Lourenço, et al., 2016).
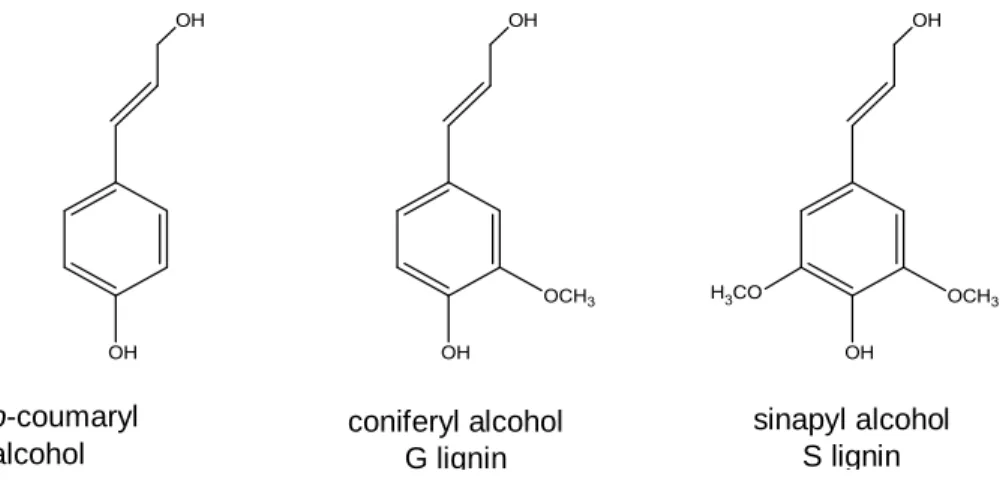
Lignin is a polyphenolic polymer mainly constituted by three monomers, p-coumaryl alcohol, coniferyl alcohol and sinapyl alcohol that are distinguished by the lack or presence of one or two methoxyl groups (Figure 7). In wood, lignin is distributed in the secondary wall, mainly in the middle lamella and its function is to serve as the “glue” that binds the cells and microfibrils. It confers rigidity, strength, hydrophobicity and defense against pathogens in both wood and cork cells (Pereira, 2007; Wertz, et al., 2018). In addition to the three precursors, recent studies have shown that the polymerization of lignin may include other precursors e.g. hydroxycinnamates (Lourenço & Pereira, 2018).
9 Figure 7. Basic monomers that make up lignin structure.
The lignin can be distinguished in wood and barks by the proportion of the three monomers. Lignin composition also varies with species; for example, lignin in softwoods is mainly composed by G units with a low amount of H units, and in hardwoods it is mainly composed by G and S units (some species of trees with an equal amount of this monomers and others species that can go up to percentages of S units, three times higher that G units) and with minor percentage of H units (Ek, et al., 2009).
The mean percentage of lignin reported in cork, phloem and xylem of the cork oak is 23.0 %, 38.4 % and 25.3 %, respectively (Pereira, 1988; Leal, et al., 2005; Lourenço, et al., 2016). Lignin from cork is characterized by a G type lignin, with a H:G:S molar composition of 2:85:13, while lignin from phloem as less G units, and from xylem is enriched in S units (H:G:S of 1:58:41 and 1:45:55, respectively) (Lourenço, et al., 2016).
2.3 Quercus suber chemical variability
The chemical composition variation between provenances of cork from Q. suber has been only researched by i) Conde et al. (1998a) that studied the variability of chemical composition of cork from seven provenances and found no significant differences that could allow to distinguish provenances of Q. suber by its chemical composition, only between trees from the same provenance; ii) by Conde et al. (1998b), that studied the polyphenolic extractives of cork from seven provenances with no significantly differences in relation to site in the content of total tannins and ellagitannins, and report differences between the content of some individual compound that could discriminate provenances (i.e. gallic acid, caffeic acid and protocatechuic aldehyde); and iii) by Pereira (2013), that studied the chemical variability of cork between 29 provenances from six cork production regions where no significant differences in relation to provenances and regions, and only in relation between individual trees.
p-coumaryl alcohol H lignin coniferyl alcohol G lignin sinapyl alcohol S lignin
10
Other studies relating the chemical composition of cork from Q. suber from different sites and locations have been made. Bento et al. (2001) studied the suberin composition in cork of trees from five different sites and found no differences between them, only between trees. Pereira (1998) studied the chemical composition of virgin cork from four different sites and concluded that there were only significantly differences in the content of extractives and polysaccharides in relation to location, but there was a large variability between trees from the same location and even within-tree. Jové et al. (2011) studied the variability in chemical composition of bark layers of cork from six locations and concluded that there were significant differences in suberin and holocellulose contents with respect to the bark layers but no significantly differences were found between the different production areas.
There are no studies in relation to the chemical composition differences between provenances of phloem or xylem from Quercus suber.
11
3. Material and methods
3.1 Sampling
This study was performed with Quercus suber L. samples from a provenance trial located on Herdade do Monte da Fava (in Santiago do Cacém), Southern Portugal. Monte da Fava is characterized by a Mediterranean climate, located at an altitude of 79 m and with a sandy soil texture. The mean annual temperature and precipitation are 16.2 ºC and 577 mm, respectively (Sampaio, et al., 2016).
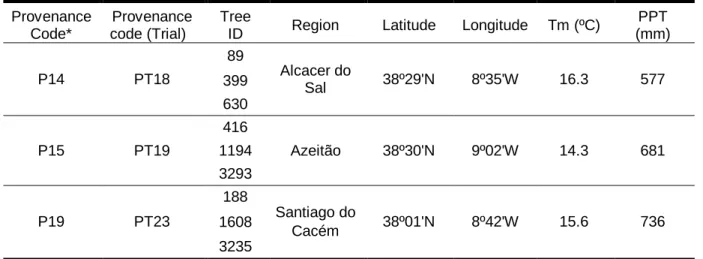
The trial was established in March 1998 as part of an European Cork Oak Network, and the trees in this trial originated from seeds collected in 35 cork oak provenances from countries of Europe and North Africa, representing the cork oak natural distribution. Table 2 presents the details of the location of the selected provenances and the trees used in this study: the code of provenances and the corresponding code used in the trial, the identification of the trees (ID), the region of seed collection, geographical variables and climate data for the seed source (Sampaio, et al., 2016).
Table 2. Details of the Quercus suber L. provenances used in this study.
Provenance Code*
Provenance code (Trial)
Tree
ID Region Latitude Longitude Tm (ºC)
PPT (mm) P14 PT18 89 Alcacer do Sal 38º29'N 8º35'W 16.3 577 399 630 P15 PT19 416 Azeitão 38º30'N 9º02'W 14.3 681 1194 3293 P19 PT23 188 Santiago do Cacém 38º01'N 8º42'W 15.6 736 1608 3235
*Code of the provenances attributed in this study; Tm – mean temperature; PPT – precipitation.
Quercus suber L. trees with 6 years of age were used in this study. The samples were taken
from discs collected between 1.0 and 1.3 m of the stem height. The cork, phloem and xylem tissues were manually separated using a chisel and a hammer. The cork and xylem tissues were milled in two cutting mills, passing through a 6 x 6 mm sieve in a Retsch SM 2000, and then through a 1 x 1 mm sieve in a Thomas Willey lab mill. The phloem was directly milled in the Thomas Willey Lab Mill, passing through the 1 x 1 mm sieve. All the tissues were sieved
12
in a Retsch AS 200, and samples from the >20-80 mesh fractions (180 μm – 850 μm) were taken for chemical analysis. All the analyses were made in duplicate and average results reported as percentage of initial mass.
3.2 Chemical analysis
3.2.1 Ash determination
Ash content was determined by TAPPI standard method T15 os-58. An amount of 2 g of each tissue was incinerated for no less than 6 h at 525 ºC, and the residue after incineration weighed as ash. The formula applied for the content of ashes is as follows, where o.d. material stands for oven-dried material.
𝐴𝑠ℎ𝑒𝑠 (%) = 𝑅𝑒𝑠𝑖𝑑𝑢𝑒
𝑜.𝑑.𝑚𝑎𝑡𝑒𝑟𝑖𝑎𝑙∗ 100
3.2.2 Extractives determination
The extractives are low weight molecules that are not part of the cell-wall structure and can be removed with solvents. The most used solvents are dichloromethane, ethanol and water. The first solvent is used to remove mainly substances such as resins, fats and waxes; the second to remove phenolic substances; and the last to remove carbohydrates. The samples were submitted to a successive soxhlet extraction using dichloromethane (6 h), ethanol (16 h) and water (16 h), (TAPPI standard method T211 om-02), in extraction thimbles. After the extractions samples were oven-dried at 100 ºC, weighed and the extractive content determined gravimetrically:
𝐸𝑥𝑡𝑟𝑎𝑐𝑡𝑖𝑣𝑒𝑠 (%) = 𝐸𝑥𝑡𝑟𝑎𝑐𝑡𝑒𝑑 𝑅𝑒𝑠𝑖𝑑𝑢𝑒𝑜.𝑑.𝑚𝑎𝑡𝑒𝑟𝑖𝑎𝑙 ∗ 100
3.2.3 Cork methanolysis
The cork was depolymerized by alkaline methanolysis. Extractive-free cork samples of 1.5 g were refluxed in a 100 ml solution of sodium methoxide (50mM)
during 3 h and filtrated in a G3 crucible. The residue was refluxed again during 15 m in 100 ml of methanol (CH3OH), and, after filtration, the combined filtrates were acidified to pH 6 with 2M sulfuric acid (H2SO4) in methanol and evaporated to dryness in a rotary evaporator. This residue was suspended in 50 ml of water and extracted 3 times with 50 ml of dichloromethane (CH2Cl2). The extract was dried with anhydrous sodium sulfite (Na2SO3), filtrated and
13 evaporated to dryness. The residue, which corresponds to the long chain fatty components of suberin was oven-dried at 100 ºC, weighed, and the suberin content calculated as:
𝑆𝑢𝑏𝑒𝑟𝑖𝑛 (%) = 𝑅𝑒𝑠𝑖𝑑𝑢𝑒
𝑜.𝑑.𝑒𝑥𝑡𝑟𝑎𝑐𝑡𝑒𝑑 𝑚𝑎𝑡𝑒𝑟𝑖𝑎𝑙∗ (100 − 𝐸𝑥𝑡𝑟𝑎𝑐𝑡𝑖𝑣𝑒𝑠)
The solid residue after the methanolysis was called corkdes (the cork without suberin).
3.2.4 Klason and soluble lignin determination
The Klason lignin from the extractive-free phloem and xylem, and from the cork residue after methanolysis was determined by TAPPI standard method T222 om-88. This method consists in hydrolyzing and solubilizing the polysaccharides with 72 % sulfuric acid, and the residue after the hydrolysis corresponding to the Klason lignin, was oven dried and weighed (formula A was applied for cork, and B for phloem and xylem). The soluble lignin was determined by TAPPI method UM 250, by measuring the absorbance of ultraviolet radiation at a wavelength of 205 nm, in a Shimadzu A160 spectrophotometer, of the filtrate obtained after the hydrolysis for the Klason lignin determination. The formula used for soluble lignin was formula C (in the cork tissue) and D (in phloem and xylem tissues), where A205 is the absorbance at 205 nm, Vi the initial volume, f is the dilution factor (10), ε is the absorptivity (110 cm/g), and m is the mass of oven dried material of cork, phloem and xylem used in the Klason method.
A. 𝐾𝑙𝑎𝑠𝑜𝑛 𝑙𝑖𝑔𝑛𝑖𝑛 (%) = 𝑜.𝑑.𝑒𝑥𝑡𝑟𝑎𝑐𝑡𝑒𝑑 𝑚𝑎𝑡𝑒𝑟𝑖𝑎𝑙 𝑅𝑒𝑠𝑖𝑑𝑢𝑒 ∗ (100 − 𝐸𝑥𝑡𝑟𝑎𝑐𝑡𝑖𝑣𝑒𝑠 − 𝑆𝑢𝑏𝑒𝑟𝑖𝑛) B. 𝐾𝑙𝑎𝑠𝑜𝑛 𝑙𝑖𝑔𝑛𝑖𝑛 (%) = 𝑅𝑒𝑠𝑖𝑑𝑢𝑒 𝑜.𝑑.𝑒𝑥𝑡𝑟𝑎𝑐𝑡𝑒𝑑 𝑚𝑎𝑡𝑒𝑟𝑖𝑎𝑙∗ (100 − 𝐸𝑥𝑡𝑟𝑎𝑐𝑡𝑖𝑣𝑒𝑠) C. 𝑆𝑜𝑙𝑢𝑏𝑙𝑒 𝑙𝑖𝑔𝑛𝑖𝑛 (%) = 𝐴205∗𝑉𝑖∗𝑓 ℰ∗𝑚 ∗ (100 − 𝐸𝑥𝑡𝑟𝑎𝑐𝑡𝑖𝑣𝑒𝑠 − 𝑆𝑢𝑏𝑒𝑟𝑖𝑛) D. 𝑆𝑜𝑙𝑢𝑏𝑙𝑒 𝑙𝑖𝑔𝑛𝑖𝑛 (%) = 𝐴205∗𝑉𝑖∗𝑓ℰ∗𝑚 ∗ (100 − 𝐸𝑥𝑡𝑟𝑎𝑐𝑡𝑖𝑣𝑒𝑠)
3.2.5 Neutral monosaccharides, acetate and uronic acids determination
The polysaccharides composition was determined as neutral monosaccharides, acetate and uronic acids in the hydrolysate from the Klason lignin. The monosaccharides and the uronic acids were separated by High Pressure Ion-exchange Chromatography using a Dionex ICS3000 equipped with a PAD detector; the column used was Thermo Carbopac PA10 (250 x 4 mm) + Aminotrap and the mobile phase was NaOH + CH3COONa with a flow of 1 ml/min at 30 ºC. The acetic acid content was separated by High Pressure Ion-exclusion Chromatography using a Thermo Finnigan Surveyor and measured at a wavelength of 210 nm by a UV/Vis
14
detector; a Biorad Aminex 87H (300 x 7.8 mm) column was used and the eluent was H2SO4 (10 mN) with a flow of 0.6 ml/min at 30 ºC.
3.3 Statistical analysis
The statistical analysis was made in StatSoft Statistica 10 Enterprise and differences between provenances 14, 15 and 19 were tested with one-way ANOVA, pairwise analysis (Tukey test, p<0.05).
3.4 Analytical pyrolysis (PY-GC/MS)
The extractive-free samples of cork, phloem and xylem, and the corkdes sample were milled to a fine powder on a Retsch MM200 mixer mill, and dried under vacuum over phosphorus pentoxide. The samples were then weighed (approximately 100 µg) and pyrolysed at 650 ºC for 10 s in a CDS Pyroprobe 5150 Pyrolyzer connected to an Agilent GC 7890B coupled to a mass detector system 5977B, and using a fused-silica capillary column ZB-1701 (60 m x 0.25 mm i.d. x 0.25 µm film thickness), and helium as carrier gas (total flow of 1 mL/min). The oven heating program started at 40 ºC (held for 4 min), increased to 70 ºC at a rate of 10 ºC/min, then to 100 ºC at 5 ºC/min, next to 265 ºC at 3 ºC/min (held for 3 min), and last to 270 ºC at 5 ºC/min (held for 9 min). The temperature of the injector and the GC/MS interface were kept at 270 ºC and 280 ºC, respectively.
The compounds were identified using the Wiley/NIST libraries, and literature (Faix, et al,, 1990; Ralph & Hatfield, 1991).
3.5 Color measurements
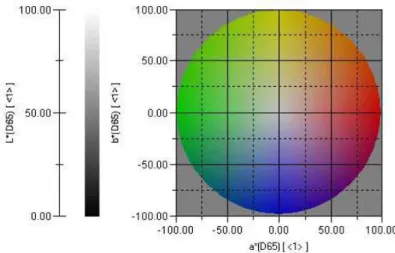
The samples of cork, phloem and xylem were subjected to optical measurements before the extractions and between each extraction with dichloromethane, ethanol and water, with a, in order to evaluate a possible relation between color and the removal of extractives. The tissues were characterized by color parameters of the CIE L*a*b* scale (CIELAB), measured in a spectrophotometer Minolta CM-3630. The L* represents lightness, varying between 0 (black) and 100 (white); a* and b* parameters varies between -100 and 100, varying from green (negative values) and red (positive values) in parameter a*, and from blue (negative values) and yellow (positive values) in parameter b* (Figure 8).
15 Figure 8. CIE L*a*b* color scale.
16
4. Results
4.1 Chemical composition
The summative chemical composition of cork from the three provenances is presented in Table 3 as provenance means and mean values of the nine trees studied (% of the original material). The standard deviation, in brackets, and the results of the pairwise analysis (Tukey test, p<0.05) are also included. The chemical composition of cork from the nine individual trees is presented in the annex section (Annex 1).
The mean values for the ash content in cork was quite similar between provenances (0.69 %, 0.63 % and 0.66 % for provenances 14, 15 and 19, respectively), with a small variation between the nine trees as can be seen by the low standard deviation values (Table 3).
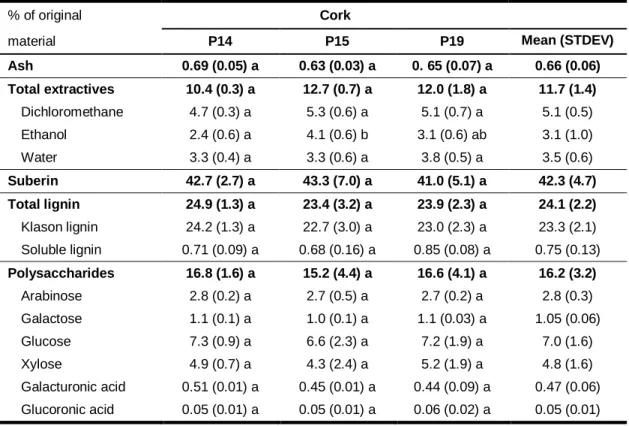
Table 3. Chemical composition of cork samples from the three cork oak provenances (% of oven-dried material). Mean values, standard deviation and pairwise Tukey test.
% of original Cork
material P14 P15 P19 Mean (STDEV)
Ash 0.69 (0.05) a 0.63 (0.03) a 0. 65 (0.07) a 0.66 (0.06) Total extractives 10.4 (0.3) a 12.7 (0.7) a 12.0 (1.8) a 11.7 (1.4) Dichloromethane 4.7 (0.3) a 5.3 (0.6) a 5.1 (0.7) a 5.1 (0.5) Ethanol 2.4 (0.6) a 4.1 (0.6) b 3.1 (0.6) ab 3.1 (1.0) Water 3.3 (0.4) a 3.3 (0.6) a 3.8 (0.5) a 3.5 (0.6) Suberin 42.7 (2.7) a 43.3 (7.0) a 41.0 (5.1) a 42.3 (4.7) Total lignin 24.9 (1.3) a 23.4 (3.2) a 23.9 (2.3) a 24.1 (2.2) Klason lignin 24.2 (1.3) a 22.7 (3.0) a 23.0 (2.3) a 23.3 (2.1) Soluble lignin 0.71 (0.09) a 0.68 (0.16) a 0.85 (0.08) a 0.75 (0.13) Polysaccharides 16.8 (1.6) a 15.2 (4.4) a 16.6 (4.1) a 16.2 (3.2) Arabinose 2.8 (0.2) a 2.7 (0.5) a 2.7 (0.2) a 2.8 (0.3) Galactose 1.1 (0.1) a 1.0 (0.1) a 1.1 (0.03) a 1.05 (0.06) Glucose 7.3 (0.9) a 6.6 (2.3) a 7.2 (1.9) a 7.0 (1.6) Xylose 4.9 (0.7) a 4.3 (2.4) a 5.2 (1.9) a 4.8 (1.6) Galacturonic acid 0.51 (0.01) a 0.45 (0.01) a 0.44 (0.09) a 0.47 (0.06) Glucoronic acid 0.05 (0.01) a 0.05 (0.01) a 0.06 (0.02) a 0.05 (0.01)
The same letter in a row means that no significantly differences were found between provenances. .
Cork has a high content of total extractives (Table 3) with values of 10.4 %, 12.7 % and 12.0 % for provenances 14, 15 and 19 respectively. Total extractives ranged from 10.1 % in Tree 630 (provenance 14) to 13.3 % in Tree 1608 (provenance 19, Annex 1). In Table 4 is presented the percentage of total extractives by solvent, and it can be seen that compounds soluble in dichloromethane correspond to almost 50 % of total extractives (average of 43.6 % in the nine
17 trees), with the polar compounds representing 26.2 % and 30.2 % in ethanol and water extracts respectively. Note that, ethanol extractives are higher than water extractives for two trees (Trees 1194 and 3293), in opposite to what happens in the other trees (Annex 1).
Table 4. Proportion of the extractives solubilized by dichloromethane, ethanol and water, as % of total extractives in the cork tissue.
% of total extractives Cork P14 P15 P19 Mean Dichloromethane 46.3 (3.0) 42.0 (2.6) 42.5 (5.2) 43.6 (3.1) Ethanol 20.7 (5.8) 32.2 (10.3) 25.7 (9.9) 26.2 (6.1) Water 33.0 (3.4) 25.8 (8.5) 31.8 (7.9) 30.2 (4.9)
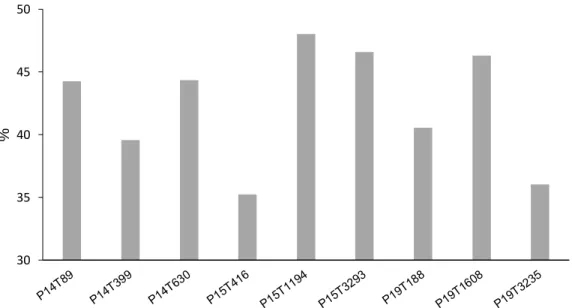
Suberin is exclusive to the cork tissue, and its mean content was 42.7 %, 43.3 % and 41.0 %, respectively in provenances 14, 15 and 19 (Table 3), but with a large variation among the nine trees, ranging from 35.2 % (P15, tree T416) to 48.0 % (P15, tree T1194), as it can be seen in Figure 9. After suberin, lignin was the second highest component in cork, accounting to 24.1 %, 23.4 % and 23.9 % in provenances 14, 15 and 19 respectively. Klason lignin ranged from 22.7 % (P15) to 24.2 % (P14), and the soluble lignin represented less than 1 % (Table 3).
Figure 9. Suberin content of cork from the nine trees studied (% o.d. material).
Total polysaccharides in cork accounted to 16.7 %, 15.2% and 16.6 % P14, P15 and P19 respectively (Table 3) with a mean value of 16.2 %. Table 5 shows the carbohydrate
30 35 40 45 50 %
18
composition as the monosaccharides and the uronic acids proportion in relation to total polysaccharides distributed by provenances. Glucose, xylose and arabinose were the principal monosaccharides of cork polysaccharides, representing 43.3 %, 29.0 % and 17.7 % in the nine trees studied. Galactose, galacturonic and glucuronic acids make up the remaining polysaccharides, accounting to 6.7 %, 3.0 % and 0.34 % of the total. Although the values of total polysaccharides in cork varied in the nine trees studied, the proportion of each monosaccharide was very similar in all the trees (Table 5). For example, the main monosaccharides glucose and xylose varied from 42.9 % to 43.7 %, and 27.1 % to 30.5 %, respectively. The same behavior was found for arabinose (17.0 % to 19.0 %), galactose (6.4 % to 7.0 %), and for galacturonic (2.7 % to 3.1 %) and glucuronic acid (0.33 % to 0.36 %). A statistical analysis using all the values for the cork chemical characterization showed that the only significant differences were for the ethanol extractives between provenances 14 and 15.
Table 5. Composition of monosaccharides, uronic and acetic acids in the cork tissue of the three cork oak provenances(% of total monosaccharides).
% of total Cork monosaccharides P14 P15 P19 Mean Arabinose 17.1 (2.1) 19.0 (6.9) 17.0 (3.0) 17.7 (4.0) Galactose 6.4 (1.0) 7.0 (1.8) 6.5 (1.3) 6.7 (1.3) Glucose 43.7 (1.6) 43.4 (2.6) 42.9 (0.8) 43.3 (1.6) Xylose 29.3 (1.8) 27.1 (7.0) 30.5 (3.5) 29.0 (4.3) Galacturonic acid 3.1 (0.3) 3.1 (0.7) 2.7 (0.2) 3.0 (0.5) Glucuronic acid 0.33 (0.03) 0.33 (0.05) 0.36 (0.05) 0.34 (0.04)
19 The mean summative chemical composition and the standard deviation of phloem from the three provenances, and the mean value of the nine trees is presented in Table 6. The results of the pairwise analysis (Tukey test, p<0.05) are also included. The chemical composition of phloem for the nine trees studied is presented in the annex section (Annex 2).
Table 6. Chemical composition of phloem samples from the three cork oak provenances (% of oven-dried material). Mean, standard deviation, and pairwise Tukey test.
% of original Phloem
material P14 P15 P19 Mean (STDEV) Ash 3.1 (0.7) a 2.7 (1.1) a 2.8 (0.3) a 2.9 (0.7) Total extractives 3.9 (0.5) a 4.8 (1.4) a 5.0 (0.8) a 4.5 (1.0) Dichloromethane 0.14 (0.03) a 0.17 (0.06) a 0.18 (0.04) a 0.17 (0.04) Ethanol 1.5 (0.4) a 1.6 (0.3) a 1.4 (0.3) a 1.5 (0.3) Water 2.3 (0.2) a 2.8 (1.7) a 3.4 (1.1) a 2.8 (1.1) Total lignin 38.4 (1.2) a 37.8 (3.1) a 37.9 (1.1) a 38.0 (1.8) Klason lignin 35.9 (1.2) a 35.4 (3.3) a 35.5 (0.8) a 35.6 (1.8) Soluble lignin 2.5 (0.04) a 2.4 (0.2) a 2.4 (0.3) a 2.5 (0.2) Polysaccharides 48.5 (1.2) ab 51.6 (2.1) a 47.3 (1.1) b 49.1 (2.3) Arabinose 1.1 (0.1) a 1.4 (0.3) a 1.1 (0.2) a 1.2 (0.2) Galactose 0.9 (0.03) a 1.2 (0.3) a 0.8 (0.1) a 0.97 (0.23) Glucose 21.2 (2.1) a 22.6 (2.9) a 20.3 (2.0) a 21.4 (2.3) Xylose 18.7 (0.3) a 19.2 (1.0) a 19.4 (0.9) a 19.1 (0.8) Galacturonic acid 1.0 (0.3) a 1.3 (0.4) a 0.84 (0.2) a 1.1 (0.3) Glucoronic acid 0.16 (0.2) a 0.25 (0.2) a 0.07 (0.01) a 0.16 (0.14) Acetic acid 5.4 (0.5) a 5.6 (0.8) a 4.8 (0.7) a 5.3 (0.7)
The same letter in a row means that no significantly differences were found between provenances.
Ash content in phloem accounted to 3.1 %, 2.7 % and 2.8 % in provenance 14, 15 and 19 respectively, ranging from 1.8 % (Tree 416) to 4.0 % (Tree 1194, Annex 2). The content of total extractives in phloem was 3.9 %, 4.8 % and 5.0 % in provenances 14, 15 and 19 respectively, with a mean value of 4.5 %. As it can be seen from Table 7, in phloem the dichloromethane extracts represented a minor fraction of total extractives (mean of 3.7 % in the three provenances), while the polar compounds were the major part representing 96.3% of total extractives, with ethanol extracts accounting for 33.4% (28.3 % - 37.7 %) and the water extracts for 62.9 % (58.6 % - 68.1 %).
Total lignin in phloem accounted to 38.4 %, 37.8 % and 37.9 % in provenances 14, 15 and 19 respectively. For all the trees, total lignin ranged from 34.4 % (Tree 1194) to 40.1 % (Tree 3293, Annex 2), Klason lignin ranged from 31.8 % (Tree 1194) to 37.9 % (Tree 3293) and soluble lignin from 2.1 % (Tree 188) to 2.7 % (Tree 1608).
20
Table 7. Proportion of the extractives solubilized by dichloromethane, ethanol and water (% of total extractives) in the phloem samples of the three cork oak provenances.
% of total Phloem
extractives P14 P15 P19 Mean Dichloromethane 3.7 (1.1) 3.8 (1.2) 3.6 (1.6) 3.7 (1.0) Ethanol 37.7 (5.9) 34.3 (1.3) 28.3 (6.8) 33.4 (12.8) Water 58.6 (5.5) 61.9 (0.4) 68.1 (8.5) 62.9 (13.3)
In Table 8 is presented the proportion of monosaccharides, uronic and acetic acids, in relation to total polysaccharides from the phloem tissue. Polysaccharides represented 48.5 % (P14), 51.6 % (P15) and 47.3 % (P19), with a low standard deviation (1.2, 2.1 and 1.1 respectively), and ranging from 46.4 % (Tree 3235) to 53.9 % (Tree 1194, Annex 2). Glucose and xylose were the major monosaccharides, accounting respectively to 21.2 % and 18.7 % (P14), 22.6 % and 19.2 % (P15) and 20.3 % and 19.4 % (P19) of the oven dried material, and both monosaccharides represented more than 80 % of the total sugars in phloem (Table 8). Acetic acid accounted to 4.8 % (P19) to 5.4 % (P14) of oven dried material, while arabinose, galacturonic and glucuronic acids made up the remaining monosaccharides, accounting to less than 6 % (Table 6). In phloem there were statistically significant differences only in the total polysaccharides content between provenances 15 and 19.
Table 8. Composition of monosaccharides, uronic and acetic acids in the phloem tissue (% of total monosaccharides) of the three cork oak provenances
% of total Phloem monosaccharides P14 P15 P19 Mean Arabinose 2.3 (0.2) 2.6 (0.6) 2.3 (0.5) 2.4 (0.4) Galactose 1.8 (0.01) 2.3 (0.5) 1.7 (0.2) 2.0 (0.4) Glucose 43.7 (3.3) 43.8 (4.4) 42.8 (3.3) 43.4 (3.2) Xylose 38.5 (1.5) 37.5 (3.1) 41.0 (2.8) 39.0 (2.7) Galacturonic acid 2.1 (0.6) 2.5 (0.7) 1.8 (0.2) 2.1 (0.6) Glucuronic acid 0.33 (0.33) 0.49 (0.31) 0.14 (0.03) 0.32 (0.27) Acetic acid 11.2 (1.3) 10.8 (1.8) 10.2 (1.4) 10.7 (1.4)
21 The summative analysis of the xylem samples from the three provenances is presented in Table 9, also including the pairwise analysis (Tukey test, p<0.05). The detailed results of the chemical composition of xylem for the nine trees studied is presented in the annex section (Annex 3).
The xylem samples presented an ash content of 1.1 % (P14), 1.2 % (P15) and 1.1 % (P19), therefore with a small variability between provenances as seen by the low values of standard deviation (0.2, 0.1 and 0.1, respectively).
Table 9. Chemical composition of xylem samples from the three cork oak provenances (% of oven-dried material). Mean, standard deviation values and pairwise Tukey test.
% of original Xylem
material P14 P15 P19 Mean (STDEV) Ash 1.1 (0.2) a 1.2 (0.1) a 1.1 (0.1) a 1.1 (0.1) Total extractives 4.9 (0.8) a 5.7 (0.2) a 5.9 (0.7) a 5.6 (0.7) Dichloromethane 0.29 (0.06) a 0.31 (0.04) a 0.37 (0.05) a 0.32 (0.06) Ethanol 1.2 (0.5) a 1.9 (0.1) a 1.5 (0.6) a 1.6 (0.5) Water 3.4 (1.2) a 3.5 (0.3) a 4.0 (0.7) a 3.7 (0.8) Total lignin 22.6 (0.5) a 24.4 (1.4) a 23.0 (1.0) a 23.4 (1.2) Klason lignin 19.7 (0.7) a 21.6 (1.5) a 20.4 (0.7) a 20.6 (1.3) Soluble lignin 2.9 (0.3) a 2.8 (0.2) a 2.6 (0.4) a 2.8 (0.3) Polysaccharides 66.9 (1.7) a 64.7 (5.1) a 62.0 (2.3) a 64.6 (3.6) Arabinose 1.0 (0.1) a 0.9 (0.2) a 1.0 (0.08) a 1.0 (0.1) Galactose 1.6 (0.4) a 1.6 (0.5) a 1.4 (0.2) a 1.5 (0.4) Glucose 40.4 (1.7) a 37.5 (3.0) a 36.3 (0.9) a 38.1 (2.6) Xylose 17.1 (0.6) a 18.0 (0.6) a 18.4 (1.4) a 17.8 (1.0) Galacturonic acid 1.2 (0.1) a 1.2 (0.3) a 0.88 (0.07) a 1.1 (0.2) Glucoronic acid 0.24 (0.1) a 0.23 (0.1) a 0.06 (0.01) a 0.18 (0.13) Acetic acid 5.4 (0.5) a 5.3 (1.3) a 4.0 (0.8) a 4.9 (1.1) The same letter in a row means that no significantly differences were found between provenances.
Total extractives amounted to 4.9 % (P14), 5.7 % (P15) and 5.9 % (P19), with a total mean value of 5.6 %. The extracts were mainly from water (60.9 % to 69.3 %) followed by ethanol (24.9 % to 33.7 %); the compounds soluble in dichloromethane ranged from 5.4 % to 6.2 % (Table 10). Total lignin in xylem was 22.6 % (P14), 24.4 % (P15) and 23.0 % (P19), and ranged from 22.0 % (Tree 3235) to 25.8 % (Tree 3293, Annex 3)). The content of Klason lignin varied from 19.0 % (Tree 630) and 23.2 % (Tree 3293), while soluble lignin between 2.4 % (Tree 188) and 3.3 % (Tree 630).
22
Table 10. Proportion of the extractives solubilized by dichloromethane, ethanol and water (% of total extractives) in the xylem of the three cork oak provenances.
% of total extractives Xylem P14 P15 P19 Mean Dichloromethane 5.9 (1.9) 5.4 (1.3) 6.2 (0.9) 5.8 (1.2) Ethanol 24.9 (13.4) 33.7 (11.6) 25.8 (8.1) 28.1 (9.2) Water 69.3 (15.1) 60.9 (12.6) 67.9 (8.1) 66.0 (10.0)
The content of total polysaccharides in xylem was 66.9 %, 64.7 % and 62.0 % in provenances 14, 15 and 19 respectively, and ranged from 59.5 % (Tree 3235) and 70.3 % (Tree 1194, Annex 3). The monosaccharides composition was dominated by glucose and xylose, reaching almost 86.6 % of total monosaccharides, with arabinose, galactose and galacturonic, glucuronic and acetic acids making up 13.3 % of total monosaccharides (Table 11).
Table 11. Composition of monosaccharides, uronic and acetic acids in the xylem tissue (% of total monosaccharides) of the three cork oak provenances.
% of total Xylem monosaccharides P14 P15 P19 Mean Arabinose 1.5 (0.2) 1.4 (0.3) 1.7 (0.2) 1.5 (0.2) Galactose 2.4 0.6) 2.4 (0.7) 2.2 (0.3) 2.3 (0.5) Glucose 60.4 (1.1) 57.9 (0.5) 58.5 (2.1) 58.9 (1.6) Xylose 25.6 (1.5) 27.8 (1.5) 29.7 (1.3) 27.7 ((2.0) Galacturonic acid 1.7 0.2) 1.8 (0.3) 1.4 (0.1) 1.7 (0.3) Glucuronic acid 0.36 (0.21) 0.34 (0.20) 0.10 (0.02) 0.27 (0.19) Acetic acid 8.0 (0.7) 8.2 (1.7) 6.4 (1.1) 7.5 (1.4)
From the statistical point of view, there were no significant differences in the summative chemical composition of the xylem samples between the three studied provenances.
23
4.2 Pyrolysis
The pyrograms of cork, corkdes, phloem and xylem are presented in Figure 10. The beginning of the pyrograms is composed mainly by carbohydrates derived compounds (carbohydrates and suberin in the case of cork), and after 23 min the lignin derived compounds start to appear. The chromatograms of cork and corkdes are relatively different, especially for the fact that in corkdes there were no suberin related peaks. As for phloem and xylem, both chromatograms are nearly identical, with just some compounds that were found in phloem and not in xylem (peak 15, 1,3-dimethyl-benzene; peak 110, guaiacylacetone; peak 125, cis-coniferyl alcohol;
peak 132, trans-coniferyl alcohol; and peak 135, trans-sinapyl alcohol) and one compound that
was identified in xylem but not in phloem (peak 65, a compound similar to 5-(hydroxymethyl)dihydro-2(3H)-furanone). The list of the 147 identified compounds in each tissue (cork, corkdes, phloem and xylem) of the three provenances and their % (of total chromatographic area) is presented in the annex section (Annex 4).
5 10 15 20 25 30 35 40 45 50 55 60 65
Retention Time (min)
145 138 141 3 2 7 13 24 60 67 34 127+ 128 51 122 83 6 5 9 15 81 79 73 5 10 15 20 25 30 35 40 45 50 55 60 65
Retention Time (min) 8 1 5 6 19 + 20 22 + 23 32 48 + 49 68 9 54 + 55 53 90 83 97 100 108 4 A B
24
Figure 10. Py-GC/MC pyrograms of cork (A), desuberinized cork (B), phloem (C) and xylem (D) from Q. suber.
Tables 12 and 13 show the pyrolysis results presented as the sum of the main chemical families of cork, corkdes (Table 12), phloem and xylem (Table 13). The identified carbohydrates include pyran, furan, low molecular compounds and other type of carbohydrates compounds. The lignin compounds include syringyl (S), guaiacyl (G), p-hydroxyphenyl (H) lignin type of units and other compounds that can be from any of those three monomers. Suberin compounds belong only to cork, and were divided in fatty acids, alkanes, alkenes, alkadienes and in non-identified suberin compounds.
In cork, the mean values of total carbohydrates accounted to 25.6 %, total lignin to 12.6 % and total suberin to 33.0 %. In corkdes (after methanolysis) there were no suberin compounds identified, leading to an increase in total carbohydrates and total lignin, 37.1 % and 34.4 %, respectively (Table 12).
5 10 15 20 25 30 35 40 45 50 55 60 65
Retention Time (min)
108 76 3 7 14 1 56 8 122 32 124 22 + 23 19 + 20 43 98 100 82 + 83 131 5 10 15 20 25 30 35 40 45 50 55 60 65
Retention Time (min) 5 6 8 43 3237 76 82 + 83 124 98 122 14 1 19 + 20 22 + 23 108 100 133 C D
25 In carbohydrates, the low molecular compounds represented 10.8 % in cork and 21.5 % in corkdes. Annex 4 presents the list of identified compounds, where the main compounds with low molecular weight were acetic acid (peak 6; 6.6 % and 4.2 %, respectively) and hydroxyacetaldehyde (peak 5; 1.6 % and 3.4 %). In corkdes there’s also 2-hidroxypropanone (peak 8) accounting to 6.1 % but in cork just reach 0.81 %, and 2-oxo-propanal (peak 1) with 4.8% in corkdes but was not identified in cork. Pyran compounds represented 7.2 % in cork, and only 2.0 % in corkdes with levoglucosane (peak 122) representing 5.9 % and 0.53 % respectively. Furan compounds represented 4.4 % and 5.8 %, in cork and corkdes respectively. The main compound in cork was peak 81 (1,5-anhydro-arabinofuranose) representing 1.7 % (it represented only 0.40 % in corkdes). Peak 22 (furfural) and peak 54 (2-(propan-2-one)-tetrahydrofuran) were the major furan compounds in corkdes representing 1.3 % and 2.1 %, respectively (in cork the compounds represented only 0.43 % and 0.25 %, respectively). Other carbohydrates (including not identified compounds) make up the remained of total carbohydrates, accounting to 3.2 % and 7.8 % in cork and corkdes, respectively.
Table 12. Composition of pyrolysis products grouped by derivative families of extracted cork and desuberinized cork (% of total chromatogram area) as determined by Py-GC/MS.
Cork Corkdes
P14 P15 P19 Mean P14 P15 P19 Mean Total lignin 13.2 12.5 12.1 12.6 32.3 33.5 37.5 34.4 S 1.0 0.78 0.47 0.76 5.4 4.2 4.11 4.6 G 7.0 6.5 5.4 6.3 15.9 16.8 17.4 16.7 H 2.5 2.5 2.6 2.5 6.4 7.6 9.0 7.6 Others 2.7 2.7 3.6 3.0 4.6 4.9 7.0 5.5 S/G 0.14 0.12 0.09 0.12 0.34 0.25 0.24 0.28 H:G:S 1:2.9:0.4 1:2.6:0.3 1:2.0:0.3 1:2.5:0.3 1:2.5:0.9 1:2.2:0.6 1:1.9:0.5 1:2.2:0.6 Total carbohydrates 26.4 24.4 25.7 25.6 40.6 33.6 37.1 37.1 Pyran 7.7 7.0 6.8 7.2 2.4 1.8 1.8 2.0 Furan 4.5 4.2 4.5 4.4 5.8 5.8 5.9 5.8 Low molecular 11.0 10.3 11.0 10.8 24.0 18.5 21.9 21.5 others 3.2 2.9 3.4 3.2 8.4 7.5 7.5 7.8 Total suberin 33.2 33.0 32.9 33.0 - - - - Fatty acids 7.4 7.4 7.9 7.6 - - - - Alkane 1.9 2.1 1.6 1.9 - - - - Alkene 18.1 17.5 17.5 17.7 Alkadiene 4.2 4.4 4.4 4.3 - - - - Not identified 1.7 1.6 1.5 1.6