CHEMICAL COMPOSITION OF OYSTERS FROM SÃO PAULO AND PARANÁ, BRAZIL
(Received 28/8/1968)
S. A. ANTUNES & YASUZO ITÔ
*
Instituto Oceanográfico da Universidade de São Paulo
SYNOPSIS
During the years 1966/ 67 a compara tive study of the chemical composition of oysters was performed on protein, water, ash, trimethylamine oxide, trimethyla-mine, cru de glycogen, iron (Fe+ + +), calcium, magnesium, total and inorganic 'phosphorus, wÍth oysters coming from the lagoon regions of the State of São Paulo, namely Cananéia and Bertioga Channel (Santos) , and from the State of Paraná.
The oyster discussed here is the species found ori mangrove tree stilt roots. It was determined as O~rea arborea Chemnitz, by Dr. Hugo de Souza Lopes, Museu Nacional do Rio de Janeiro. Other zoologists have placed the present species in the genus Crassostrea.
Appraisal of the analytical results of the oysters was ma de taking into consi-deration the reproductive cycle and the meteorological conditions of the three . regions under study.
A seasonal variation was observed regarding fat, crude glycogen, dry matter and energy content when related to fresh and dry matter, and of protein when expressed in relation to dry matter.
The seasonal variation are related to the r eproductive cycle of Q'ysters and is probably influenced by water temperature variations which depend on the solar radiation incidénce, and aIs o by phytoplankton abundance.
We endeavoured to determine the season when distinct phases of the oyster reproductive cycle occurs, fattening, ripening, gonadal and sexual products dischar-ge, for e;lCh one of the t hree regions studied, as well as the most favorable time of the yéar for comsumption (wint~r and spring).
This paper shows that oysters are a complementary source of food and income, that their production must be managed for an optimum return to the population inhalfitingr-the lagoon regions of !>razil southern coast.
INTRODUCTION CO.n!?i9!!rirrg the poor standard of living
condi-tíons of the population inhabiting the lagoon regions of Brazil southern coast, specially in the States of São Paulo and Paraná, where these studies were carried out, we endeavoured
.!9
'obtain the essential knowledge which is necessary 'lor improving the mercial production of oysters. The oyster is . a com-plementary source of food and income that must be managed for obtaining an optimum return oSince the knowledge on these moluscs from this part of Brazil is limited to the information ' given by those authors, we have attempted a comparative study of oysters from regions . where they are endemic in the States of São Paulo· and Paraná. The most im-portant natural beds are so distribttted: State oI São Paulo: Bertioga Channel (Santos) and Cananéia; State of Paraná: channel connecting with the Para-naguá Bay.
At present the exploitation of this mollusc is based on collecting from natural beds, although LIMA
& VAZZOLER (1963) have shown clearly the
possibi-lity . of establishing oyster culture in the Bertioga Channel ' (Silntos), similar to the mangrove lagoon region of Cananéia.
• Present address: Hokkaldo K:yolku Unlverslty, HOkkaldo, Japa n.
Publ. n .O 268 do Inst. Oceano da USP.
Bolm Inst. oceanogr. S Paulo, 17(1) :71-88, 1968
We have obtained informa tion on the chemi cal composition and energetic value, on the seasonal va-riation of the chemical composition and its relation to the reproductive cycle, on the environmental fac-tors (mainly water temperature) that may influence the reproductive cycle of the oyster and hence its chemical composition; the seasons during which the oyster has a higher nutritive value and when it is best accepted for its palability.
MATERIAL AND METHODS
Whenever possible, monthly analyses were made during the period March 1966-June 1967_ The sam-pIes carne from Paranaguá (Paraná), Cananéia (São Paulo) and Bertioga ChanneI (Santos, São Paulo)_ Samples were colIected by two different methods. Ten samples were taken directly on natural banks at the same places visited by fishermen. Twenty-five other samples were taken from lots of oysters colIect-ed by fishermen and distributcolIect-ed for sale at the market in Santos.
The period between sampling and analysis varied from 3 h to one day (Bertioga Channel) and 3 to 4 days (Cananéia and Paranaguá). The folIowing data were recorded for each sample: date and place of capture, type of packing and transport; individual length, width, height; total weight; weight of flesh. In addition, the individual filIet value was calculated.
Preparation of Sample
The oysters were carefuIly opened to avoid break-ing the valves and soilbreak-ing the fIesh with debris, to prevent errors in the chemical analysis. The fIesh was dried, weighed, separated in groups, homogeniz-ed and analyshomogeniz-ed in duplicate.
Analysis
Protein: (total N X 6.25) by the KjeIdahl
method according to Lepper (1950).
H umidity : drying to constant weight in a dry
chamber at 105°C temperature.
Fat: (fat extract in ether) by Soxhlet method
according to Lepper (1950).
Ash: MuffIe combustion at 550°C, after
incina-ration at low temperature in an electric resistence oven.
Trimethylamine (TMA) and Trimethylamine
oxi-de (TMO) according to the DYER (1945) and DYER
et
aI.
(1952) methods. Analysis were made with Zeiss Spectophotometer MM 12 at 410 mp..Calcium, magnesium and iron (Fe+ + +): by
chelometry, titriplex IH, according to Merck specifi-cations.
. Total and inorganic phosphorus: according to
the NAKAMURA method, reading taken with a Zeiss Spectophotometer MM 12 at 710 mp..
The indications and further characteristics of the above mentioned methods may be found in lTô
et alo (1968).
Crude glycogen: according to the ROESS method
employing the folIowing procedure: paralIel weight of 10 g of homogenized flesh is taken, add 50 ml distilIed water and heat in water-bath up to the boiling temperature during 30 minutes. The mixture is left to rest and filtered overnight. Add 1.23 ml of 20% trichloracetic acid to each 50 ml of the
filter-72
ed mixture and ' alIow to stand overnight. Add three volumes of absolute ethilic alcohol and store for two days. Filter through filter paper previously dehidrat-ed ând weighdehidrat-ed. Dehydrate in a vacúum dehydrator and weigh. The glycogen retained was calculated by the weight difference. AlI these operations of alterna tive filtering and standing were achieved in a common refrigerator with the temperature ranging from O to 5°C.
M eteorological Data
Meteorological data for Cananéia were supplied by the southern station of the Instituto Oceanográfico da Universidade de São Paulo; for Bertioga, by the Força Aérea Brasileira, Santos meteorological Station and AZEVEDO, AZEVEDO (1965); by the Departamento de Agricultura, State of Paraná, for Paranaguá. The global radiation at Cananéia was obtained with a calí-brated actinograph and with a standard solarigraph of the Oceanographic Institute and at Santos it was cal-culated on the basis of daiIy month radiation (n) obtained with a heliograph and the radiation incident per cm2 on a given day on horizontal surface lying on
the ground was calculated by the following formula :
Q/Qo
=0.24+
0.58njN .
This formula was given by CERVELINE, SALATI & GODOY (1967) who calculated this to be the ave-rage equation for the State of São Paulo, where:
Qo
is the total solar radiation in caljcm1!jday that reaches the ground leveI in the absence of the atmosphere, obtained from Tables of the Meteorological Service,
in SALA TI & others (1967). N is the number of hours of possible radiation calculated from the annual date of the São Paulo Observatory (Univ. São Paulo, Inst. Astr. Geof., 1966). The water temperature was obtained by means of a "mercury in steel" hydrother-mograph with remo te bulb, about one meter beIow the water leveI.
RESULTS AND DISCUSSION
The resuIts of the chemical analyses of oysters brought to Santos from different regions are presented under different aspects.
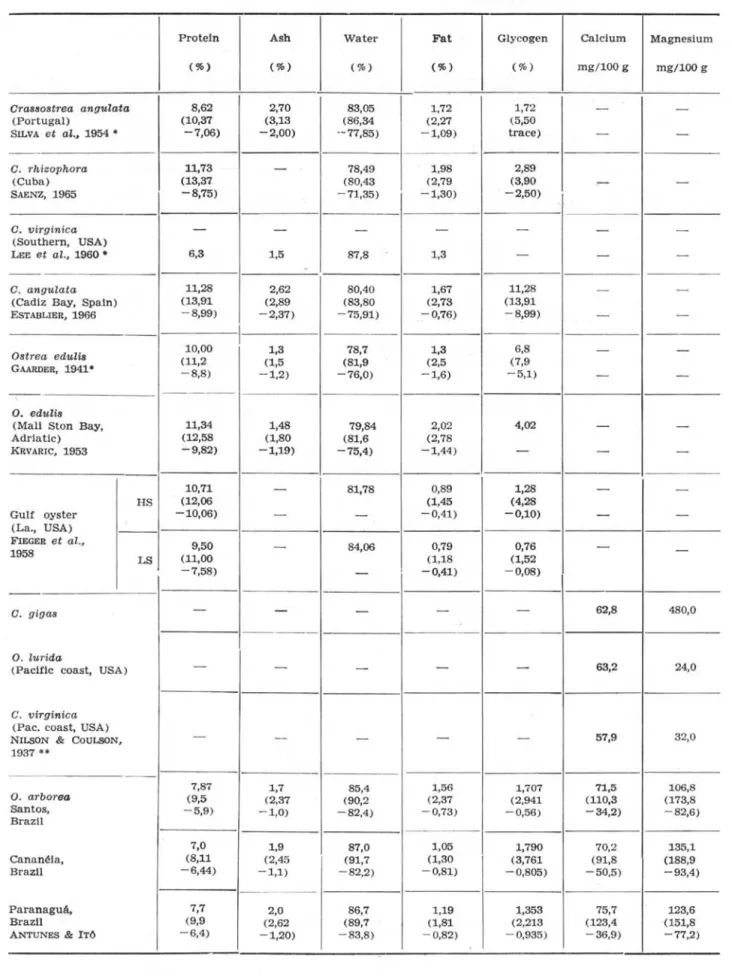
Chemical composition - The maximum average and minimum values obtained are shown in Table 11 together with values obtained by other authors for
comparison. . .
Data show that the oysters studied here have a relativeIy high water content, similar to that observ-ed in the genus Crassostrea rather than in Ostrea
VINOGRADOV (1953), ESTABLIER (1966). The mag-nesium content is higher than the calcium content, differing from the observation of most authors who analysed oysters. It agrees however with the obser-vations by NILSON & COULSON, 1937 (in: VINOGRADOV,
op. cit.) on Crassostrea gigas from the Pacific coast
of the United States.
~
S :;' ~g
;g
;::> o ~ til '1:l \Ile
s>...
...
2
i:i
00 .00...
~ 00c;i
.,
.... ;::> +> c. ol '-'....
o.,
'-' ol5::
Bertioga Channel (Santos) Average S.D. Cananéla . : Average S.D. Paranaguá Average S.D . ,.,
õ'a <Il ~S õl
<Il ol :>. <Il
õl
....
.,
s::0.<: .... ol
.... ~ ...
.,-
oS;!l
;::> ., +>.,
ol
zs
t:l18 03/12/66
18 05/17/66
18 06/24/66
18 07/18/66
1$ 08/09/66
18 09/14/66
18 10/11/66
18 11/09/66
18 12/01/66
6 12/05/66
16 12/22/66
11 01/22/67
10 03/02/67
16 04/17/67
-
--
-18 05/16/66
18 06/24;/66
18 07/ 22/66
18 08/19/ 66
18 09/25/ 66
18 10/24;/66
18 12/05/66
14 02/21/67
15 03/20/67
21 04/ 2S/ 67
24 06/05/67
-
--
-18 05./30/66
18 06./27/66
18 08/3:L/66
18 10/24/66
18 11./28/66
18 01/11/67
15 02/22/67
24 04/10/67
20 05/03/ 67
-
--
-T ABLE I - Chemical anaJysis of oysters - Paranaguá - Cananéia - Bertioga Channel
IN FRESH MEAT
-
<Il<lJbC ;::>
s:: ~ ~
.<:
.,
<IJ+
....
00 00 oS _ 0 s::o os:: o 13 Sri .<: <Il +
~ bC S~ '-' ol~ ol~ c.~ ;::>~ +~
;::> 00 p _00 - 13 ~ 00 t) o 00 .,00
.,
<IJ138 õl8 00 .9'8 ~~ '<:0 - .... 0 r..
°
00
...
;::> s:: "'-o S::°o ~~"ri
....
ol'<:riol~
....
'@ ;::>ri.,
.,ri.,
.,
ri.~
-
--....
s::-.... "'~sbJi
--....
00"'- ... ...6:i 13
....
~ .... ~~*
t) 00 0000 13", ol 00 S-4 ri) biI S::bJi8~ e~
g
~ 130* ol* ãl 13 ol 13 t: 13 1:">< -c; 13 ~ 13
~~ ~~ p..~ r..~ <~ t.J~ ~~ t.J~ E-<~ E-< o E-<~ H "'-~ H ~
11,7 86,9 7,9 1,00 1,5 99,5 105,5 0,742 0,12 4,0 210,0 150,0 2,9
8,8 85,1 7,8 1,72 1,7 110,3 125,3 1,852 0,14 0,0 350,0 113,0 3,0
8,0 88,1 5,9 0,88 2,2 83,8 173,6 1,830 0,00 0,0 386,1 161,4 2,9
9,5 85,3 7,9 1,32 2,1 83,9 111,9 2,158 0,04 0,2 358,9 153,8 2,2
10,5 83,0 8,1 1,86 1,5 68,5 103,6 2,753 0,00 0,0 364,9 162,2 4,5
10,1 82,9 8,5 1,87 2,0 54,9 112,8 2,398 0,10 1,6 701,3 316,2 2,1
8,2 83,9 8,2 1,83 1,7
-
- 1,949 00,0 0,0 600,4 367,4 3,29,9 82,7 9,3 2,32 1,7 34,2 88,80 2,949 0,10 0,8 700,4
-
2,89,2 82,4 9,5 2,37 1,3 68,1 82,60 2,588 0,00 0,7 886,4 423,5 2,0
9,7 84,3 8,8 2,15 1,9 84,9 110,9 1,033 0,00 0,01
-
-
-9,8 85,2 7,8 1,79 1,0 36,7 64,1 1,089 0,00 0,1 564,9 211,8
-13,0 87,9 7,7 1,00 2,1 68,8 117,3 1,119 0,10 2,4
-
-
-9,6 90,2 6,2 0,73 1,6 68,0 87,5 0,562 0,04 0,0 349,3 67,0 6,6
13,0 88,0 6,7 1,06 1,8 69,1 105,6 0,800 0,02 2,0 203,9 81,4 8,3
- 85,4 7,87 1,56 1,7 71,5 106,8 1,707 0,08 1,31 473,0 200,7
--
2,53 1,01 0,53 0,36 20,07 24,47 0,78 0,03 1,24 204,8 114,1-8,3 88,9 6,5 0,82 1,80 91,8 151,7 0,875 0,00 2,0 735,0 188,0 3,5
7,6 85,9 6,9 1,09 2,10 60,2 188,9 1,877 0,00 0,0 352,8 176,5 2,2
7,6 82,2 7,9 1,30 2,20 90,4 152,2 3,761 0,00 0,4 . 255,2 127,6 4,0
8,5 84,9 6,9 1,24 2,10 79,9 120,8 2,797 0,00 0,2 217,4 "118,5 4,0
7,9 85,6 7,9 1,20 2,10 51,9 157,7 1,703 0,90 0,6 31,4 19,9 1,4
7,7 86,4 6,6 1,20 1,90 50,5 - 1,217 0,50 0,2 45,40 28,6 1,0
9,8 87,8 6,9
-
1,60 64,0 142,5 1,042 0,40 0,0-
- 1,27,1 90,8 6,8 0,81 1,10 57,9 124,3 - 0,04 - -
-
12,38,4 91,7 6,4 0,71 1,90 67,9 93,4 1,061 0,30 0,0 - - 6,6
7,7 85,8 8,1 1,11 2,40 87,7 102,72 2,440 0,50 6,0 -
-
-7,4 87,2
-
- 2,45-
-
1,128 0,50 0,0 286,2 70,97 9,42-
87,0 7,0 1,05 1,90 70,2 135,1 1,790 0,50 1,56 175,1 104,30-- 2,46 0,6 0,278 0,39 15,10 28,16 0,810 0,32 2,07 136,07 62,02
-9,5 87,4 7,7 1,06 1,2 74,2 117,7 1,495 0,00 0,0 218,0 157,0 3,5
7,3 87,7 6,4 0,85 1,9 123,4 142,9 1,417 0,1 0,4 318,3 156,4 3,4
8,5 83,8 7,4 1,59 1,9 72,2 88,1 2,213 0,0 0,0 67,3 33,4 4,1
7,9 83,9 1,4 1,59 1,9 55,4 151,8 1,997 0,0 0,0 90,5 33,9 1,0
6,6 . 84,8 7,5 1,29 3,0 36,9 140,5 1,355 0,2 1,6 364,8 179,8 1,2
-
86,6 9,5 1,26 2,07 - - - 0,2 3,6 --
-8,1 89,7 6,9 0,82 2,62 84,34 135,58 - - -
-
- 13,26,9 87,2 9,9 1,10 1,67 67,40 77,20 0,935 0,0 0,0 205,7 80,4 3,9
6,8 89,2 6,3 0,96 1,65 91,75 134,94 0,061 0,1 1,2 - 99,37 12,0
-
86,7 7,7 1,19 2,01 75,70 123,6 1,353 0,075 0,825 210,80 105,8 7,14-
2,02 1,18 0,33 0,50 24,00 25,42 0,65 0,08 1,13 108,28 55,74-- -- -- -- ---
-IN DRY MATTER
s::
'@
....
~"td~
~*
~~
p..~ r..~ <~
60,3 7,39 11,4
52,3 11,54 11,4
49,5 7,39 18,4
53,7 8,97 14,2
47,6 10,40 8,8
49,7 10,90 11,60
50,9 11,30 10,5
53,7 13;40 9,8
54,0 13,50 7,4
56,0 13,69 12,1
52,7 12,10 6,7
63,6 8,30 17,3
63,3 7,40 16,3
55,8 8,80 15,0
I
-
--I
- --I
I
58,55 7,39 16,2
48,93 7,73 14,9
44,40 7,30 12,3
45,70 8,21 13,9
54,90 8,33 14,6
48,50 8,82 13,9
56,50
-
13,173,90 8,80 11,9
77,10 8,55 22,9
57,00 7,81 16,9
-
-
19,1-
-
--
-
-61,1 8,41 9,5
52,0 6,91 15,4
45,7 9,81 11,7
50,0 11,24 13,0
49,3 8,48 19,7
70,9 9,40 15,4
67,0 8,00 25,4
77,3 8,59 13,0
58,3 8,88 15,3
34,0
-
--
-
-s::
.,
00
o t) p
00
.,
"'~
E*
t.J~ 5,6 12,4 15,3 14,6 16,1 14,0 12,1 17,0 14,7 6,6 7,4 9,9 5,8 6,6
-7, 13, 21, 18, 11, 8, 8, 3 4 54-TABLE II - Chemical composition of oyster from different places (fresh meat)
Proteln Ash Water Fat GJycogen Calcium Magneslum
( %) (%) (%) (% ) (%) mg/100 g mg/100g
Orassostrea angulata 8,62 2,70 83,05 1,72 1,72
-
-(Portugal) (10,37 (3,13 (86,34 (2,27 (5,50
SILVA et aI., 1954 • -7,06) -2,00) '-77,85) -1,09) trace)
-
--O. rhizophora 11,73
-
78,49 1,98 2,89(Cuba) (13,37 (80,43 (2,79 (3,90
-
-SAENZ, 1965 -8,75) -71,35) -1,30) -2,50)
O. virginica
-
-
--
--
-(Southern, USA)
LEI': et aI., 1960 • 6,3 1,5 87,8 1,3 - -
-O. angulata 11,28 2,62 80,40 1,67 11,28 -
-(Cadlz Bay, Spaln) (13,91 (2,89 (83,80 (2,73 (13,91
ESTABLIER, 1966 -8,99) -2,37) -75,91) -0,76) -8,99) -
-I
-Ostrea edulis 10,00 1,3 78,7 1,3 6,8 -
-GAARDER, 1941' (11,2 - 8,8) -1,2) (1,5 -76,0) (81,9 -1,6) (2,5 -5,1) (7,9
-
-- --
-O. edulis
(MaU Ston Bay, 11,34 1,48 79,84 2,02 4,02 -
-Adrlatlc) (12,58 (1,80 (81,6 (2,78
KRVARIC, 1953 -9,82) -1,19) -75,4) -1,44)
-
-
-10,71
-
81,78 0,89 1,28 --HS (12,06 (1,45 (4,28
Gulf oyster -10,06)
-
- -0,41) -0,10)-
-(La., USA)
-FIEGER et aI., 9,50
-
84,06 0,79 0,76-1958
-LS (11,00 (1,18 (1,52
-7,58)
-
, -0,41) -0,08)O. gigas
-
-
-
- - 62,8 480,0O. lurida
(Paclflc coast, USA) -
-
-
--
63,2 24,0O. virgi nica
(Pac. coast, USA)
NILSON & COULSON,
-
--
- - 57,9 32,01937 ••
7,87 1,7 85,4 1,56 1,707 71,5 106,8
O. arborea (9,5 (2,37 (90,2 (2,37 (2,941 (110,3 (173,8 Santos, - 5,9) -1,0) -82,4) -0,73) -0,56) -34,2) - 82,6) Brazll
7,0 1,9 87,0 1,05 1,790 70,2 135,1
Cananéla, (8,11 (2,45 (91,7 (1,30 (3,761 (91,8 (188,9
Brazll -6,44) -1,1) -82,2) -0,81) -0,805) -50,5) -93,4)
paranaguA, 7,7 2,0 86,7 1,19 1,353 75,7 123,6
Brazll (9,9 (2,62 (89,7 (1,81 (2,213 (123,4 (151,8
ANTUNES & ITO -6,4) -1,20) -83,8) - 0,82) - 0,935) - 36,9) -77,2)
• in ESTABLIER, 1966 - •• in VINOGRADOV, 1953. HS = Hlgh sallne; LS = Low saline.
As a rule the protein and ash content is lower than that observed by other authors.
The presence of trimethylamine oxide (TMO) in 19 out of 32 analysis differs considerably from the observations of the total absence of TMO recorded by NORRIS & BERNOIT, 1945 (in: DYER, 1952) in Ostrea
japonica, in O. virginica respectively from the
Atlan-lic and the Pacific Oceans. We found no other refe-rences to TMO content in oysters.
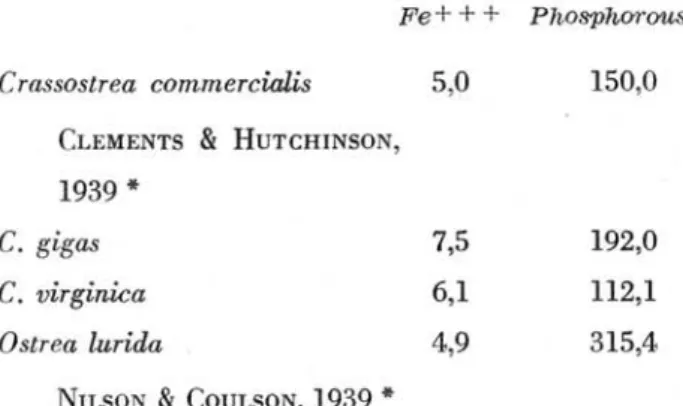
The results obtained for iron (Fe + + + ) agree in general with those found by other authors, but the maximum and minimum values are quite distant from each other (CLEMENTS & HUTCHlNSON, 1939; NILSON & COULSON, 1939 in: VINOGRADOV, 1953).
Iron (Fe+ + +) and Phosphorous determination in oysters (mg/l00 g of fresh meat)
Fe + + + PhOsphorous
Crassostrea commercialis 5,0 150,0
CLEMENTS & HUTCHlNSON, 1939
*
C. gigas
C. virginica
Ostrea lurida
NILSON & COULSON, 1939
*
7,5 6,1 4,9192,0 112,1 315,4
Energetic values - The energetic values shown in Table
IH
were observed in connection with Rubner index: 4.1 for protein and glycogen, 9.3 for fats.The average results calculated per season are shown and compared to those obtained by other authors. Our data indicate that oysters (from Santos, Cananéia and Paranaguá) show a lower food values than that found by other authors for oysters from olher grounds.
Oyster characteristics for consumption - Accord-ing to ENGLE (1958), there is a dose relationship between the glycogen content and acceptance of oyster for consumption. ENGLE (op. cit.) also suggests that glycogen content, percentual value of dry weight 01'
total solid matter and condition factors are the accep-table way by which the quality of oysters may be measured.
FI EBER et aI. (1958), noticed that a decrease in the glycogen content causes the oyster flesh to become watery. These observations agree with ours, i. e., when they are said to be "fat" and have a better taste, they also have a higher glycogen contento The increase in glycogen content coincides with the season of the year when gonads become ripe and the fat content also increases similarly to KRVARIC'S observa-tions (1953) . This occurs here in winter and spring,
• In: VINOGRADOV, 1953 .
Bolm Inst. oceanogr. S Paulo, 17(1) :71-88, 1968
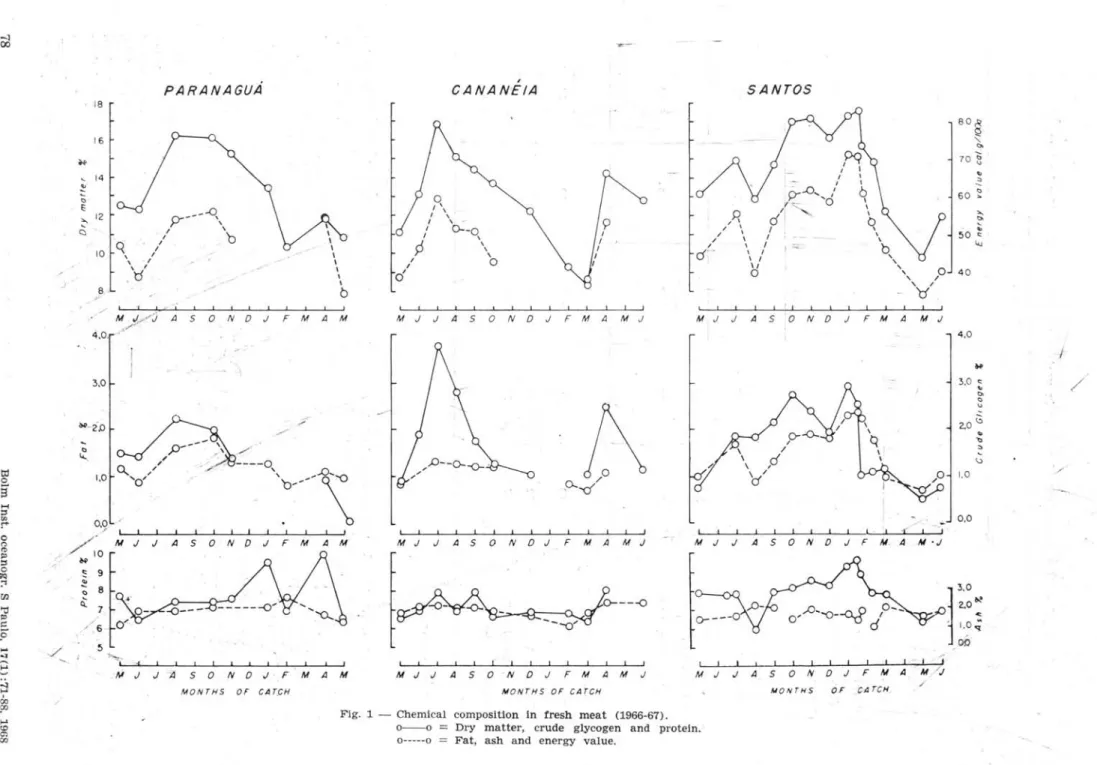
Seasonal variation of the chemical composition and energetic value - The results of protein content, ash, water, glycogen, dry matter and energetic value are shown on Figure 1 for fresh material and Fi-gure 2 for dry material. Both graphs are drawn from our data.
The analysis of the variation shown on Figures 1
ano 2 will be divided as follows:
1 - Variation: observation and description or variables.
2 - Relation among the different analysis and their meaning.
3 - Factors influencing the season variation. 4 - Analysis of the present data.
Variation - Observations and description. Ta-ble V shows graphically the trend of variation of the variables analysed: glycogen, fat and dry matter.
Table V shows a correlation between the speci-mens from Cananéia, Paranaguá and Santos, taken in June!July 1966 and March! April 1967, increase on glycogen, fat and dry matter value; in November 1966 until February 1967 there is a decrease of dry matter. Oysters from Paranaguá and Santos in May! I June 1966 show a decrease on the value of the three factors while in J uly / August 1966 there is an increase. Oysters from Paranaguá and Cananéia in October/November 1966 and ApriljMay 1967 show a decrease of the three factors in Paranaguá and gly-cogen and dry matter in Cananéia.
Glycogen and fat generally vary in a similar way, however they show an opposite trend of varia-tion in AugustjSeptember 1966 for Paranaguá oysters and November/ December 1966 for Santos oysters. Relation among the different analysis and their meaning - It is well known that animaIs generally store energy in the form of fat and that molluscs, including oysters do it under a different form, na-mely glycogen. Glycogen is thus more important than fato STETTEN & STETTEN, 1959 (in: WILBUR
& YONGE, 1966) showed conclusively that glycogen
is used by oysters as main energy storage substance. Several authors noticed a correlation between the glycogen and fat content during the reproductive cycle of oysters. RUSSELL, 1923 and GAARDER, 1928 (in: WILBUR & YONGE, 1966) have shown that the repro-duction cycle is paralleled by a rerepro-duction in glycogen content, indicating that gametogenesis causes an in-crease in metabolic requirements_
OKASAKI & KOBAYASHI, 1929 (in: WILBUR & YONGE, 1966) found a minimal glycogen content dur-ing the breeddur-ing season in Ostrea circunspicta. MAT-SUMOTO et ai., 1934 (in: WILBUR & YONGE, 1966) observed a positive correlation between the
reproduc-tive cycle and glycogen, fat and total nitrogen content --in Crassostrea · gigaS. They divida the reproductive cycle into three stages: fattening. gonadal ripening and discharge. of sexual products.
TABLE IH - Energy content (caloriesl*lOO g fresh meat) of oysters
Place
I
SeasonI
DateI
Prote!n \Fat % x 9,3
I
Glycogen Total% X 4,1 % X 4,11
Bertloga Summer 03/12/ 66 32,4 9,3 3,0 44,7
Channel
(Santos) Fall 05/17/66 32,0 16,0 7,6 55,6
06/24./66 24,2 8,2 7,5 39,9
W!nter 07/18/66 32,4 12,3 8,8 53,5
08/09/66 33,2 17,3 11,3 61,8
09/14/66 34,8 17,4 9,8 62,0
Sprlng
10/11/66 33,6 17,0 8,0 58,6
11/09/66 38,1 21,6 12,1 71,8
12/01/66 38,9 22,0 10,6 71,5
12/05/66 36,1 20,0 4,2 60,3
12/22/66 32,0 16,6 4,5 53,1
I
Summer01/22/67 31,6 9,3 4,9 45,8
03/02/67 25,4 6,8 2,3 34,5
-Canané!a Fall 05/16/66 26,6 7,6 3,6 37,8
I
W!nter 06/24/66 28,3 10,1 7,7 46,1
07/22 / 66 32,4 12,1 15,4 59,9
08/19/66 28,3 11,5 11,5 51,3
Spr!ng 09/25/66 32,4 11,2 7,0 50,6
10/ 24/66 27,1 11,2 5,0 43,3
12/05/66 28,3 -
-
_ ._
-I
Summer 02/21/67 27,9 7,5
-
-03/ 20/67 26,2 6,6 4,3 37,1
Fall 04/28167 33,2 10,3 10,0 53,5
Paranaguá Fall 05/30/66 31,5 9,8 6,1 47,4
Winter 06/27/66 26,2 7,9 5,8 39,9
08/ 27/ 66 30,3 14,8 9,1 54,2
Spr!ng 10/ 24/66 30,3 16,8 8,2 55,3
11/ 28/66 30,7 12,0 5,5 48,2
Summer 01/ 11/67 38,9 11,7 -
-02/22/67 28,3 7,6
-
-Fall 04/10/67 40,6 10,2 3,8 54,6
05/ 03/ 67 25,8 8,9 0,2 34,9
• Rubner Index.
T ABLE IV - Energy content of oysters in various seasons (calories/lOO g fresh mea t)
Sprlng Summer Fall Wlnter Average
Ostrea luri da
(Columbla - Canadã· 75
TULLY, 1935
Ostrea glgas
(Columbla - Canadã) 89
TULLY, 1935
Ost1'ea virgínica
(Columbla - Canadã) 88
Ostrea edulis
(MaU Sto Bay, Adrlatlc) 90
KRVARIC, 1953
08trea arborea
(Santos - Brazll) 63
(paranaguã - Brazll) 52
(Cananéla - Brazll) 47
ANTUNES & ITÔ
• in KRVARIC, 1953.
The fattening period occurs in autumn and winter according to MATsuMoTo (op. cit.) , and during this period the glycogen content increases and reaches its maximum, Fat content remains near average.
Both glycogen and fat content increase during this period; however, the word "fattening" is mislead-ing since the glycogen increase is much greater than that of fat content as the word would suggest.
The gonadal ripening period occurs by late spring, when the fat matter reaches its maximum and glyco. gen begins to decline. The general trend is therefore opposite, positive for fat matter and negative for gIy-cogen, a fact which originates the crossing in Ta-ble
V.
According to BAKER, 1942 (in: WILBUR & YONGE, 1966) glycogen is mobilized more easily than fat, according to GODDARD & MARTINS, 1966 (in:
WILBUR & YONGE, 1966) may be converted into fat during this period of the reproductive cyc1e even
Bolm Inst, oceanogr. S Paulo, 17(1) :71-88, 1968
68
75
65
76
41
-3772 70 71
72 82 79
63 75 73
77 85 82
48 59 54
46 48 48
46 52 47
though the animal is not actively feeding. The major part of the fat material is stored in the sexual pro-ducts. No loss of weight was observed during thi8 phase and the fat produced comes directly from the reduction in glycogen. The discharge of sexual pro-ducts is accompanied by a falI in glycogen and fat content and by an i ncrease of nitrogen as shown in Table V. According to MATsuMoTO (op. cit.) this occurs in summer (Japan). 0ther authors found a similar relationship between glycogen and fat content and the reproductive cycle, emphasizing that the pe-riod of the year when such changes occur are infIuenc-ed by local factors. OKAZAKI & KOBAYASHI, 1929
(in: WILBUR & YONGE, 1966) noticed a maximum
glycogen content during spring in O. circunspicta and
the leveI attained remained unaltered until J uly, reaching its minimum in September. BIERRY et alo
1937 (in: WILBUR & YONGE, 1966) confirmed these
results in O. edulis and C. angulata where as
VENKA-TARAMAN & CHARI, 1951 (in: WILBUR & YONGE, 1966) working on oysters from the Madras Coast
cxl
tIl
O
S
H ::I
til
!""
o
'" '"
P>
::I O
9Q
:-s rn
..,
I!>
s:: _õ
...
..
2
~
00 IX'
...
<D O>
00
../
PARANAGUA
. 18
16
H , 14
~
"
t;
P---q
I '
n I '
10 1 - ' , ' , I .
'b
2 12
C)
8 · / '
, . I
. \::5'
// M ~ / J
.J~~ '/
A 5
o
N O J F M A M4.0
3.0
I><>- ÚJ
"
...
M ---
"p----
;. . : ----O.\ . / ,'
1"\
a.. /
'.'
', __
-v~-o", 'cf'
~--
\ 0;9L '/ . M J J A 5 O N O J F M A M
. I><> 10
t: 9
...
"
B ~ 7,/ ~ o~ 5
~ . "",-LI~. ' ~ ' __ ~ __ L-~ __ ~~ __ ~ __ L-~~~ __ L-~
M J J 7JSO N D J F M A M
M ONrHS or c Ar.cH
I
I O
I
,
CANANE/A
O
1\
I ,
"
'0:-
0I \
P
''o
M J J A S O N D J F M A M J
~I\
. -0
M J J A S O N D J F M A M J
r
M J J A 5 ON O J F M A M J
M ONrHS or CArCH
SANTOS
80", Q
"-'"
,Pq
I I
I I
p--O" ,/
b
y ~ O I
, ) " I
d !
I1 b
,
'
I ~ \
70 "§
"
~
"
60 ~,.,
'"
"
50 ~'"
li -
b\ I '
O "
,
,
oJ
40/
, I
'ó
M J J A S O N D J F M A M J
< /~ l " ;
M J J A 5 O N O J F M. A !ri ' J
I - ~
M J J A 5 O N DJ F !ri A ' !rI .7;
M ONrHS ar CArC H, ./
4 .0
..
3.0 ~
"
'"
"
"
2,0 ~
1.0
0.0
..
..,
~
"
2,0~
l
3'0. I.?;
00Fig. 1 -- Chem!cal compositlon in fresh meat (1966-67) . 0 -- 0 Dry matter, crude glycogen and protein. 0---0
=
Fat, ash a nd energy value.-f
/
~
s
....
::s
.,
r+O
n ti>
~
::s
O IJQ ;S
rn '1l
~
s:
?
...
..
2
:::,
....
00
,!Xl
....
<O
O'>
00
-l c.o
-....
22
18
..
o"
c, 14~
"
<:;
"
10~
"
680
76
70
66
~
~ 62
..
~ 58
<t-54
50
46
PA RA tyA GUA J
/
~
O ..o-O"Q
//0//'"'""\--...
'0_'-''\/
-
\
' . I ! I I
MJ J A S O N D J F MAM
)966
l '
I I
I
I
I I I
1951
L ._
I
-'~--I
'p- I
\ / Ó
\ /
ti
I
~
/ \ I \
9 \
I \\ \ \
M J J A 5 O N O J F ~ A M
' 966 1961
MO!, THS OF CATCH
C ANANEII-<
M J J A SOND J F M A M J
1966 1951
R
/ \
cf \
!
1I
d
I 1\1/ I I
-=-
--iê-
9
II
,
I
.~ I
\ I
\ O /)
\ 1\ /
\ I \ /
\ I \ /
\ I \ /
O I \1
\ I O
\ I
\ ..D
tr
M J J A S O N D J F M A M J
19 66 1961
M CNTHS OF CA TCH
Fig. 2 - Chemical composit1on in dry meat.
0 - - 0 Crude glycogen, ash.
0-···-0 = Protein, fato
/
SANTOS
-<:f'p
MAM J J A S O N D J FMA
1965 1961
r::
i
181
~ .1
14~
.,
J
I ,o
26
22
\
v
~~Rr -'! \
-"
\ . . / \
\ .
.'
\iz
F,
joDg
C..
~
14 ~
'q
10
\ / \ /
tf \
/ 0 \ /06'
MAM J J A S O N D J FMA
19 55 1961
MON THS OF CA TCH
TABELA V
DATE CANANÉIA SANTOS
OF ANALYSIS PARANAGUÁ
Mar/ Apr-1966
/'
l'
/#
/ /
3-4
.-
/Apr/ May
/'
11
.-~/ /
4-5 / /
May/ lun
~
,
,
~
,
,
~/'
/11
/li
~
,
,
~
,
,
~
5-6 / /
Jun/ lul
/'
j1
JI
/'
j1
Jf
/'
11
/~/ / / / / / /
6-7 / / / / /
Jul/ Aug
/'
/<1
JI
~
,
,
,
,
/'
fi
/~7-8 / / / / ~
-
/.-
/ /Aug/ Sel
X
---.
~
,
, ,
,
X
---+
8-9
~
~Sel/ Oet
X
---+
~
---C>
,
,
~
,
,
;',
9-10
-
~-Oet/ Nov
~
,
,
,
,
~
,
,
/'
fi
"
10-ll ~
-
-
/ / / /Nov/ Dee
,
~
,
X
,
- - - - ( >
,
,
,
11-12
~
~ ~"
,
/'
, ,
12/ 01/ 67 ---C>
,
, ,
--
-
~ ~Jan/ Feb
"
,
,
~
,
,
,
,
,
,
1-2 ~
~
~ ~-Feb/ Mar
J1
JI
,
,
~
,
,
,
,
, ,
2-3 / / ~
-
~--/ /
Mar/Apr
11
"
/'
/J
JI
/'
11
"
/ / / / / /
3-4 / / / / / /
Apr/May
~
,
, ,
,
~
,
,
4-5 ~
-
~May/ lull
~
, ,
5-6
~
,
11
Slable
---t>
Decrcase,
Increase /~ /
Glycogell
- E >
Fal---C>
Dry. maltel"---+
found a larger fat ratio from August to December with a minimum in October. These authors observed a coincidence during this time of the year with a grea-ter availability of food in the period preceding sexual maturity. Recently ESTABLJER (1966), reached similar conclusion for C. angulata and found a correlation between glycogen, fat matter and spawning and hy-drobiological conditions such as water temperature, and especially the presence of abundant phytoplank-tono
The fluctuation of total fat and glycogen content observed here and reflecting the observations on oys-ters and phytoplankton in this area, a tentative con-clusion was reached that here too the fluctuations are correlated to the reproductive cycle.
Figure 1 show that dry matter is correlated to glycogen and fat matter contento These observations confirm those by ENGLE, 1958 who reached similar conclusions after a 10-year period of analysis on oysters from Maryland (U. S. A.) and with those reported by ALVAREZ-SEOANE, 1960, who worked ou another mollusc, Tapes pulastra in Spain. These ob-servations also suggest that dry matter may be used as an indicator of a series of variations of glycogen and fato
Water temperature Rain
April to Above lSOC Scarce
October, November
(in Establier, 1966)
Protein content did not respond to any seasonal variation in relation to the wet weight of fresh ma· terial (Fig. 1), but it varied in relation to dry matter. Figure 2 shows a clear variation opposite to that of glycogen and fat, thus confirming obser-vations by KRVARIC (1953) for O. edulis and LOPES BENITO (1955) for Pecten jacobeus. Opposite trends
are well marked from May to October at Paranaguá and Cananéia, from March to October at Santos, and from April to May at Paranaguá and Santos.
Factors influencing the seasoning variation -After establishing the correlation between the repro· ductive cycle of oysters, the glycogen content and fat variation with dry matter, we must analyze the fac· tors that may be involved in the system. The pro-blem is complex due to the influence of temperature, salinity and food availability for the oysters.
Obviously, many authors working on different species from various places have noticed a different
Bolm Inst. oceanogr. S Paulo, 17(1) :71-88, 1968
effect of salinity on both spawning and level survival. RANSON, 1940 (in: ESTABLJER, 1966) considers the salinity interval 18-23°/00 to be the favorable condi-tion for the development of Crassostrea larvae while
MARTEIN 1957-60 (in: ESTABLJER, 1966) who carried out similar investigations on C. angulata from
Mor-bihan found them to spawn at 29-35%0 salinity, while the larva e live between 28-35.7°/00 salinity; VILLELA (1954) found oysters to lay eggs in Tejo river estuary between 22, 23-32, 39°/00 salinity. AMEMYA 1926, (in: WILBUR & YONGE, 1966) found the lower and upper leveI that would permit deve-lopment of C. angulata to be 21 .and 43%0.
For what concerns water temperature, MARTElN, 1957-60 (in: op. cit.) observed that temperature of
18°C or higher induced sexual maturity and spawn-ing; spawning was also induced by a sudden rise in temperature from 18° to 22°C. VILLELA, 1954
(in: ESTABLIER, 1966) observed similar temperature
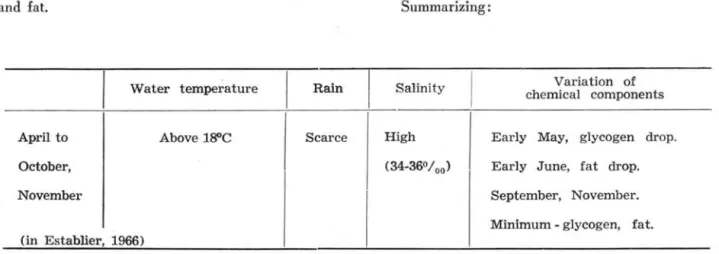
intervals and reported spawning to occur between 18°C and 23. 8°C. Recently ESTABLJER, 1966 noticed spawning to be induced by temperature higher than 18°C and a parallel drop in glycogen and fat content.
Summarizing:
Salinity
High
Variation of chemical components
Early May, glycogen drop. Early June, fat drop. September, November. Minimum - glycogen, fato
The reproductive cycle is closely dependent on the temperature conditions and is paralleled by lhe glycogen and fat content values.
The behaviour of the oyster in relation to tem-perature in this area may be analyzed. It is impos-sible however to analyze the oysters reproductive cycle in relation to salinity, because we have no data for some of the points and yet given the estuary situa-tion of the localities studied, salinity is known to bc very variable. We have thus analyzed our data as a function of total precipitation in the area, and as a function of water temperature and the principal cause of water temperature variation, i. e. total incident radiation.
Analysis of the present data - According to Figure 1 and Table V connection with reproductive cyclé ' periods as shown by MATsuMoTo, 1934
(in-WILBUR & YONGE, 1966) we have:
Place - Period of analysis - Analytical eVI-oence.
Fattening - glycogen increase
Paranagu-á- 6/66 to 8/66 GJycogen, dry matter, fat 2/67 to 4/67 Dry matter, fat
Cananéia 5/66 to 6/66 Glycogen, dry matter, fat 3/67 to 4/67 Glycogen, dry matter, fat Santos 3/66 to 5/66 Glycogen, dry matter, fat 6/66 to 8/66 Glycogen, dry matter, fat 10/66 to 11/66 GJycogen, dry matter, fat 3/67to 4/67 Glycogen, dry matter, fat Gonadal ripening - drop in glycogen and in-crease in fat
Paranaguá 8/66 to 10/66 Santos 8/66 to 9/66 11/66 to 12/66
Discharge of sexual products - drop In
glyco-gen, fat, dry matter and energetic value Paranaguá 5/66 to 6/66
10/66 to 12/66 1/61to 2/67 4/67to 5/67 Cananéia 7/66 to. 9/66
Santos
9/66 to 12/66 12/66 to 2/67 2/67to 3/67 4/67to 6/67 5/66to 6/66 9/66 to 10/66 12/66 to 3/67
LIMA & VAZZOLER, 1963 studied samples from the Bertioga Channel -and observed:
a) lack of fixation of spat during the time in-terval . March/May 1961. In our work (1966-67) we observed a coincidence in the first months with the fattening period, and therefore with a glycogen and fat matter storage and not with spawning period. b) no spawning during the rainy season that causes a salinity drop, thus inhibiting egg laying and spat fixation.
However our observations show three different periods for spawning thus distributed: May/June -dry season; September/October - moderate rainfall; December-66/March-67 - heavy rainfall (see rainfall in Fig. 3).
This observation disagrees with that of LIMA & V AZZOLER (op. cit.) that no spawning occurs during the rainy season that causes a salinity drop inhibit-ing egg layinhibit-ing and spat fixation.
GARCIA OCCHIPINTI (1963) studied the elimatolo-gy of Cananéia and concluded that water temperature variations are mainly caused by solar radiation va-riation due to the following causes: water column; high absorption of incident radiation caused by dark mud on the banks, by the dark colo r of the water due to suspended organic matter and dissolved humidic acids; low exchange of temperature in the air-sea water surface.
82
We observed that absorbed radiation is the main factor influencing the seasonal variation of the che-mical composition of oysters causing distinct phases of their reproductive cyele to undergo the influence of the water. The absorved radiation also influences their feeding behavior and the importance of this facto r is stressed during the fattening period.
We must correlate: absorbed radiation (Q), ave-rage water temperature, rainfall and as it was impos-sible to obtain the water temperature from the three regions studied, the air temperature in connection with the glycogen, fat and dry matter variation must be considered as indicators of oysters reproductive cyele. To ascertliin whether the chemical composi-tion variacomposi-tions observed during the period 1966-67 could be considered as average for those regions, we compared the variation of the meteorological findings for each region. Thus we will be able to evaluate the possibility of the same conditions observed being reproduced.
We have for Cananéia region the longer and most complete series of meteorological observations (Universidade de São Paulo. Instituto Oceanográfi-co, 1965) and the following variables: air and water temperature; absorbed radiation (Q); rainfall. Data for Cananéia will be used for comparison with those obtained for the other two regions for which we have data covering only some variables.
Santos - au temperature, solar radiation and rainfall.
Parana.guá air temperature and rainfall.
50
as to be able to use these data and have them compared with those of Cananéia, studies by GARCIA OCCHIPINTI (1963) were considered which relate air/ temperature (regression equation Tw=
1.15 Ta-- 0.55, where T w
=
mean monthJy temperature ofwater in laguna r region (OC);
'fa
=
mean monthly temperature of air in lagunar region (OC).A correlation in the three regions has also been observed both in 1966-67 and as far as we know in previous periods.
The variations of air and water temperature are similar and this may possibly the cause of the simi-larities on the variations of glycogen content, fat and dry matter observed in the oyster from the regions referred to.
The water temperature in Cananéia ranged from 19.4 to 26.5°C from July 1966 to March 1967 and from April to May 1967 as an average and the daily variations were quite elose to those observed by VIL-LELA, 1954; MARTE IN, 1957 and ESTABLIER, 1966 (in:
ESTABLIER, 1966)_
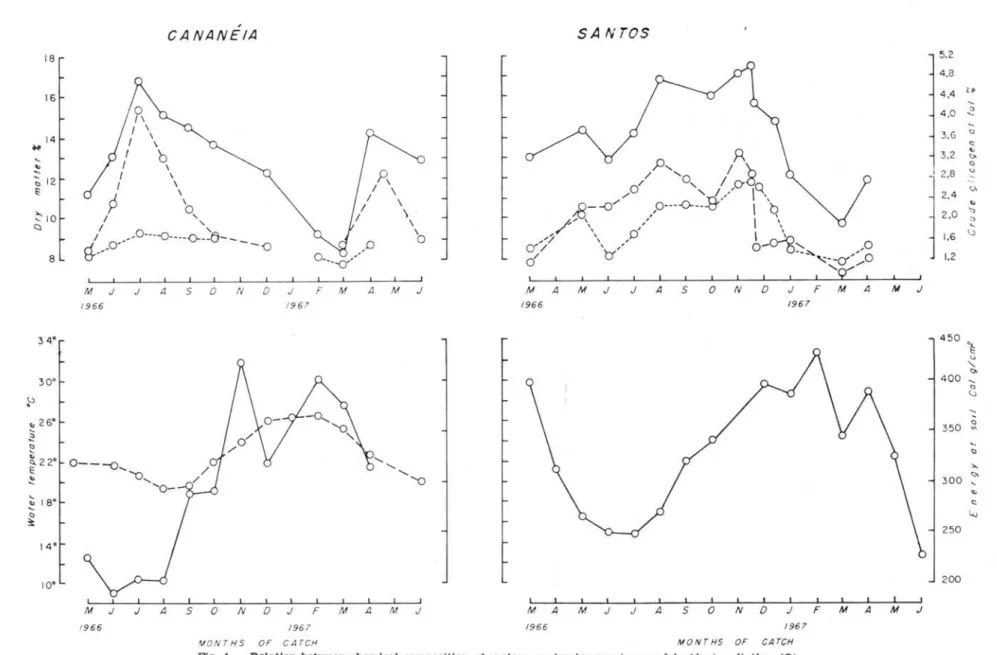
Figure 4 shows the inverse correlation existing between
Q
and t and the glycogen, fat and dry matter content. These three factors are here considered as indicators of the reproductive oyster cycle and the incident radiation (Q) and water temperature (t) thus appear to be the main determinants of the oyster's cycle locally.til
o
13
5'
rn,.
g
~
::r
o
~
Ul
~
~
.Õ
... ...
2
~
00
f!J
f-'
~
00
~
PARANAGUA' 1966- 61
7 0 0
6 0 0
500
4 0 0
::;
~ o
ti 3 00 <>:
200
100
F M A M J J A S O N D J F M A M ./
e---e WA TER TEMPERA fURE T X
0----0 A IR TEMPERATU R[ T X
.... --e W AT[R TEMPERATURE T>
0- - - 0 A/R T[ M PERATUR[ T>
. --- . WATER TEM P ERATU R[ T<
o---{) A fR TEMPERATuRE T<
t::.- - - I J . RA DIA TlON 19~6 - 67
b---~ RAD IATION 1966-6'
500
4 50
400
0--0...'0
,
)946-6/'0,
E 350
E
,
/0,.'0... .D""O
-0 _ 0"'
3 00
~ 250
~ 2 00
~
Q: /50
/00
5 0
n
RAINFALLJ F M A M J J A 5 0 N D J F M A M J
M ON THS aF CATCH
450
4 0 0
~ 350 ,
~
~ 3 00
250
2 0 0
CANA NÉIA 1966-61
~
A
\ / \
\ I).
P \
\
r.
\
h
\
I '
1\
" \ "
,~ '.\ \ I , ... , :' \ '1\, \ '
~
\ (' \.
, '~ \
\ ' .A\ I. 11' \'., .. '.,
\ J' ty ,
~ 'Ti \ ..
\
~--f> ~\.
\ : 1 \ I).
\ ' I \
\}.
U
\
.. \
/'"
\à \ .8 : \..
\, 't. .... /r--I. "\
\, ; \
' I ~ I ' 3>
J F M A M J J S O N D J F M A ',T J
J FMAM J J A S O N D J
M ONTH5 DF CATCH
SA NTOS 1966-61
F MAM J J A S O N D J
~
\.
,.fi'
'l\. ~"' t.._~ ,"
I
"I
,/\
6 " I
/ .... ~ \
/ ' /\ (I
\ ,/
\.
k! \
\
~1 , ! 1 I ! I
J F M A M J J A S O NO ,CM AMJ
J F M A M J
1943-66
o
MONTHS OF CATCH
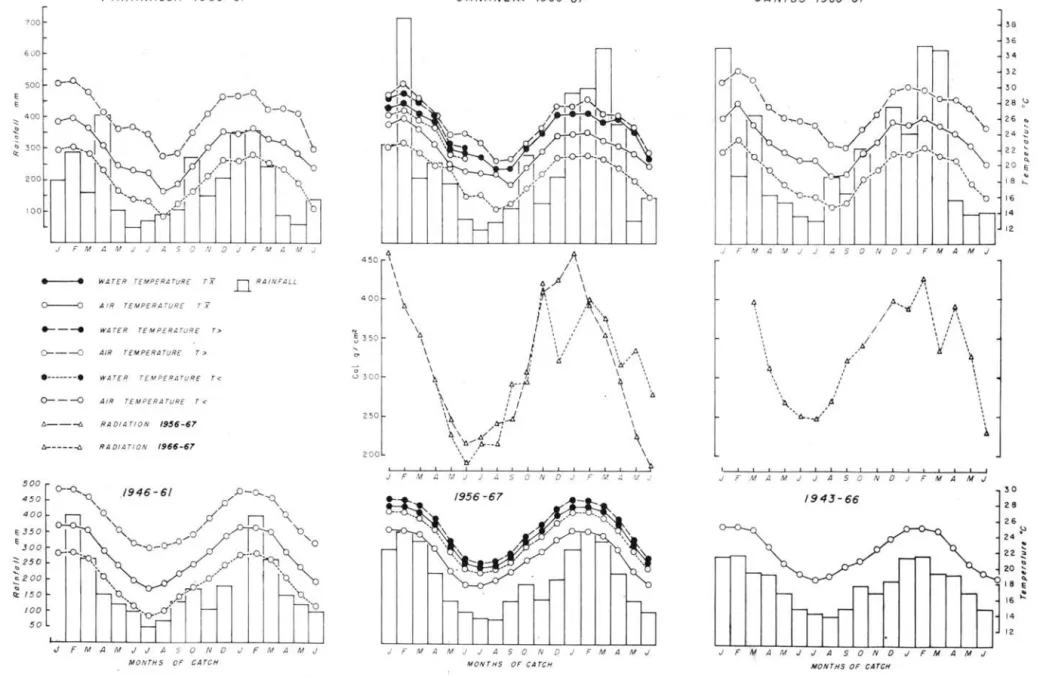
Fig, 3 - Air and water temperatures, rainfa ll a nd radia tion at soiL
30 36
34
H
30 28 ;;.>
26 ~
24 .:
.
22 ~20 ~
18 ::.
16
14
12
30
28
26
<>
24 •
~
22 ~
~
20 ~
"-E
~
b:l
o
§'
!i
[!l-o"
til
P>
::f
o
IIQ
!"' Ul
"é
P>
s::
'9
...
..
2
...}
...
00 .00
...
~
00
18
16
14
..
"-..
" 12
E;
~IO
<:::)
8
34°
30'
.\-'
~ 260
.::
~
..
~ 2 2°
~
"-Q.) 18Q
~
14 °
lO'
o
1\
I \
I \
CANANE/A
I
'o
I \
I \
I ,
P
\C\
I ,
I O----O- --- O--_ô- - __ D
I 0 / '
8>'
M J
/966
J A 5 o N
o
J/ 967
p\
I \ I \
/ \
/ \
0 -
u,.o
---e)"
b
F M A M J
"-
"-'O
SA NTOS
K
jJ, /
8.
/
'
0/ O, / o- Q
,,/'
'ri,/
I
'-,.-8- -()
p---D----o
I b
/ " , , ' .... \ ' I " \
... -'? '\
,o'
\,
\
O' / ' -'
o-o-=g,
,Od
b' --~",-_rv/,v ,,-
O9"',
M A M J J A 5 o N D J F M A M J
/966 /967
I I
J J A
/ 966
5
o
N D J F M A M J M A M J J A 5 0 N D J F M A M , J/96 7 /966 /967
M ON T H5 DF CATCH M ONTH5 DF CATCH
Fig. 4 - Relatlon between chemlcal composition of oysters, water temperature and Incident radiatlon (Q) •
0 - - 0 Dry matter, energy at soi!. 0---0 = Water temperature, crude glycogen .
5.2
4. 8 4.4 1.
4.0 -::
3.6
3,2
"
<:
"
'"
j
-:::
-!
2.0 ""
"
"-1.6 <.o
1.2
45 0
400
'1:
"
"-'"
"
<.o
350 ::::
"
"
'"
300'-<:
Lu
250
T ABLE VI ~ The fractiona tion of nannophytoplank-ton in two different size range net, Phytoplanknannophytoplank-ton
in percent (TEIXEIRA et al, 1967)
~annophy,"-
1965 plankton C-14 Fixation 5,0 - 65,00 p.Surface Depth
February 70.69 56.51
April 82.50 67.92 95,83% maximum reJa-tive fixation
June 62.30 54.48
August 54.39 32.04 64,32% mlnimum rela-tive flxatlon October 89.21 55.00
December 79.60 36 . 89
Filtered in silk (pore slze
=
65 p.) and retained inSM fllter (pore size of 5,00 p.)
Considering the results obtained by TEIXEIRA et ai. (1967), for the region of Cananéia (Tables VI and
VII) one verify correspondence between the increase of phytoplankton, C14 fixation and the acumulation of
energy in oysters, however these data were taken inde-pendently of this work.
CONCLUSIONS
1 - The humidity content of the oysters analyzed here are more comparable to the observations of other authors for the genus Crassostrea than for Ostrea.
2 - The magnesium content was found to be higher than that of calcium, differring from the re-sults obtained by most authors. It agrees with
NEL-50:\' & COULSON, 1939 (in: VINOGRADOV, 1953) who also found a higher magnesium content in C. gigas
from lhe Pacific coast of the United States.
3 - Protein and ash values are in general lower than those found by other investigators.
4 - Trimethylamine oxide (TMO) was present in 19 out of a total of 32 analyses, differring from the observations by NORRIS & BERNOIT, 1945 (in:
DYEH, 1952) who never found TMO in O. japonica
(Pacific Ocean) and by DYER, 1952 in O. virginica
(Atlantic Ocean).
5 - The energetic values were lower than those measured by RUSSELL, 1923 and TULLEY, 1935 (in: KRV ARIC, 1953).
6 - A seasonal vanatlOn for the energetic va-Iues was observed in these oysters being higher in
Bolm Inst. oceanogr. S Paulo, 17 (1) :71-88, 1968
T ABLE VII - Phytoplankton in Cananéia, 1967 (cel/l)
BAtA DE TREP ANDfl
Month Llght Ebb High
penetratlon % tlde tide
March 100 604. 000 1522.400
60 716.400 1691.600 10 1635.300 12570.000 1,5 1798.400 1232.800 0,0 2549.000 1556.400
April 100 334.800 514.800
60 403.200 2128.800 10 170.800 832.400 1,5 170.800 536.000 0,0 590 . 000
May 100 676.800 887.200
60 1306 .000 968.400 10 408.400 828.000 1,5 560.800 966 . 000 0,0 1458.000 930.600
June 100 196 . 800 876 .400
60 354 . 000 1288.400 10 400.400 589.000 1,5 176.000 959 . 000 0,0 396.000 820.800
ILHA DA CASCA, SALVATERRA AND BAtA PEREQUE
Statlon Month Depth Phytoplankton (m) (cel!l)
Ilha da Casca August 0,0 438.400 2,40 844.800 3,75 868.400 8,50 706.000
Salvaterra August 0,0 287.200 1,35 526.000 3,90 416.000 6,00 487.600
Baía Pereque August 0,0 505.800 1,20 284.000 2,30 443.200 6,00 243.200
Ilha da Casca July 0,0 260.800 1,90 345.800 4,95 310.000
Salvaterra July 0,0 345.000 1,80 725.200 4,80 733. 000 Personal comunlcatlon - C. TEIXEIRA et colo (1967),
Instituto Oceanográfico da Universidade de São Paulo.
winter and spring and lower in summer and autumn in agreement with RUSSELL, ' 1923 and TULLEY, 1935
(in: KnvARIc, 1953) and KRVARIC, 1953.
7 - Glycogen, fat content and dry matter vary in a similar manner in relation to weight and dry weight.
8 - Protein showed seasonaJ'. variation in rela--tion to dry matter ana the
variati~n
is opposite to the glycogen and fat variation.9 - Glycogen, total fat and dry matter are relat--('d to the reproductive cycle of the oysters. The fol--lowing periods as proposed hy MATsuMóTo et àl, 1934 ,
(in: WILBUR & YONGE, 1966) may be reported to
our conditions. '
a) Fattening
Paranaguá - July to August 1966 ,- FeQruary to April 1967.
Cananéia - May to July 196q,' Oetober to No--vember 1967 and March to April 1967. Santos - March to May 1966, July to August
1966 and_ March to April 1967.
b) Gonadal ripening
Paranaguá - August to October 1966.
Santos - August to September 1966 - Novem--ber to DecemNovem--ber 1966.
c) Discharge 01 sexual proaucts
Paranàg!1ª ~ May to July 1966 - October to --DeGember 1966 - Janua",f--February 1967,
April to May 1967.
Cananéia - July to March 1'967 - April to July 1967.
SantoS" ~ May to June 1966 - September to '-Üctober 1966. - December to March' 1967.
- - to- - ~ The variations in the reproductive cycle of the glycogen, total fat and dry matter content are related to. water temperature and this' ih, turn i,s relat--ed to solª-!;.radiation. (Q). ' , ,
11 - We noticed an inverse correlation' between solar radia-h-on-{-Q1
·bn
one si de a~d glycogen, fat and dry maher .content of the oysters analy~ed.12 - -'fhe similarity observed, between the yaria--Lions of chemieal canlVdsition of oysters coming lrom Par;:t naguá C-ªºa.néT ~ !ld Santos may be a consequen--ce of similar meteorological factors slich as water and air temperature, ' raintall and solar radiation.
13 - Most probably the chem.ical composition va riation and the reproductive cycle observed in
1966 ~ 6 T , ~Tnflúenced by the meteorologic'al con--ditions prevailing in that period, is representativeof lhe average for each region since the climatologiacI data were representative of the average known for' each.
14 - Oysters have a better food value as ener--getic valu.!( ,and palability during winter and spring.
86
15 - Dry matter value may be used under our conditions as indicative of glycogen and fat content variation and consequently of the reproductive cycle as well.
ACKNOWLEDGEMENTS
Sincere thanks are due to "Pescados Oceania do Brasil Ltda." for yielding us some samples; to Proí. Carlos Ometto, from Escola Superior de Agricultura "Luiz de Queiroz" for data of his papers on insola--tion time, radiainsola--tion received by the soil; to Mr. Luiz Sanchez and Miss Dulcinda Rodrigues da Silva for technicâl help regarding the analysis; to the Meteo--rological Sector of the Brazilian Air Force (Santos and São Paulo); to the Meteorology Division of the Department of Agriculture of the State of Paraná; to the oceanographers, Mrs. Clovis Teixeira and , Jose G. Tundisi from the Oceanographic Institute, University of São Paulo for the original data of their papers; to Dr. Hugo de Souza Lopes, Museu Nacional do Rio de Janeiro; to the oceanographers Mr. Gelso Vazzoler and Mrs. Anna Emília A. de Moraes Vazzo--ler for suggestions and revision of the manuscript; to Dr. Marta Vannucci: for the facilities and stimulation for the fulfilment of this paper.
RESUMO
Durante 1966-1967, foi efetuado um estudo com-parativo da variação da composição química da ostra
(proteína; ' matéria graxa, água, cinza, óxido de trime-tilamina, glicogênio cru, câlcio, magnésio, ferro (Fe+ + +), fósforo total e inorgânico), proveniente de regiÕes lagunares do Estado de São Palllo: Cananéia e Canal da Bertioga (Santos), e do Estado do Paraná: Paranaguá.
A análise dos resultados foi efetuada, levando-se em consideração o ciclo reprodutivo da ostra e as con-dições meteorológicas das três regiões em estudo.
Com base no observado pode-se considerar o seguinte:
1 - Os teores de umidad ec- ~ das ostras ánalisadas , estão mais próximos dos obtidos por outros autôres no gênero Crassostrea do que no gê-nero Ostrea;
2 ---' Os teores de magnésio mais elevados que os de cálcio', divergem da maioria dos dados de outros autôres, concordando somente com os de NELsON & COULSON (1939), para Crassostrea gigas da' costa do Pacífico, Estados Unidos.
3 - Os teores de proteína
e
cinz~s, são em geral mais baixos que os cons'tatados por outros autôres;4 -..:.- Foi constatada em 19 análises, dentre 32, a presença de óxido de trimetilamina (TMO), di-vergindo das observações de ausência total de TMO feita por NORRIS & BERNOIT (1945), para
O. japonica; no Pacífico, e DYER (1952), para
; O. ,y irginicq" , no , Atlântico, únicos que citam ' trabalhos de TMO em ostra;
5 - Os valôres energéticos observados se revelaram mais baixos que os constatados por RUSSEL (1923), TULLEY (1935) e KRVARIC (1953);