MARTA SOFIA NEVES BASTO
THE USE OF STRANDED AQUATIC-ASSOCIATED BIRD
SURVEYS FOR PLASTIC LITTER MONITORING IN
PORTUGAL
UNIVERSIDADE DO ALGARVE
Faculdade de Ciências e Tecnologia
2018
MARTA SOFIA NEVES BASTO
THE USE OF STRANDED AQUATIC-ASSOCIATED BIRD
SURVEYS FOR PLASTIC LITTER MONITORING IN
PORTUGAL
MSc Marine Biology
Supervised by:
Katy Nicastro, PhD (CCMAR)
Gerardo Zardi, PhD (Rhodes University, RU)
UNIVERSIDADE DO ALGARVE
Faculdade de Ciências e Tecnologia
2018
THE USE OF STRANDED AQUATIC-ASSOCIATED BIRD
SURVEYS FOR PLASTIC LITTER MONITORING IN
PORTUGAL
Declaração de autoria do trabalho
Declaro ser a autora deste trabalho, que é original e inédito. Autores e trabalhos consultados estão devidamente citados no texto e constam da listagem de referências incluída. _______________________________________________ (Marta Basto) Copyright © Marta Basto 2018
A Universidade do Algarve reserva para si o direito, em conformidade com o disposto no Código do Direito de Autor e dos Direitos Conexos, de arquivar, reproduzir e publicar a obra, independentemente do meio utilizado, bem como de a divulgar através de repositórios científicos e de admitir a sua cópia e distribuição para fins educacionais ou de investigação e não-comerciais, conquanto seja dado o devido crédito ao autor e editor respectivos.
Agradecimentos
To Dr. Katy Nicastro and Dr. Gerardo Zardi for accepting to guide this work and for all indispensable help. Obrigada à Dra. Filipa Loureiro do Hospital Veterinário da UTAD, à Dra. Vanessa Soeiro do Parque Biológico de Gaia, ao Dr. Ricardo Brandão do CERVAS, à Dra. Filipa Lopes do CERAS e à Dra. Erica Brazio do LxCRAS por terem aceite fazer parte deste projeto, por me terem recebido nos vossos centros e por terem recolhido as amostras sem as quais esta tese não seria possível. Um obrigado muito especial à Dra. María Casero e à restante equipa do RIAS, por me terem recebido tão bem todas as semanas ao logo de vários meses e por me ensinarem todas as ferramentas que precisava.À minha mãe e ao meu irmão, obrigada por terem estado sempre presentes mesmo quando eu não estava, e por todo o apoio incondicional. Muito obrigada à Ana pela amizade, por todas as boleias para o RIAS, pela aventura na nossa tour, boa disposição e bom ambiente de trabalho. À Carla, muito obrigado pela amizade, disponibilidade, boa disposição e ajuda.
À restante equipa do laboratório de Biogeografia, Ecologia e Evolução do Centro de Ciências do Mar pelo excelente ambiente de trabalho, propício à partilha de conhecimentos e entreajuda. To all the friends I met in Faro, that in some way I feel like I have known for so long, thank you for making these two years so much fun even when times were harder and for making Faro more bearable. I will cherish our memories forever, and we made some really good ones. I wish all the best.
Abstract
Plastics durability and persistence, combined with their high production and low rates of recovery, are causing a net accumulation of plastic debris along shorelines, surface waters, throughout the water column and in bottom sediments. Pollution by plastic debris is an increasing environmental concern all around the globe, accounting for up to 90% of marine debris. Wildlife has been severely impacted by plastic debris in coastal and aquatic environments. Macroplastics (> 20 – 100 mm) pose a health risk to several aquatic animals, including fish, turtles and birds, because of possible entanglement and ingestion. When in the environment, macroplastic debris can brittle and break through UV radiation, mechanical action and biodegradation into small sized plastic particles, designated as microplastics (1 – 5 mm), that become more bioavailable to organisms throughout the food web. However, microplastic debris can also reach aquatic environments in their original form that were manufactured for particular industrial or domestic applications, such as plastic particles used in exfoliating facial scrubs, toothpastes and resin pellets used in plastic industry. Birds are top-predators, exposed to all threats affecting these environments and this makes them ideal sentinel organisms for monitoring ecosystem changes.
Considering the knowledge gap existing in southern Europe, in particular in Portugal, about the use of stranded aquatic-associated bird surveys for plastic litter monitoring, this study tries to fill this gap by: (1) set a baseline assessment of the prevalence of plastic litter affecting multispecies populations of aquatic birds in Portugal and (2) test if species, gender, age and condition of the birds influence type and quantity of ingested plastics. In this study, the plastics accumulated in the stomachs of stranded aquatic birds collected across the Portuguese territory will be quantified and characterized.
A total of 310 birds samples comprising four species sourced from five different wildlife rescue centres (Parque Biológico de Gaia, CERVAS, CERAS, LxCRAS and RIAS) were collected and examined for the presence of plastic litter. Of these, 15.48% were found to ingest plastic litter. The average number and mass of ingested plastics was 1.62 items per individuals and 0.0771 g, respectively. Results show that aquatic-associated birds in Portugal do ingest plastic litter, as in many other countries in the world. Monitoring plastic litter ingested by aquatic-associated birds has the potential to be a part
of a wide monitoring programme that can help to inform mitigation and management measures for aquatic litter. _____________________________________________________________________________________________________ Keywords: Plastic debris, Plastic ingestion, Aquatic birds, Multispecies, Portugal
Resumo
À medida que os plásticos se tornaram num produto indispensável no nosso quotidiano, a sua rápida produção tem sido consequentemente acompanhada por um aumento da acumulação de plásticos no meio ambiente. A durabilidade e persistência dos plásticos, combinada com a sua elevada produção e baixas taxas de recuperação, causam a acumulação de detritos plásticos ao longo das costas, águas superficiais, ao longo da coluna de água e sedimentos. A poluição por detritos plásticos é uma crescente preocupação ambiental em todo o mundo, representando cerca de 90% dos detritos marinhos. Devido ao uso excessivo e à eliminação inadequada de produtos plásticos, a vida selvagem tem sido severamente afetada pelos detritos plásticos em ambientes costeiros e aquáticos. Os macroplásticos (> 20 – 100 mm) representam uma ameaça para vários animais aquáticos, incluindo peixes, tartarugas e aves marinhas, devido à possibilidade de enredamento e ingestão. Quando no meio ambiente, os macroplásticos podem fragmentar-se através da radiação UV, ação mecânica e biodegradação em partículas plásticas mais pequenas, designadas de microplásticos (1 – 5 mm). Estas novas partículas tornam-se mais biodisponíveis para todos os organismos da cadeia alimentar e podem libertar substâncias químicas tóxicas durante o processo de degradação. As aves aquáticas são predadores expostos a todas as ameaças que afetam estes ambientes, tornando-os organismos sentinelas ideais para monitorizar mudanças nos ecossistemas. Comparativamente ao Norte da Europa, estudos sobre o uso de aves aquáticas arrojadas para a monitorização do lixo aquático no Sul da Europa são limitados. Em Portugal, particularmente, existe apenas um estudo publicado neste tema na região do Algarve. Sendo assim, este estudo tentará preencher esta lacuna (1) estabelecendo uma avaliação base da presença de lixo plástico que afeta diversas espécies de aves associadas ao meio aquático em Portugal e (2) testando se diferentes espécies, idades, géneros e condição corporal das aves influenciam o tipo e a quantidade de detritos plásticos ingeridos. Neste estudo, os plásticos acumulados no estômago de aves aquáticas arrojadas ao longo da costa Portuguesa foram quantificados e caracterizados. Para tal, amostras das aves foram obtidas de cinco centros de recuperação de animais selvagens diferentes, nomeadamente, Parque Biológico de Gaia, Centro de Ecologia, Recuperação e Vigilância de Animais Selvagens (CERVAS), Centro de Estudos e Recuperação de Animais Selvagens (CERAS), Centro de Recuperação de Animais Silvestres de Lisboa (LxCRAS) e Centro de
Recuperação e Investigação de Animais Selvagens (RIAS). Com os dados das amostras recolhidas foram montados três conjuntos de dados diferentes. O conjunto A incluiu amostras obtidas em todos os centros de recuperação de animais selvagens e foi utilizado para estabelecer uma avaliação base da presença de lixo plástico que afeta diversas espécies de aves associadas ao meio aquático. O conjunto B incluiu apenas amostras recolhidas no centro de recuperação de animais selvagens mais a Sul do país, o RIAS, e foi utilizado para (1) testar o efeito das diferentes idades e géneros na ingestão de plásticos e para (2) determinar se existe uma correlação entre a condição corporal das aves e os detritos plásticos ingeridos. O conjunto C incluiu apenas as cegonhas-brancas (Ciconia
ciconia) recolhidas em todos os centros de recuperação de animais selvagens que
participaram neste estudo e foi utilizado para (1) testar a existência de diferenças no tipo, cor e polímero de plásticos ingeridos por amostras recolhidas no Norte e Sul do país e (2) determinar se a ingestão de plásticos aumentou nos últimos sete anos.
As aves analisadas neste estudo foram necropsiadas de acordo com os protocolos padronizados e os seus estômagos recolhidos. Os respetivos conteúdos estomacais foram lavados sobre um crivo de metal com uma malha de 1 mm, uma vez que malhas mais pequenas ficam facilmente obstruídas com o muco das paredes estomacais e restos de comida. Os plásticos foram contados e classificados segundo protocolos padronizados em plásticos industriais ou plásticos de uso quotidiano/doméstico, que posteriormente foram ainda subdivididos em folha (e.g., sacos plásticos), fios (e.g., cordas, fios de pesca), esponja, fragmentos e outros (e.g., borracha). Os plásticos foram ainda contados e classificados tendo em conta a sua cor nas seguintes categorias: branco (incluindo transparente), preto (incluindo castanho e cinzento), amarelo, verde, vermelho (incluindo cor-de-rosa), azul e mistura. Comprimento máximo (± 1 mm) de cada item plástico foi registado, sendo posteriormente contados e classificados em megaplásticos (> 100 mm), macroplásticos (> 20 – 100 mm), mesoplásticos (> 5 – 200 mm) e microplásticos (1 – 5 mm). O peso total por estômago e o peso por categoria de plástico ao valor aproximado de 0.0001 g foram devidamente registados. No geral, um total de 310 amostras de aves de quatro espécies provenientes dos cinco centros de recuperação de animais selvagens foram recolhidos e analisados para determinar a presença de detritos plásticos. Destes, 15.48% continham detritos plásticos no estômago. O peso médio dos plásticos ingeridos foi de 0.0771 g. Das espécies amostradas, Ciconia ciconia apresentou a maior percentagem de ocorrência (25.86%), no
entanto Larus fuscus apresentou um maior número de detritos plásticos ingeridos quando comparado com as restantes espécies. Os itens plásticos encontrados foram classificados maioritariamente como plásticos de uso quotidiano/doméstico. Em relação à cor os detritos apresentaram cores variadas, tendo sido os detritos de cor branca e preta os mais abundantes.
Os resultados mostram que as aves associadas ao meio aquático em Portugal ingerem detritos plásticos, assim como em muitos outros países do mundo. Existe uma necessidade urgente de padronizar protocolos em Portugal, mas também com estudos de todo o mundo.
A monitorização da ingestão de detritos plásticos por aves associadas ao meio aquático tem potencial para ser parte de um amplo programa de monitorização que pode ajudar a encontrar medidas de mitigação e gestão para detritos presentes no meio aquático. No entanto, é necessário que as instituições governamentais desempenhem um papel ativo, enfrentando este problema através da criação de novas legislações que controlem as fontes de detritos plásticos. As indústrias de plásticos também podem desempenhar um papel importante na redução de detritos plásticos no meio ambiente, uma vez que podiam assumir responsabilidade pelo fim de vida dos seus próprios produtos plásticos, reciclando-os.
A continuação deste tipo de estudos em Portugal é crucial para que se possa obter resultados baseados num maior número de amostras de diferentes espécies e para podermos identificar quais as espécies mais indicadas para monitorizar a presença destes detritos no meio ambiente. Uma vez que a ingestão de plásticos por aves ou outros animais aquáticos têm potenciais efeitos nocivos, torna-se urgente avaliar os efeitos sobre a saúde, particularmente no caso de espécies ameaçadas. _____________________________________________________________________________________________________ Palavras-chave: Detritos plásticos, Ingestão de plásticos, Aves aquáticas, Portugal
Table of contents
Agradecimentos ... i Abstract ... ii Resumo... iv Table of contents ...vii Index of Figures ... ix Index of Tables ... xi List of Abbreviations ... xv 1. Introduction ... 1 1.1. Worldwide plastic production ... 1 1.2. Classification of plastics ... 3 1.3. Origin, presence and impacts of plastic debris in the aquatic environment ... 4 1.4. Use of aquatic birds as indicators of plastic litter ... 10 1.5. Objectives ... 12 1.6. Species of interest ... 13 1.6.1. Alca torda (Razorbill; Linnaeus, 1758) ... 13 1.6.2. Ardea cinerea (Grey Heron; Linnaeus, 1758) ... 13 1.6.3. Bubulcus ibis (Cattle Egret; Linnaeus, 1758) ... 14 1.6.4. Ciconia ciconia (White Stork; Linnaeus, 1758) ... 14 1.6.5. Ciconia nigra (Black Stork; Linnaeus, 1758) ... 15 1.6.6. Egretta garzetta (Little Egret; Linnaeus, 1766) ... 16 1.6.7. Gavia stellata (Red-throated Loon; Pontoppidan; 1763)... 16 1.6.8. Ixobrycus minutus (Common Little Bittern; Linnaeus, 1766) ... 17 1.6.9. Larus argentatus (European Herring Gull; Pontoppidan; 1763) ... 18 1.6.10. Larus audouinii (Audouin’s Gull; Payraudeau, 1826) ... 18 1.6.11. Larus fuscus (Lesser Black-backed Gull; Linnaeus, 1758) ... 19 1.6.12. Larus melanocephalus (Mediterranean Gull; Temmink, 1820) ... 19 1.6.13. Larus michahellis (Yellow-legged Gull; J. F. Naumann, 1840) ... 20 1.6.14. Larus ridibundus (Black-headed Gull; Linnaeus, 1766) ... 201.6.15. Melanita nigra (Common Scoter; Linnaeus, 1758) ... 21 1.6.16. Morus bassanus (Northern Gannet; Linnaeus, 1758)... 22 1.6.17. Phalacrocorax carbo (Great Cormorant; Linnaeus, 1758) ... 22 1.6.18. Platalea leucorodia (Eurasian Spoonbill; Linnaeus, 1758) ... 23 1.6.19. Rissa tridactyla (Black-legged Kittiwake; Linnaeus, 1758) ... 24 2. Materials and Methods ... 25 2.1. Sampling ... 25 2.2. Dissections... 26 2.3. Statistical analysis... 30 3. Results ... 32 3.1. Dataset A ... 32 3.2. Dataset B... 39 3.3. Dataset C ... 52 4. Discussion ... 63 5. Final remarks ... 69 6. Bibliography ... 70 Supplemental material ... 84
Index of Figures
Figure 1.1: Worldwide and European plastic production between 1950 and 2016 (adapted from PlasticsEurope, 2013, 2015, 2016, 2017). ... 2 Figure 1.2: Flow chart describing inputs of plastics into the marine environment, beginning with the manufacture of common plastic resins in the form of industrial pellets. The lowest level shows direct sources to the marine environment; blue shading indicates sources from marine activities, red indicates sources from land activities and purple indicates sources from either maritime or land activities (Law, 2016). ... 7 Figure 2.1: Points represent the five wildlife rescue centres that collaborated in this study. ... 25 Figure 2.2: Initial skin incision in the dissection, from over the breastbone to near the cloaca. After this incision, body condition was scored based on the condition of the pectoral muscle, which is assessed by its palpation. ... 28 Figure 2.3: (A) Example of a stomach content of a Larus michahellis. All subcategories of user plastics (sheetlike, threadlike, foamed, fragment and others) were retrieved in this sample. (B) Example of how the items were sorted, photographed and measured to the maximum length (± 1 mm) using a grid paper. ... 30 Figure 3.1: Percentage frequency of occurrence (% FO) of plastic litter in the stomach of four aquatic birds’ species. ... 32 Figure 3.2: Principal coordinate analyses (PCO) based on plastic composition among age groups (dataset B). Black vector overlays represent Pearson’s correlation coefficients of the dependent variables against the PCO axes. Vector length indicates strength of correlation. The size and position of origin (centre) of the circle is arbitrarily assigned with respect to the underlying plot. ... 46 Figure 3.3: Principal coordinate analyses (PCO) based on plastic composition among age classes (dataset B). Superimposed black vectors represent Pearson’s correlation coefficient of the dependent variables against the PCO axes. Vector length indicates strength of correlation. The circle size and position of origin (centre) is arbitrarily assigned with respect to the underlying plot. ... 47 Figure 3.4: Principal coordinate analyses (PCO) based on plastic composition between genders (dataset B). Overlaid black vectors represent Pearson’s correlation coefficients
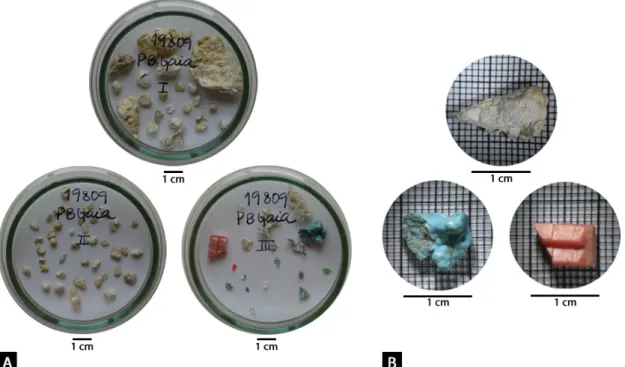
vector length. The size and position of origin (centre) of the circle is arbitrarily assigned with respect to the underlying plot. ... 48 Figure 3.5: Principal coordinate analyses (PCO) based on plastic composition between genders (dataset B). Black vectors overlaid represent Pearson’s correlation coefficients of the dependent variables against the PCO axes. Vector length indicates strength of correlation. The size and position of origin (centre) of the circle is arbitrarily assigned with respect to the underlying plot. ... 49 Figure 3.6: Relation between body condition of the bird and the amount (A) and total mass (B) of plastics ingested. ... 50 Figure 3.7: Principal coordinate analyses (PCO) based on plastic composition between regions (dataset C). Superimposed black vectors represent Pearson’s correlation coefficient of the dependent variables against the PCO axes. Vector length indicates strength of correlation. The circle size and position of origin (centre) is arbitrarily assigned with respect to the underlying plot. ... 57 Figure 3.8: Principal coordinate analyses (PCO) based on plastic composition between regions (dataset C). Overlaid black vectors represent Pearson’s correlation coefficients of the dependent variables against the PCO axes. Correlation strength is indicated by thee vector length. The size and position of origin (centre) of the circle is arbitrarily assigned with respect to the underlying plot. ... 58 Figure 3.9: Principal coordinate analyses (PCO) based on plastic composition between regions (dataset C). Overlaid black vectors represent Pearson’s correlation coefficients of the dependent variables against the PCO axes. Correlation strength is indicated by the vector length. The size and position of origin (centre) of the circle is arbitrarily assigned with respect to the underlying plot. ... 59 Figure 3.10: Trends over time in (A) number and (B) total mass of plastic items for Ciconia ciconia over the period 2010 – 2017. ... 60 Figure 4.1: Example of a stomach content of an adult specimen of Ciconia ciconia. Three of the five subcategories of user plastics (sheetlike, fragment and others) were retrieved. The more elongated plastics may resemble a living prey, such as earthworms. ... 65
Index of Tables
Table 1.1: Density range of the most common polymers of environmental relevance (Avio et al., 2016). ... 4 Table 1.2: Average concentration of floating plastic debris reported around the globe. .. 5 Table 1.3: Studies demonstrating evidence of plastic debris entanglement by marine organisms... 8 Table 1.4: Studies demonstrating evidence of plastic ingestion by marine wildlife... 9 Table 2.1: Sample description. Male (M) or female (F), chick (C), juvenile (J), sub-adult (S-A) or adult (A). Note that gender and/or age could not always be determined. ... 27 Table 3.1: Data on the plastics ingested by Ciconia ciconia (n = 58) based on plastics categories. Frequency of occurrence of plastics (with Jeffery’s nominal 95% confidence intervals – CI) and plastic litter abundance. Abundance was calculated including all individuals sampled (affected and non-affected). ... 33 Table 3.2: Data on the plastics ingested by Larus fuscus (n = 107) based on plastics categories. Frequency of occurrence of plastics (with Jeffery’s nominal 95% confidence intervals – CI) and plastic litter abundance. Abundance was calculated including all individuals sampled (affected and non-affected). ... 34 Table 3.3: Data on the plastics ingested by Larus michahellis (n = 124) based on plastics categories. Frequency of occurrence of plastics (with Jeffery’s nominal 95% confidence intervals – CI) and plastic litter abundance. Abundance was calculated including all individuals sampled (affected and non-affected). ... 35 Table 3.4: Data on the plastics ingested by Morus bassanus (n = 21) based on plastics categories. Frequency of occurrence of plastics (with Jeffery’s nominal 95% confidence intervals – CI) and plastic litter abundance. Abundance was calculated including all individuals sampled (affected and non-affected). ... 36 Table 3.5: Characterization of the plastics (size and colour) found in the seven species in study. ... 37 Table 3.6: PERMANOVA results of the model computed to test for differences in the number of plastic debris ingested among four different species (i.e., Ciconia ciconia, Larus fuscus, Larus michahellis and Morus bassanus). Significance level was set as < 0.05. ... 38
Table 3.7: PERMANOVA results of the model computed to test for differences in the total mass of plastic debris ingested among four different species (i.e., Ciconia ciconia, Larus fuscus, Larus michahellis and Morus bassanus). Significance level was set as < 0.05. ... 39 Table 3.8: Data on the plastics ingested by Ciconia ciconia (n = 10) based on plastics categories. Frequency of occurrence of plastics (with Jeffery’s nominal 95% confidence intervals – CI) and plastic litter abundance. Abundance was calculated including all individuals sampled (affected and non-affected). ... 41 Table 3.9: Data on the plastics ingested by Larus fuscus (n = 68) based on plastics categories. Frequency of occurrence of plastics (with Jeffery’s nominal 95% confidence intervals – CI) and plastic litter abundance. Abundance was calculated including all individuals sampled (affected and non-affected). ... 42 Table 3.10: Data on the plastics ingested by Larus michahellis (n = 96) based on plastics categories. Frequency of occurrence of plastics (with Jeffery’s nominal 95% confidence intervals – CI) and plastic litter abundance. Abundance was calculated including all individuals sampled (affected and non-affected). ... 43 Table 3.11: Data on the plastics ingested by Morus bassanus (n = 18) based on plastics categories. Frequency of occurrence of plastics (with Jeffery’s nominal 95% confidence intervals – CI) and plastic litter abundance. Abundance was calculated including all individuals sampled (affected and non-affected). ... 44 Table 3.12: Characterization of the plastics (size and colour) found in the seven species in study. ... 45 Table 3.13: PERMANOVA results of the model computed to test for differences on the number of plastic debris ingested among four different age classes (i.e., chick, juvenile, sub-adult and adult). Significance level was set as < 0.05. ... 51 Table 3.14: PERMANOVA pairwise test for the significant main effect age in Table 3.13. ... 51 Table 3.15: PERMANOVA results of the model computed to test for differences on the total mass of plastic debris ingested among four different age classes (i.e., chick, juvenile, sub-adult and adult). Significance level was set as < 0.05. ... 51 Table 3.16: PERMANOVA results of the model computed to test for differences on the number of plastic debris ingested between genders. Significance level was set as < 0.05. ... 51
Table 3.17: PERMANOVA results of the model computed to test for differences on the total mass of plastic debris ingested between genders. Significance level was set as < 0.05. ... 51 Table 3.18: PERMANOVA results of the model computed to test for differences in the type of plastic debris ingested among three different age classes (i.e., juvenile, sub-adult and adult). Significance level was set as < 0.05. ... 52 Table 3.19: PERMANOVA results of the model computed to test for differences in the colour of plastic debris ingested among three different age classes (i.e., juvenile, sub-adult and adult). Significance level was set as < 0.05. ... 52 Table 3.20: PERMANOVA results of the model computed to test for differences in the type of plastic debris ingested between genders. Significance level was set as < 0.05. ... 52 Table 3.21: PERMANOVA results of the model computed to test for differences in the colour of plastic debris ingested between genders. Significance level was set as < 0.05. 52 Table 3.22: Data on the plastics ingested by Ciconia ciconia from northern regions (n = 47) based on plastics categories. Frequency of occurrence of plastics (with Jeffery’s nominal 95% confidence intervals – CI) and plastic litter abundance. Abundance was calculated including all individuals sampled (affected and non-affected). ... 53 Table 3.23: Data on the plastics ingested by Ciconia ciconia from southern regions (n = 11) based on plastics categories. Frequency of occurrence of plastics (with Jeffery’s nominal 95% confidence intervals – CI) and plastic litter abundance. Abundance was calculated including all individuals sampled (affected and non-affected). ... 54 Table 3.24: Characterization of the plastics (size and colour) found in the Ciconia ciconia from northern and southern regions... 55 Table 3.25: PERMANOVA results of the model computed to test for differences in the incidence of plastic debris ingested between regions. Significance level was set as < 0.05. ... 61 Table 3.26: PERMANOVA results of the model computed to test for differences in the total mass of plastic debris ingested between regions. Significance level was set as < 0.05 .... 61 Table 3.27: PERMANOVA results of the model computed to test for differences in the type of plastic debris ingested between regions. Significance level was set as < 0.05. ... 61 Table 3.28: PERMANOVA results of the model computed to test for differences in the colour of plastic debris ingested between regions. Significance level was set as < 0.05.. 61
Table 3.29: Characterization of the plastic polymers found in Ciconia ciconia species from North and South regions. Abbreviations stand for the polymers found, namely polydimethylsiloxane (PDMS), polystyrene (PS), polyethylene (PE), polyamide (PA) and polypropylene (PP). ... 61 Table 3.30: PERMANOVA results of the model computed to test for differences in the polymer of plastic debris ingested between regions. Significance level was set as < 0.05. ... 62 Table S 1: Detailed sample description. ... 84 Table S 2: Sample description of dataset A. Male (M) or female (F), chick (C), juvenile (J), sub-adult (S-A) or adult (A). Note that gender and/or age could not always be determined. ...112 Table S 3: Sample description of dataset B. Male (M) or female (F), chick (C), juvenile (J), sub-adult (S-A) or adult (A). Note that gender and/or age could not always be determined. ...112 Table S 4: Sample description of dataset C. Male (M) or female (F), chick (C), juvenile (J), sub-adult (S-A) or adult (A). Note that gender and/or age could not always be determined. ...113
List of Abbreviations
WRC – Wildlife rescue centre PBGaia – Parque Biológico de Gaia CERVAS – Centro de Ecologia, Recuperação e Vigilância de Animais Selvagens CERAS – Centro de Estudos e Recuperação de Animais Selvagens LxCRAS – Centro de Recuperação de Animais Silvestres de Lisboa RIAS – Centro de Recuperação e Investigação de Animais Selvagens ATR – Attenuated total reflectance CC – Ciconia ciconia LF – Larus fuscus LM – Larus michahellis MB – Morus bassanus PP – Polypropylene PE – Polyethylene PE-HD – High-density polyethylene PE-LD – Low-density polyethylene PVC – Polyvinyl chloride PUR – Polyurethane PET – Polyethylene terephthalate PVA – Polyvinyl alcohol PS – Polystyrene PDMS – Polydimethylsiloxane PA – Polyamide POPs – Persistent organic pollutants UV – Ultraviolet radiation BPA – Bisphenol A PBDEs – Polybrominate diphenyl ethers PCBs – Polychlorinated biphenyl DDT – DichlorodiphenyltrichlorethaneOSPAR – Oslo/Paris Convention for the Protection of the Marine Environment of the North-East Atlantic
1. Introduction
1.1. Worldwide plastic production
Plastics benefits, including its versatility, resistance and durability to degradation (Avio et al., 2016), led to the current period of human history referred as the Plastic Age (Yarsley and Couzens, 1945). However, the extreme use and inappropriate disposal of plastic products are leading to a visible accumulation of plastic debris (Barnes et al., 2009).
Plastics are composed of more than twenty families of polymers, six of which are referred to as “big six”, and include polypropylene (PP), high- and low-density polyethylene (PE-HD and PE-LD), polyvinyl chloride (PVC), polyurethane (PUR), polyethylene terephthalate (PET) and polystyrene (PS), which together account for over 90% of European plastic production (PlasticsEurope, 2015). Because only a small portion of plastic is recycled and because plastic debris fragments and degrades at a very slow rate, these polymers tend to accumulate the most in all types of environments, especially in aquatic ones (Andrady, 2011; Dehaut et al., 2016; Engler, 2012). Pollution by plastic debris is an increasing environmental concern all around the globe. Since the 1950s, global plastic production is increasing exponentially with a current doubling time of 11 years, going from 1.7 million tonnes in 1950 to 335 million tonnes in 2016 (Figure 1.1; Law, 2016; PlasticsEurope, 2013, 2015, 2016, 2017; Wilcox et al., 2015).
Figure 1.1: Worldwide and European plastic production between 1950 and 2016 (adapted from PlasticsEurope, 2013, 2015, 2016, 2017).
In 2016, right after the largest plastic producer (China, contributing with 29% of the world’s total production), Europe was the second largest plastic producer, accounting for 19% of the world’s total production, corresponding to 60 million tonnes of plastic produced in that year (PlasticsEurope, 2017). In the same year, the European plastic industry gave direct employment to over 1.5 million people, generating almost 30 billion euros to public finances and welfare (PlasticsEurope, 2017), approximately 2.5 billion euros more than the previous year. The largest plastic producers were the packaging sector (39.9%) followed by building and construction (19.7%), other market sectors (16.7%; includes appliances, mechanical engineering, furniture, medical, etc.), automotive (10%), electrical and electronic (6.2%), household, leisure and sports (4.2%) and agriculture (3.3%; PlasticsEurope, 2017).
Since plastics became a product present in our daily life, its rapid growth in production has been accompanied by a consequent increase in the concentration of plastics in marine and coastal environments, such as beaches, waterways, estuaries, lakes, coral reefs, the open as well as deep sea (Barnes et al., 2009; Cózar et al., 2014; Donohue et al., 2001; Free et al., 2014; Lima et al., 2014; Moore and Phillips, 2011; Moore et al., 2011; Thompson et al., 2004; Van Cauwenberghe et al., 2013). 0 50 100 150 200 250 300 350 400 450 1950 2002 2004 2007 2009 2011 2012 2013 2014 2015 2016 Mt on ne Year
1.2. Classification of plastics
Plastic debris can be classified according to size, origin, shape and composition (Driedger et al., 2015). The most commonly used size categories include mega- (> 100 mm), macro- (>20 – 100 mm), meso- (5 to 20 mm) and microplastics (< 5 mm; Romeo et
al., 2015; Ryan et al., 2009; Sanchez et al., 2014); however a globally accepted definition
does not exist (Provencher et al., 2017), and thus finding a standard classification of size categories has been a recent research priority (Morét-Ferguson et al., 2010; Vegter et al., 2014). Provencher et al. (2017) advocates the use of the size categories proposed by Barnes et al. (2009) as the most relevant and applicable as includes extra-large sizes of plastics that are usually ingested by marine megafauna (i.e., marine mammals, turtles and seabirds). This classification includes megaplastics (> 100 mm), macroplastics (> 20 – 100 mm), mesoplastics (> 5 – 20 mm) and microplastics (1 - 5 mm; Barnes et al., 2009). Plastic debris can be classified as either primary or secondary. Primary plastics are those that, when collected, are in their original or close-to-original form, such as bottle caps, cigarette butts, microbeads, plastic pellets or synthetic clothing fibres (Chang, 2015; Mato et al., 2001; Napper et al., 2015; van Wezel et al., 2015; Wagner et al., 2014). Secondary plastics results from the breakdown of primary debris through several environmental degradation processes (Browne et al., 2007; Cole et al., 2011; Shah et al., 2008; Thompson et al., 2004; Wagner et al., 2014). In addition to the recognizable plastic objects, plastic debris can exhibit a different range of shapes and are thus classified in sheetlike (i.e., plastic bags, foils and clingfilm), threadlike (i.e., remains of ropes, nets, nylon line, packaging straps, etc.), foam (i.e., foamed polystyrene cups, packaging, construction foams), fragments (i.e., bottles, boxes, toys, toothbrushes, etc.) and others (i.e., cigarette filters, rubber, elastics, etc.; Van Franeker et al., 2011).
In terms of composition, there are many typologies of plastic polymers and additives that can be combined in objects with specific properties and characteristics (Avio et al., 2016). The most common polymers are polyethylene (PE), polypropylene (PP), polystyrene (PS), polyvinylchloride (PVC), polyamide (PA), polyethylene terephthalate (PET) and polyvinyl alcohol (PVA; Avio et al., 2016). When in the ocean, their consequence in the environment will depend on the polymer density (Table 1.1), which will determine their buoyancy and consequently their position in the water column and their potential to affect biota (Wright et al., 2013). Polymers denser than seawater (i.e., PVC) will tend to sink, while polymers with lower density (i.e., PE and PP) will tend
to float in the water column (Avio et al., 2016; Driedger et al., 2015). Furthermore, buoyancy can be affected by processes such as biofouling and the colonization of organisms on plastics surface that increases the weight of particles, thus accelerating their sinking on bottom sediments (Lobelle and Cunliffe, 2011; Ye and Andrady, 1991); in addition, other factors such as degradation, fragmentation and leaching of additives can also interfere with plastic density, and hence, alter plastics distribution in the water column (Avio et al., 2016). Table 1.1: Density range of the most common polymers of environmental relevance (Avio et al., 2016). Matrix Density (g/cm3) Distilled water 1 Seawater 1.025 Polyethylene (PE) 0.93 – 0.98 Polypropylene (PP) 0.89 – 0.91 Polystyrene (PS) 1.04 – 1.11 Polyvinylchloride (PVC) 1.20 – 1.45 Polyamide (PA) 1.13 – 1.5 Polyethylene terephthalate (PET) 1.38 – 1.39 Polyvinyl alcohol (PVA) 1.19 – 1.35
1.3. Origin, presence and impacts of plastic debris in the aquatic
environment
Aquatic litter (or aquatic debris) comprises any manufactured or processed solid material that was discarded or transported into any aquatic environment, as well as glass, metals, paper, textiles, wood, rubber and plastics. Several of these materials may be promptly biodegradable (i.e., paper, wood or natural fibres), while others remain for long periods of time in the marine or any other aquatic environment. When compared to other materials, plastics are unique since they are both persistent (resistant to biodegradation) and, because of their light weight, readily transportable by wind and water (Law, 2016). In 1972, the first observations of microplastic pollution in marine ecosystems was recorded (Carpenter et al., 1972). Recently, it was estimated that at least 8 million tonnes of plastic enter in the oceans every year (Jambeck et al., 2015), comprising 90% of the marine litter (Barnes et al., 2009; Derraik, 2002; Galgani et al., 2015; Rios et al., 2007). Between 7000 and 250,000 tonnes of plastics are estimated to occur on surface waters (Cózar et al., 2014; Eriksen et al., 2014), in the water column (Lattin et al., 2004) and in
seabed sediments (Fischer et al., 2015; Fries et al., 2013; Van Cauwenberghe et al., 2013). High concentrations of floating plastic debris have been reported in central areas of North Atlantic (Law et al., 2010) and Pacific Oceans (Eriksen et al., 2013b; Goldstein et al., 2012), indicating that plastic pollution can reach even the most remote areas of the planet (Table 1.2; Cózar et al., 2014). These models predict that these large-scale vortices act as conveyor belts, collecting the floating plastic debris released from the continents and accumulating it into central convergence zones (Cózar et al., 2014).
Table 1.2: Average concentration of floating plastic debris reported around the globe.
Location Region Average
concentration Plastic type Reference Atlantic Ocean North Sea 1.6 ± 0.4
items/Ha Macroplastics Galgani et al. (2000)
Portuguese
coast 0.02 – 0.04 items/m3
Microplastics Frias et al. (2014)
Celtic sea 2.46 items/m3 Macroplastics
and microplastics Lusher et al. (2014) Pacific Ocean North Pacific Centre gyre 334.271 items/Km2 Macroplastics and microplastics Moore et al. (2001) South Pacific subtropical gyre 26,898 items/Km2 Macroplastics and microplastics Eriksen et al. (2013b) East China Sea 0.167 ± 0.138 items/m3 - Moore et al. (2002) Mediterranean Sea - 0.243 items/m2 - Cózar et al. (2015) The United
States Laurentian Great Lakes 43,000 items/Km2
Macroplastics and microplastics Eriksen et al. (2013a)
However, not only marine environments are contaminated by plastics; in Singapore, microplastics were extracted from seven intertidal mangrove sediments, where microplastics concentrations ranged from 12.0 to 62.7 particles per Kg of dry sediment, fibres were the most common plastic shape found and PE and PP the polymer types encountered (Nor and Obbard, 2014). The presence of microplastics, more specifically PE microbeads (0.40 – 2.16 mm in diameter), were reported in the sediments of the St. Laurence River with a mean density of 13 832 (± 13 667) microbeads/m2
(Castañeda et al., 2014). In South Africa, five estuaries along the Durban coastline were analysed for the presence of plastics in their sediments. Plastics were found in all study sites, although three (Durban harbour with 159.9 ± 271.2 particles per 500 mL, Isipingo with 47.6 ± 22.8 particles per 500 mL and uMgeni with 41.7 ± 23.0 particles per 500 mL) presented higher concentrations of plastics compared to the other two (Mdloti with 19.9 ± 16.2 particles per 500 mL and iLovu with 13.7 ± 5.6 particles per 500 mL), being fragments and fibres the main plastic shapes found (Naidoo et al., 2015). In Italy, the Lagoon of Venice was a target of study for the identification, distribution and abundance of microplastic particles, where total abundances ranged from 2175 to 672 particles per Kg of dry weight, with higher concentrations observed mostly in landward sites. PE and PP were the most frequent polymers found (Vianello et al., 2013). Portugal is no exception, plastics are the most predominant type of floating debris in our offshore waters (Barnes et al., 2009; Dixon and Dixon, 1983; Thiel et al., 2011; Thiel et al., 2013) and has been described as the main type of marine debris covering the sea bottom and submarine canyons, as well as deposited on beaches (Mordecai et al., 2011; Neves, 2013; OSPAR, 2007). For example, microplastic debris were found in almost 56% of sediment samples from the southern Portuguese shelf waters, being the majority microfibers, identified as rayon fibres, and fragments, identified as PP (Frias et al., 2016). Along the western coast of Portugal, sediment was sampled in five beaches and a total amount of 17799 plastic debris were collected with an average density of 185.1 items/m2.
The plastic particles size ranged from 50 µm to 20 cm, but the majority were microplastics (< 5 mm; Martins and Sobral, 2011).
The main inputs of plastics into the sea derive from beaches and land-based sources, such as rivers, storm water runoff, wastewater discharges or transport of land litter by wind (Ryan et al., 2009). Marine activities also contribute by introducing materials that are lost by professional and recreational fishing, and debris dumped by commercial, cruise or private ships (Figure 1.2; Cooper and Corcoran, 2010). In Continental Portugal, land sources comprise river discharges and coastal urban centres while marine sources include fisheries and recreational maritime activities (Neves, 2013), commercial vessels and cruise ships (Martins and Sobral, 2011).
Figure 1.2: Flow chart describing inputs of plastics into the marine environment, beginning with the manufacture of common plastic resins in the form of industrial pellets. The lowest level shows direct sources to the marine environment; blue shading indicates sources from marine activities, red indicates sources from land activities and purple indicates sources from either maritime or land activities (Law, 2016).
Plastic accumulation in aquatic environments in general has several consequences. From an economic perspective, aquatic litter can interfere with subsistence fishing practices, causing changes in those practices and potential income (Nash, 1992). Ecotourism can be negatively affected as well, by creating unappealing coastal land and seascapes (Gregory, 1999; Jang et al., 2014). Plastic contamination is a major cost for local and regional governments, since clean-up actions are extremely costly, reaching millions of dollars a year (Mouat et al., 2010; UNEP, 2014; Vegter et al., 2014).
Because of possible entanglement and ingestion, plastics pose a health risk to a variety of aquatic animals, including fish, turtles and birds (Table 1.3 and Table 1.4; Boerger et al., 2010; Codina-García et al., 2013; Gregory, 2009; Laist, 1997; Sheavly and Register, 2007). Entanglement can cause injuries, drowning, suffocation, reduced ability to predate and increase the probability of being caught (Derraik, 2002; Gall and Thompson, 2015; Laist, 1997). The most common encounter material reported are fishing materials, originated from fishing activities or cargo ships (Gilardi et al., 2010; Kiessling, 2003; Macfadyen et al., 2009), being more than 6.4 tonnes of fishing gear abandoned or lost each year in the sea (Macfadyen et al., 2009). Most nets are made from synthetic materials, since they are cheaper, more durable and more lightweight, however, when eventually unusable and lost, they continue to indiscriminately entangle marine
organisms (Gilardi et al., 2010). Sea turtles are probably the most susceptible species to “ghost netting” as they often use floating objects for either shelter to avoid predation or as foraging stations (White, 2006), showing that entanglement incidence for certain species can be linked to behavioural strategies (Derraik, 2002). Ingestion of plastic debris are physical hazards to the organism that ingest them (Fendall and Sewell, 2009), since they may cause bleeding, blockage of the digestive tract, ulcers or perforations and produce a deceptive satiation feeling, causing the organism not to feed, and consequently leading to starvation (Derraik, 2002; Ryan, 1988a; Ryan, 1988b; Wright et al., 2013). In some species, ingestion is reported in over 80% of a population sampled (i.e., Murray and Cowie, 2011; Van Franeker et al., 2011), for example, 95% of 1,295 beached seabird (Northern Fulmar, Fulmarus glacialis) carcasses in the North Sea contained plastic in their stomach contents (Van Franeker et al., 2011).
Table 1.3: Studies demonstrating evidence of plastic debris entanglement by marine organisms.
Species Location Entanglement rate
(%) Reference Northern gannets Spanish Iberia and Mauritania 0.93% Rodríguez et al. (2013) Seals, sea lions, gulls, fulmars and turtles United States - Moore et al. (2009)
Gorgonians Azores, Portugal - Pham et al. (2013)
New Zealand fur
seals Cape Gantheaume, Kangaroo Island 0.73% Page et al. (2004) Australian sea lions Seal Bay, Kangaroo Island 0.83% Page et al. (2004)
Table 1.4: Studies demonstrating evidence of plastic ingestion by marine wildlife.
Species Location Percentage frequency
of occurrence (%) Reference
Seabirds Ireland 0% Acampora et al.
(2016)
Seabirds Catalan coast,
Mediterranean 96% Codina-García et al. (2013)
Sea turtles Mediterranean 37% Revelles et al.
(2007)
Fishes English Channel 36.5% Lusher et al.
(2013) Blue mussel North Sea, Germany - De Witte et al. (2014) True’s beaked whales North and West coast of Ireland 85% Lusher et al. (2015) Zooplankton Portuguese coastal waters 61% Frias et al. (2014) Once in the environment, plastic debris get exposed to ultraviolet (UV) radiation, mechanical weathering and biodegradation, and they brittle and brake into smaller particles (Andrady, 2011). These particles can release toxic chemicals during the degradation process that were initially incorporated during manufacturing or adsorbed to their surfaces while in the environment (Driedger et al., 2015). Some of these chemicals includes persistent organic pollutants (POPs), such as phthalates, nolyphenols, bisphenol A (BPA), polybrominated diphenyl ethers (PBDEs; Bittner et al., 2014; Mato et al., 2001; Rios et al., 2010; Teuten et al., 2007; Zarfl and Matthies, 2010), and heavy metals (Ashton et al., 2010; Cheng et al., 2010; Holmes et al., 2012; Nakashima et al., 2011), which can disrupt endocrine functions and cause harmful reproductive and developmental effects in aquatic animals (Meeker et al., 2009). The biodegradation of these POPs has been shown to slow down when these are adsorbed on plastics, increasing their persistence in the environment (Teuten et al., 2009).In the Portuguese coast, PCBs (0.02 – 15.56 ng g-1)
and DDT (0.16 – 4.5 ng g-1) have been found on plastic pellets (Frias et al., 2010). As plastic
particles become smaller, they also become available for organisms throughout the food web (Andrady, 2011; Boerger et al., 2010; Fossi et al., 2012; Teuten et al., 2009). Although direct transfer of plastic-sorbed toxins to organisms through oral ingestion has been shown (i.e., Rochman et al., 2013; Ryan et al., 1988), how and if this also occurs in humans is still largely unknown (Driedger et al., 2015). Plastic debris can also transport
non-native species (Barnes, 2002; Barnes et al., 2009; Gregory, 2009) and be colonized my microbes including possible pathogens (Wagner et al., 2014; Zettler et al., 2013). The accumulation of sinking plastic debris and dragging of fish nets in the littoral zones, may disrupt bottom sediments, displace or smother infauna, eventually affecting the structure and functioning of benthic communities (Goldberg, 1994). In coastal areas, plastic accumulation can avert recreational usage, pose a threat to swimmers and divers and carry a risk of cuts or abrasion injuries to beach-goers (Sheavly and Register, 2007). Since tourists use beach cleanliness as a dominant factor in selecting recreational destinations, plastic debris can reduce income generated from tourism due to forced beach closers (Jeftić et al., 2009). Macroplastic debris represents a navigational and structural hazard to shipping vessels and small marine vehicles, including burnt out water pumps and entangled propellers (Mouat et al., 2010). Abandoned fish nets and other plastic gear may trap commercial fish unintentionally, hence removing them from the pool available for harvest (Gregory, 2009).
1.4. Use of aquatic birds as indicators of plastic litter
Because plastic litter present in aquatic environments can be positively buoyant, aquatic predators are susceptible to ingest plastic debris while feeding on surface waters (Baulch and Perry, 2014). Although plastic ingestion and entanglement has been documented in over 100 species of aquatic animals (Laist, 1997), aquatic birds, more specifically seabirds, have been recognised as a useful indicator, or sentinel species, for aquatic pollution within both scientific literature and though existing policy (OSPAR, 2008; Van Franeker et al., 2011). This recognition as valuable indicators is firstly because they are wide-ranging foragers, they occupy a high-trophic position (predators), they breed at specific locations that are relatively easy to access for study purposes and show large scale distributions (Burger and Gochfeld, 2004; Furness and Camphuysen, 1997; Piatt et al., 2007; Provencher et al., 2014a; Robards et al., 1997; Ryan, 2008). Secondly, several species feed mostly on prey that may also be consumed by humans, such as numerous epipelagic fish and cephalopods, emphasizing the potential usefulness of aquatic birds as sentinels of aquatic contamination (Roscales et al., 2011). Lastly, aquatic birds can often be retrieved dead on beaches and are thus sampled with relatively little collection effort (Van Franeker et al., 2011).
At least 50% of all aquatic bird species are known to be affected by aquatic plastic litter (Kü hn et al., 2015), and it has been predicted that by 2050, 99% of all aquatic bird species and 95% of individuals will have ingested plastic debris (Wilcox et al., 2015). In waters from the North Hemisphere and around South America, ingestion of plastic by aquatic birds and its effects are particularly well documented (i.e., Copello and Quintana, 2003; Ryan, 1989; Van Franeker et al., 2011; Yamashita et al., 2011). There is emerging evidence of negative impacts on both bird body condition and reproduction. In addition, plastic ingestion can lead to transmission of toxic chemicals and, eventually, increase mortality rates (Lavers et al., 2014; Spear et al., 1995; Tanaka et al., 2013). Therefore, monitoring the incidence of ingestion and types of plastic ingested is of major importance, since it not only provides data on affected species and a baseline for long-term trends, as it is a cost effective mean to monitor plastic pollution levels in aquatic environments (Ryan et al., 2009; Tourinho et al., 2010). For example, the Northern Fulmar (Fulmarus
glacialis) is used by both OSPAR (Oslo/Paris Convention for the Protection of the Marine
Environment of the North-East Atlantic) and the European MSFD (Marine Strategy Framework Directive) for monitoring plastic pollution and support international legislation aiming at reducing aquatic litter in the North Sea (E.C, 2008, 2010; OSPAR, 2008). Although selecting an individual species to monitor plastic pollution is of major importance, a multispecies approach is crucial to understand the factors that influence plastic litter ingestion, variation in composition amounts and trends among different species and to determine an alternative species for use in a monitoring program (Acampora et al., 2016).
Plastic ingestion in aquatic birds tend to increase with plastic exposure, i.e., if more plastics are introduced in aquatic environments, it is expected that ingestion rates will increase proportionally. For example, fulmars from the North Sea or from California contained more plastic debris than fulmars from presumably cleaner Artic breading locations (Van Franeker, 1985). However, there are other factors that can influence plastic ingestion as well; the colour of the plastics ingested can give information on how organisms may select plastics from the environment. Additionally, the size of plastics can influence the risk of being ingested by different organisms with different foraging strategies (Moser and Lee, 1992; Santos et al., 2016). Because birds detect prey from above, it has been shown that they ingest more plastics items that contrast with ocean background, such as light coloured plastics (Santos et al., 2016). Albeit, to evaluate
selectivity, organismal data must be paired with environmental assessments on the availability of different coloured plastics in the environment, information that is lacking in many regions (Provencher et al., 2017). Colour might also be related with higher exposure to several chemicals (Christie, 1994; Endo et al., 2005). Aquatic birds’ contamination is also expected to increase according to feeding techniques, with filter feeders being more contaminated than single-prey catchers, because filter feeders do not target specific items, and surface feeders being more contaminated than divers because plastics are mainly at the surface (Reisser et al., 2015). The ingestion of plastic debris by adults might be an indicative of individuals’ large range and distribution if ingested plastic debris accumulates in the gastrointestinal tract of individuals. In addition, breeding stage can also influence adults’ debris loads since adults have the capacity to regurgitate food items that may contain plastics to young chicks (inter-generational transfer), which leads to a steady decrease in adults’ plastic accumulation during breeding season (Carey, 2011). Gender differences in ingestion can be due to strong variations in parental duties, as for instance incubation performed mainly by females and general duties carried out by males (Bochenski and Jerzak, 2006; Wuczyński, 2012).
As birds ingest plastics and they accumulate them in their stomachs, plastics compete with food for space. So, measuring the mass of accumulated plastic litter in aquatic birds is possibly the most important metric from a biological perspective, because the mass of plastic debris holds information on the volume of plastics in an individual (Provencher et al., 2017). Several birds also rely on reducing the ratio between body mass and wing size (wing-loading) for flight and diving, thus a plastic-loaded bird will be in disadvantage since it becomes heavier (Provencher et al., 2017).
1.5. Objectives
Comparatively to northern Europe (i.e., Bond et al., 2014; Kühn and van Franeker, 2012; Provencher et al., 2014a; Provencher et al., 2014b; Van Franeker, 1985; Van Franeker et al., 2011), in southern European countries, attempts to monitor plastic litter in aquatic birds have been so far limited (i.e., Codina-García et al., 2013). Particularly in Portugal, the only published information concerning this theme, is restricted to the Algarve (Nicastro et al., 2018). Therefore, the general aims of this thesis are to (1) set a baseline assessment of the prevalence of plastic litter affecting multispecies population ofthe birds influences the type, quantity, colour and polymer of ingested plastics. In this study, aquatic-associated birds were considered all birds that leave on or around water (Veldman et al., 2013).
1.6. Species of interest
1.6.1. Alca torda (Razorbill; Linnaeus, 1758)
The species Alca torda belongs to the order Charadriiformes, Family Alcidae (BirdLifeInternational, 2018).
The razorbill occurs in the north Atlantic, being Britain an important location of this species (Gooders et al., 1996). They breed on islands, rocky shores and cliffs on northern Atlantic coasts, in eastern North America and in western Europe from north-west Russia to north-west France (Nettleship, 1996). In Portugal, occurs as a migratory and wintering species throughout all continental coast (Meirinho et al., 2014). This species inhabits rocky sea coasts (Nettleship, 1996), only coming ashore to breed (Bruun et al., 1995), nesting on cliff ledges and among boulders (Nettleship, 1996). They are pursuit divers that are capable of propelling themselves through the water with its wings and dive to a maximum depth of 120 m (BirdLifeInternational, 2018). However, razorbills mostly forage near the surface (BirdLifeInternational, 2018). This species was characterized as being pelagic (Bruun et al., 1995). In Portugal, this species seems to feed mainly on European pilchard (Sardina pilchardus), but there is also evidence of ingesting European anchovy (Engraulis encrasicolus) and species from the Family Ammodytidae (Beja, 1989).
According to the IUCN Red List of Threatened Species (BirdLifeInternational, 2018), this species is classified as Near Threatened (NT).
1.6.2. Ardea cinerea (Grey Heron; Linnaeus, 1758)
The grey heron (Ardea cinerea) belongs to the Order Ciconiiformes, Family Ardeidae (BirdLifeInternational, 2018).
Individuals of this species can be found throughout most of temperate Europe and extends through Russia to Japan, reaching south through China to India and can also be found in parts of Africa and in Madagascar (Gooders et al., 1982).
This species occurs in freshwater habitats, such as rivers lakes, ponds and reservoirs (Gooders et al., 1982). It breeds either solitarily or in colonies, designated as heronries, in woodland close to water (Svensson et al., 1999). Grey heron’s diet consists mainly on fish (Gooders et al., 1982), which they haunt by patiently stand completely still at the side of the water and strike rapidly when a fish comes into range (Svensson et al., 1999). Amphibians, small mammals, birds and invertebrates may also be part of their diet (Gooders et al., 1982)
According to the IUCN Red List of Threatened Species (BirdLifeInternational, 2018), this species is classified as Least Concern (LC).
1.6.3. Bubulcus ibis (Cattle Egret; Linnaeus, 1758)
Bubulbus ibis belongs to the Order Ciconiiformes, Family Ardeidae
(BirdLifeInternational, 2018).
This species has a large range and nests in North and South America, Africa, Europe, Asia and Australia (Kushlan and Hancock, 2005). The cattle egret can be found in open grassy areas, such as meadows, freshwater swamps (del Hoyo et al., 1992), pastures, marshes (Kushlan and Hancock, 2005) and flood plains (Hancock and Kushlan, 1984), however has a preference for freshwater (Marchant and Higgins, 1990) and is rarely found near marine environments (del Hoyo et al., 1992). Most cattle egret populations are partially migratory; whether a population migrates or not depends on climate and food availability (del Hoyo et al., 1992). This species of egret is an opportunistic feeder, feeding on a variety of insects, spiders, frogs and worms (Brown et al., 1982; del Hoyo et al., 1992; Hancock and Kushlan, 1984).
According to the IUCN Red List of Threatened Species (BirdLifeInternational, 2018), this species is classified as Least Concern (LC).
1.6.4. Ciconia ciconia (White Stork; Linnaeus, 1758)
The species Ciconia ciconia belongs to the Order Ciconiiformes, Family Ciconidae (BirdLifeInternational, 2018) and is one of the two species that occurs in Portugal (EquipaAtlas, 2008).
Its distribution area extends practically throughout Continental Europe, the Middle East, North and South Africa (Snow and Perrins, 1998). In Europe, there are two
populations of C. ciconia, a western population that migrates through the Strait of Gibraltar, wintering in West and Central Africa, and an eastern population, which migrates across the Bosporus Strait and though Israel, wintering in Central and South Africa (Araújo, 1998). In Portugal, its distribution extends almost throughout the hole national territory, except for Minho, Douro Litoral and Serra da Estrela massif (EquipaAtlas, 2008). It is a migratory and dispersive species (Snow and Perrins, 1998), but there has been an increase in the wintering population in the European continent (Catry et al., 2010; Rosa et al., 2009).
This is an opportunistic species that feeds depending on the availability, alone or in flocks, of earthworms, insects, fish, amphibians and small mammals caught mainly while walking or running with the head and the beak pointed down, often with some wing beats (Snow and Perrins, 1998; Tryjanowski and Kuzniak, 2002). Storks normally feed on the surrounding nesting grounds, however they can do 3 to 5 kilometres to feed and in areas with concentrated tusks, they can fly long distances (Snow and Perrins, 1998). Additionally, it has been shown that this species uses landfills and sanitary landfills as feeding sites throughout almost all its distribution (Ciach and Kruszyk, 2010; Donázar, 1992; Tortosa et al., 2002).
According to the IUCN Red List of Threatened Species (BirdLifeInternational, 2018), this species is classified as Least Concern (LC).
1.6.5. Ciconia nigra (Black Stork; Linnaeus, 1758)
The species Ciconia nigra belongs to the Order Ciconiiformes, Family Ciconidae (BirdLifeInternational, 2018).
The black stork breeds across the Palaearctic, being widespread across much of central and eastern Europe during summer, with a patchier distribution in western Europe and a partially resident population in Spain and Portugal (del Hoyo et al., 1992). This species overwinters in the Iberian Peninsula (Cano Alonso, 2006), Middle East (Van Den Bossche, 1996), Africa and also from western Pakistan, through northern India, to south-east Asia and eastern China (Bobek et al., 2008; del Hoyo et al., 1992). The species inhabits old, undisturbed, open forests (del Hoyo et al., 1992; Snow and Perrins, 1998) from sea-level up to mountainous regions (Hancock et al., 1992). It forages in shallow streams, pools, marshes (del Hoyo et al., 1992), swampy patches (Snow and Perrins, 1998), damp meadows (Hancock et al., 1992), flood-plains, pools in dry
riverbeds (Hockey et al., 2005) and sporadically grasslands (del Hoyo et al., 1992) especially where there are stands of reed or long grass (Brown et al., 1982). This species feeds mostly on fish, although it may also feed on insects, amphibians, snails, crabs, small reptiles, mammals and birds (del Hoyo et al., 1992). It forages mostly in shallow waters where they stalk its prey, catching them with a quick stab of the beak (del Hoyo et al., 1992).
According to the IUCN Red List of Threatened Species (BirdLifeInternational, 2018), this species is classified as Least Concern (LC).
1.6.6. Egretta garzetta (Little Egret; Linnaeus, 1766)
The little egret (Egretta garzetta) belongs to the Order Ciconiiformes, Family Ardeidae (BirdLifeInternational, 2018).
Specimens can be found throughout southern Europe, southern Asia and Africa, but smaller populations can also be found in Australia (Kushlan and Hancock, 2005). Individuals are never far from water, being usually found in large wetland areas, such as mudflats and marshland, but it can also be found foraging in tidal estuaries or small streams (Kushlan and Hancock, 2005).
This species is a highly opportunistic feeder (Kushlan and Hancock, 2005), feeding mostly on small fish (del Hoyo et al., 1992; Kushlan and Hancock, 2005), terrestrial and aquatic insects (i.e., beetles, dragonfly larvae, mole crickets and crickets; Kushlan and Hancock, 2005) and crustaceans (del Hoyo et al., 1992), as well as amphibians, molluscs (snails and bivalves; del Hoyo et al., 1992; Kushlan and Hancock, 2005), spiders, worms, reptiles and small birds (del Hoyo et al., 1992).
According to the IUCN Red List of Threatened Species (BirdLifeInternational, 2018), this species is classified as Least Concern (LC).
1.6.7. Gavia stellata (Red-throated Loon; Pontoppidan; 1763)
Gavia stellata belongs to the Order Gaviiformes, Family Gavidae
(BirdLifeInternational, 2018).
The species is migratory, breeding north of 50° N and far into high Artic, and wintering mainly along the north coast of Atlantic and Pacific Oceans, on Great Lakes, and Black, Caspian and Mediterranean Seas (Carboneras et al., 2018). It breeds on fresh water
pools or lakes in open moorland, blanket bogs (del Hoyo et al., 1992) or open and wet peatland areas (Campbell, 1987). It nest on small pools or lakes, showing a preference for those in treeless areas that have well-vegetated margins and low islets or promontories on which to nest (Snow and Perrins, 1998). Outside of the breeding season this species frequents inshore waters along sheltered coasts, occurring inland occasionally on lakes, pools, reservoirs and rivers (del Hoyo et al., 1992; Snow and Perrins, 1998). This species diet comprises mostly fish as well as crustaceans, molluscs, frogs, fish spawn (del Hoyo et al., 1992), aquatic insects, annelid worms (Snow and Perrins, 1998) and plant matter (del Hoyo et al., 1992).
According to the IUCN Red List of Threatened Species (BirdLifeInternational, 2018), this species is classified as Least Concern (LC).
1.6.8. Ixobrycus minutus (Common Little Bittern; Linnaeus, 1766)
The species Ixobrycus minutus belongs to the Order Ciconiiformes, Family Ardeidae (BirdLifeInternational, 2018).The common little bittern is a widespread species, occurring across Europe, western Asia, Africa, Madagascar, Australia and New Guinea (del Hoyo et al., 1992; Kushlan and Hancock, 2005). This species is mainly found in freshwater wetlands with dense aquatic vegetation, preferably with deciduous trees and bushes (del Hoyo et al., 1992). It may also occupy the edge of lakes, pools and reservoirs (del Hoyo et al., 1992), wooded and marshy edges of streams and rivers, saltmarshes (Kushlan and Hancock, 2005), wooded swamps, wet grasslands, mangroves and margins of saline lagoons (del Hoyo et al., 1992).
Its diet varies with the season and location, but normally comprises insects, such as crickets, grasshoppers, caterpillars, beetles, aquatic insects and larvae (del Hoyo et al., 1992; Kushlan and Hancock, 2005). However, this species can also feed on spiders, molluscs, crustaceans (i.e., shrimp and crayfish; del Hoyo et al., 1992; Kushlan and Hancock, 2005) and small vertebrates, such as fish, frogs, tadpoles, small reptiles and birds (del Hoyo et al., 1992).
According to the IUCN Red List of Threatened Species (BirdLifeInternational, 2018), this species is classified as Least Concern (LC).