Disponible en: http://redalyc.uaemex.mx/src/inicio/ArtPdfRed.jsp?iCve=96011647009
Devjak, Sre¿ko;Monte, Ana;Fernandes, Paula;Alves, Jorge;Ribeiro, Nuno Financial indicators for municipalities: a quantitative analysis
Revista Enfoques, Vol. 7, Núm. 11, 2009, pp. 275-302 Universidad Central de Chile
Chile
¿Cómo citar? Número completo Más información del artículo Página de la revista
Revista Enfoques
ISSN (Versión impresa): 0718-0241 enfoques@ucentral.cl
Financial indicators for municipalities: a
quantitative analysis
Sreĉko Devjak - srecko.devjak@vus.uni-lj.si Faculty of Administration, University of Ljubljana, Slovenia
Ana Monte - apmonte@ipb.pt / Paula Fernandes - pof@ipb.pt Jorge Alves - jorge@ipb.pt / Nuno Ribeiro - nunoa@ipb.pt Instituto Politécnico de Bragança - Escola Superior de Tecnologia e de Gestão, Portugal
From the characterization of Local Authority financing models and structures in Portugal and Slovenia, a set of financial and generic budget indicators has been es-tablished. These indicators may be used in a comparative analysis considering the Bragança District in Portugal, and municipalities of similar population size in Slo-venia. The research identified significant differences, in terms of financing sources due to some discrepancies on financial models and competences of municipalities on each country. The results show that Portuguese and Slovenian municipalities, in 2003, for the economy indicator, had similar ranking behaviour, but in 2004, they changed this behaviour.
Keywords: Financial Indicators, Municipalities, Quantitative Analysis, Public Accounting.
INDICADORESFINANCIEROSPARAMUNICIPIOS: UNANÁLISISCUANTITATIVO
Introduction
The Bragança District is located in the northeast of Portugal, Northern region, occupying an area of approximately 6,595 Km2, the equivalent to 7.4% of the
country. The District’s capital - Bragança - is 217 km from Porto, the second largest town in Portugal, and 107 km and 169 km from the Spanish towns of Zamora and Salamanca respectively (Abrunhosa, 2002). The Bragança District is administratively divided in twelve municipalities and 299 parishes, located in the north-eastern part of Trás-os-Montes. According to the 2001 census, the total resident population is 148,833 inhabitants (INE, 2004).
Slovenia is a coastal Alpine country in southern Central Europe bordering Italy on the west, the Adriatic Sea on the southwest, Croatia on the south and east, Hungary on the northeast, and Austria on the north. It covers a total area of 20,273 km² and has about 2 millions inhabitants (Wikipedia, 2007). This country became independent from Yugoslavia in 1991. That makes it a very young de-mocracy compared to Portugal. There are twelve statistical regions in Slovenia that exist solely for legal and statistical purposes. Nowadays, Slovenia is divided into 210 municipalities (občine, singular občina), of which eleven have urban sta-tus: Celje, Koper, Kranj, Ljubljana, Maribor, Murska Sobota, Nova Gorica, Novo Mesto, Ptuj, Slovenj Gradec and Velenje. The most populated city is the capital - Ljubljana, with 276, 313 inhabitants (svlr.gov.si, 2007). For this research, in 2003 and 2004, we considered 193 municipalities. Abouthalf of municipalities had less than five thousand inhabitants and on average, a Slovene municipality had ten thousand inhabitants.
The objective of this paper is to compare some financial indicators for Portuguese and Slovene municipalities, given the characteristics of Local Authority financing models and structures in Portugal and Slovenia, and to perceive if there are sig-nificant differences between these two countries. We considered the twelve Bra-gança District municipalities, in Portugal, and Slovene’s municipalities of similar population size.
instance, the total revenues, per capita, current revenues, per capita; capital revenues,
per capita; and Municipal funds (transferred from state budget), per capita. We also compared in relative (percentage) numbers, the relation between Current revenues and Total revenues; Capital revenues relative to Total revenues; Mu-nicipal Funds to Total revenues; or Tax revenues to Total revenues.
This paper is organized as follows: first, we explain the procedure of sharing the Municipal Funds (funds transferred from state budget). Next, the basic defini-tions and postulates of the development of a system of indicators are described in Section 2. Then, we present the empirical analysis of comparison of financial indicators for Portuguese and Slovene municipalities by the descriptive analysis and cluster analysis. Some concluding comments are given in the final section.
1.
Financial Indicators for Municipalities1.1 BASIC DEFINITIONS AND POSTULATES OF THE DEVELOPMENT OF A SYSTEM OF INDICATORS
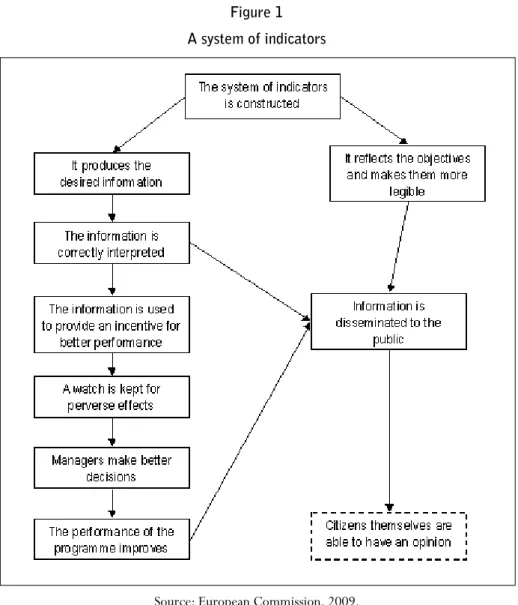
Figure 1 A system of indicators
Source: European Commission, 2009.
Indicators are user-relevant numerical information (Siegwart, 1990: 12). As numerical information, indicators can be expressed in the form of (Devjak & Merzelj, 1997; 1998):
• size of parameters of the discussed phenomenon (state in a determined period of time, extent of a phenomenon within a period);
-nent parts, e.g. wages by sex), coefficients (comparison of various content-related phenomena, e.g. wage per employee), and indexes (comparison of phenomena of the same type between units or between periods, e.g. index of an average wage in two companies), and
• other indicators of phenomenon dynamics (coefficients, growth rates, etc.), interrelation between phenomena (correlation and determination coeffi-cients), expressed by different coefficients adapted to the needs of compa-risons of different phenomena (in a numerator, parameters which positively contribute to the discussed phenomenon, and in a denominator, parameters which, when increasing, decrease the value of the discussed phenomenon.
Indicators are used in the process of decision preparation for comparisons within the system framework and/or comparisons with external systems. Comparisons within the system framework are carried out especially by (Devjak & Merzelj, 1997; 1998):
• comparisons of indicator’ values for various periods or moments; • comparisons of planned and achieved indicator values;
• comparisons of normatively determined values of indicators with the planned and achieved ones (indicators of environmental pollution, stan-dards of service performance, etc.).
Comparisons of a business system with other systems –benchmarking analyses– within the same business system or with the external systems (Devjak & Merzelj, 1997; 1998):
• according to one indicator - single-criterion comparisons; • according to several indicators - multi-criteria comparisons.
• information on relevant areas;
• interrelation and consistency;
• definition of the state and development of the system.
A system means that a formed group of relevant indicators represents a whole: the indicators are defined so as to allow comparisons and analyses of mutual relations for states and processes of the system (Dworatschek, 1971: 23; Siegwart, 1990: 33).
According to Horvath (1996: 546), a system of indicators is an organized group of interrelated indicators, which ensures comprehensive information on a certain area. Thus, a user has to have at his disposal a group of indicators, which will pro-vide him with full information on a certain area.
To develop a system of indicators, we have to take into account the following facts presented by a number of different authors:
• indicators have to be understandable to users, or else they do not repre -sent information to them (Dworatschek, 1971: 46; Schott, 1991: 19);
• user-relevant information is all that information, which the user requires to successfully perform his tasks (Kaplan & Norton, 2000: 22);
• indicators have to enable the development of quantitative models for analysis and optimisation of decisions (Ossadnik, 1998: 27/57/58);
• cause-consequence relationships between indicators (from the models) have to be as recognizable as possible (Kaplan & Norton, 2000: 313);
• a system of indicators has to enable defining of the system’s basic goals and monitoring of their realisation (Kaplan & Norton, 2000: 21).
re-present information for the user; these messages rere-present only (neutral) data to him. (Devjak & Merzelj, 1997; 1998).
There are certain risks related to the development of a system of indicators, due to which the significance of a system of indicators is often decreased (Siegwart, 1990: 123):
• systems with a too large emphasis on accounting: indicators are often produced only on the basis of accounting records and balance sheet data (accounting analyses of predominantly past operations), therefore there are too few elements of forecasting and too few indicators developed on the ba-sis of the data and information not falling within the accounting framework;
• too few projections - forecasts of trends in the progress of events, too many indicators related to past events (problems of time delays);
• problems of expressing qualitative properties by means of indicators (therefore, frequent omissions or incorrect presentations);
• the problem of a right choice of indicators; the problem of an insufficient number of indicators is as dangerous as the problem of a too large and inconsistent system of indicators, which blurs the point of the message;
• an isolated use of a system of indicators within professional groups, due to which the system of indicators does not contribute to the management efficiency; the problem of lack of understanding or difficulties related to accessibility (unsuitable and incomprehensible presentations, awkward-ness in definitions of indicators, complexity of computer tools, etc.);
• accuracy of interpretation and logic control; inconsistency often misleads the users of indicators (not understanding the contents, incomparability, wrong conclusions) when preparing the decisions, and thus does not allow logic controls of indicators’ values, which can lead to errors in the system and consequently to its uselessness;
en-sure those basic areas, which allow further implementation of composed indicators and certain special forms of indicators.
The majority of problems are caused by the definition of the indicators’ contents structure. The most general principle of developing a system of indicators says that indicators are developed for every phenomenon, where we want to carry out management functions. In general, these are planning and controlling. Of course, we have not gained much with this, since we have not defined the minimum ex-tent and the areas, for which indicators have to be developed.
Systematic study of the development of indicators presupposes that these have to comprise (Devjak & Merzelj, 1997; 1998):
• indicators of the system’s state; • indicators of processes, and
• indicators of relations between phenomena in the system and in the en -vironment.
In general, the practice distinguishes between two typical structures within sys-tems of indicators: numerically logically hierarchically (pyramid like) structu-red indicators, and indicators structustructu-red by areas (Groll, 1991: 20). The systems of pyramid like organized indicators are structured from the synthetic/basic indicator(s) of a business system downwards. The indicators of lower levels are determined according to the principle of mathematical composition of elements of indicators of upper levels. The systems of indicators structured by areas do not have a pyramid structure, but include all those indicators required for the picture about a certain area of a business system to be complete. The areas, for which indicators are developed, are classified according to:
• functions of the system (e.g. business functions in a company); • organizational units, and
• programs (e.g. production programs, service programs).
lately, also development areas, areas of relations with partners (satisfaction), and attitude towards environment have been introduced into these systems (Devjak & Merzelj, 1997; 1998).
The systems of indicators, developed on the basis of accounting data, are known under the following names (Horvath, 1996: 548; Siegwart, 1990: 36):
• DuPont System - system of indicators based on return on investment (rOI) as a primary indicator;
• Z-score System - system of indicators based on return on equity and complemented with the indicators of growth rates of operation volume, employment and success;
• Return and Liquidity System - system of indicators based on two synthe -tic indicators, return and liquidity.
There are also systems of indicators, which the companies compose according to the areas, which reflect important (to them) characteristics of company’s success. Thus, Groll (1991: 171) specifies indicators classified by areas:
• indicators of return;
• indicators of revenues and economy of operation; • indicators of labour force economy;
• indicators of productivity; • indicators of investment activity;
• cost indicators.
the mission and strategies are converted into global goals and indicators of areas and units. The indicators are organized into the following structure (Figure 2):
• financial aspect;
• aspect related to customer relations;
• aspect related to interior business processes, and • aspect related to learning and growth.
With each aspect, it is necessary to define: general goals, indicators, financial goals and initiatives.
Figure 2
Outline of the basic structure of a balanced scorecard.
Customers’ relations Interior business
process Financial Aspect
Vision and Strategy
Learning and Growth
Source: Based on Kaplan and Norton (2000: 21).
1.2 FINANCIAL INDICATORSFOR MUNICIPALITIES
de-When assessing the public sector performance, the formation of indicators for the “3E” criteria rests on the fundamental meanings of individual criteria. Their basic definitions allow defining of indicators in individual activities of administration. On the basis of their explanations, we can sum up (Allen & Tommasi, 2001: 441):
• Economy expresses costs for performed service and thus frequently demonstrates other organizational characteristics of a service provider and his capacities;
• Efficiency denotes the volume of services or things performed by an organizational unit with regard to capacities, or in other words, what capa-cities would suffice to carry out the discussed volume of services or things;
• Effectiveness expresses the achieved effects or success in service per-formance. The services performed are measured with the satisfaction of users of services and with the achieved benefit of the service. Effectiveness is frequently hard to be measured due to non-measurable effects of service performance (e.g. in a school, it is not only the achieved knowledge of pupils that counts, but also socialization, etc.). Effectiveness assessment involves also the assessment of service quality.
Performance of a public sector unit cannot be assessed absolutely, but relatively. Successful implementation of the tasks falling within the competence of a public sector and users’ satisfaction are the basic criteria in measuring the performance of a public sector organizational unit. Particularly in the public sector, measuring of performance is not possible with one indicator; each organization has to deve-lop a suitable system of indicators to this end (Argenti, 1993: 59).
According to Devjak and Merzelj (1997; 1998), the performance of a public sec-tor organization can be for a chosen system of criteria assessed from the following aspects:
• fulfilment of performance criteria according to the set goals - standards (e.g. waiting time),
• comparison of organization with similar ones (e.g. organization’s place among organizations classified according to the values of a chosen criterion),
period (tendency of changing of the criterion reveals improvement or de-terioration of operation).
The indicators are formally divided according to the contents of their message. Thus, they can be simple (elementary or analytical indicators determined for an individual quantity, usually calculated per conditional unit) or composed or synthetic indicators. Synthetic indicators offer a more expansive presentation of the performance of the observed unit, whereas analytical indicators have a clearer representation. There must be as few synthetic indicators as possible, yet clarified through a system of analytical indicators.
The basic structure of the budget indicators system of the Slovene municipalities proposed by Devjak and Merzelj (1997; 1998), comprises (www.fu.uni-lj.si):
• synthetic indicators,
• analytical indicators of budget revenues, and
• analytical indicators of budget expenditure, which was introduced to the public and which was created according to the data possibilities.
These indicators are expressed in relative numbers for annual periods. All syn-thetic indicators are based on the data used with the analytical indicators. The available Slovene data allow them to present the achievements of a municipality in the following areas: financial independence and activities, developmental and economic efficiency and harmonisation (management) of the budget expenditure and budget revenues.
The analytical indicators of budget revenues comprise the basic areas of budget revenues and give a more general overview of formation of budget revenues. They include 17 indicators for all basic groups.
sta-ted since they vary considerably with time and do not express any important rules. The value of the investment expenditure can be assessed by the user him/ herself if he/she calculates the difference between the total expenditure and the expenditure for the current tasks.
In the following section we will compare some analytical financial indicators for the Bragança District municipalities (from Portugal) and equivalent Slovene mu-nicipalities in terms of inhabitants.
2. Analysis of financial indicators for municipalities
2.1 DATAAND METHODOLOGY
As previously mentioned, the Bragança District consists of twelve municipalities and Slovenia has 210 municipalities, but in this country in 2003 and 2004 there were merely 193 municipalities. As it is not possible to compare directly the ad-ministrative organization of both countries, we decided to compare only in terms of number of inhabitants. Hence for comparison purposes we do not consider the Slovene municipalities (SM) with more than 37,000 inhabitants. Also we divided the Portuguese and Slovene residents in five categories (less than 5,000; from 5,001 to 10,000; from 10,001 to 15,000; from 15,001 to 20,000; more than 20,001). The data sources were the Bragança District Municipalities Budgets and financial documents and for Slovenia, we used the data published in the website of the Administration Faculty of Ljubljana University. The Portuguese municipalities (PM) usually present expenditures by economic classification and not by functio-nal classification as Slovene ones do. By this way we had only considered the main indicators as we will explain later.
Because after 2005 we were not able to collect data for all municipalities, we used only 2003 and 2004. In the second phase, we applied the cluster analysis (CA) to identify relatively homogeneous groups of cases based on selected characteristics and if the both Portugal and Slovenia’s groups are mixed. We considered two groups: Portugal and Slovenia.
The descriptive analysis was made with analytical indicators and synthetic indicators of revenues and main expenditures. But first we had to adjust Portu-guese and Slovene data to compare it. The analytical indicators were as follows:
• Total revenues, per capita: calculated with total revenues (of all muni-cipalities in the interval), in a year, divided by the total residents (in this interval);
• Current revenues, per capita: calculated with Current revenues (of all municipalities in the interval), in a year, divided by the total residents (in this interval). Notice that for PM we had to deduct the current municipal funds to be comparable to Slovene ones given they do not include this amount in their current revenues;
• Capital revenues, per capita: calculated with Capital revenues (of all mu-nicipalities in the interval), in a year, divided by the total residents (in this interval). For SM we include the item related with grants received in the capital revenues. For Portuguese ones, we deducted the municipal funds;
• Municipal funds, per capita: calculated with Municipal funds (of all mu-nicipalities in the interval), in a year, divided by the total residents (in this interval);
• Income from property, per capita: calculated with (current) income from property (of all municipalities in the interval), which comprise participa-tion in profits of public companies and public financial instituparticipa-tions, reve-nues from participation in profits of other companies and financial insti-tutions, revenues from interests, and revenues from property, in a year, divided by the number of residents (in this interval);
• Sale of Goods and Services, per capita: calculated with (current) sale of goods and services (of all municipalities in the interval), which covers re-venues from sales of goods and services (rere-venues of administration), in a year, divided by the total residents (in this interval);
• Other Current Revenues, per capita: calculated with other current reve-nues (of all municipalities in the interval), which includes all other current revenues, in a year, divided by the total residents (in this interval);
• Total Expenditures, per capita: calculated with total expenditures (of all municipalities in the interval), in a year, divided by the total residents (in this interval);
• Personnel Expenditures, per capita: calculated with total personnel ex-penditures (of all municipalities in the interval), in a year, divided by the total residents (in this interval);
• Investment and Transfers Expenditures, per capita: calculated with total investment and transfers expenditures (of all municipalities in the inter-val), in a year, divided by the total residents (in this interval).
The synthetic indicators were as follows:
• Percentage of current revenues to total revenues, calculated with current revenues (of all municipalities in the interval), in a year, divided by total reve-nues (in this interval). This indicate the percentage of own source of financing;
• Percentage of Municipal funds to total revenues, calculated with munici -pal funds (of all munici-palities in the interval), in a year, divided by total re-venues (in this interval). This indicator gives us the level of a municipality’s connection with state budget;
• Percentage of tax revenues to total revenues, calculated with tax reve -nues (of all municipalities in the interval), in a year, divided by total reve-nues (in this interval). This indicator gives us, in a certain way, the level of a municipality’s independence as it presents us the percentage of total revenues due to tax revenues;
• Percentage of personnel expenditures to total expenditures calculated with personnel expenditures (of all municipalities in the interval), in a year, divided by total expenditures (in this interval). This indicator shows the percentage of total expenditures due to personnel expenditures. So, it is the inverse of the criterion of economy, which represents the number of times the total expenditures, contains the personnel expenditures;
• Percentage of investment and transfers expenditures to total expendi -tures calculated with investment and transfers expendi-tures (of all muni-cipalities in the interval), in a year, divided by total expenditures (in this interval). The inverse of this indicator shows the investment propensity.
Other synthetic indicators used were percentage of current revenues due to in-come from property; percentage of current revenues due to sales of goods and services and percentage of current revenues due to other current revenues.
For the construction of joint rank, we follow the methodology used by Devjak (2004) and present in the site of Ljubjana University as follows:
• first, we calculate the rank for the indicator of economy calculated as a ratio of sum of total expenditure (of all municipalities in interval of popu-lation) to the sum of total personnel expenditures, ranking the according to the highest indicator to lowest indicator;
inter-• then we sum, in each interval of population, the rank for the two pre -vious indicators;
• finally, we rank the intervals according the previous value (of sum of ranks).
In the following sections we present the analysis of data, first the descriptive analysis and after the cluster analysis.
2.2 COMPARISONBETWEEN PORTUGUESEAND SLOVENE FINANCIALS INDICATORS
As we can see in Table 1, financing indicator, per capita, as given by Total reve-nues, per capita, is higher for PM than for Slovene ones (it varies between €1,817 and €806.7, for PM and €557.9 to €645.2 for SM). Comparing the year 2003 with 2004, we observe that this indicator had increased for all SM but had different behaviour for Portuguese ones. PM with less than 5,000 inhabitants and more than 20,001 inhabitants decreased total revenues, per capita. The other PM had increased the total financing indicator.
In terms of sources of financing (current revenues, capital revenues or municipal funds), SM presented, in general more than twice the Portuguese current reve-nues, in both years. Municipalities with more than 10,000 and less than 15,000 inhabits are those with bigger difference (almost 2.7 times), in 2003; the lower difference is for municipalities with less than 5,000 residents (in 2003). In 2004, the highest difference (almost 2.8 times) was in the interval of 10,000-15,001, and the lowest was for municipalities with more than 20,001 inhabitants. PM had more transferred funds (Municipal Funds) than SM but we observe the same behaviour in both countries in relation to this indicator (bigger municipalities receive less municipal funds than smaller ones).
In terms of synthetic indicators we can observe (Table 2) that the percentage of cu-rrent revenues to total revenues for SM is much bigger than for Portuguese ones (and even bigger for more populated ones). A different behaviour is experienced with capital revenues to total revenues. PM have more revenues from capital items (we can infer that PM resort to external sources, mainly bank debt1) than Slovene ones.
The level of a municipality’s connection with state budget, as given by the per-centage of total revenues due to tax revenues is higher for SM and very low for Portuguese ones. While for the interval of less than 5,000 residents the le-vel of independence, in 2003, is 4.0% for Portuguese ones; for Slovene ones is 42%, decreasing in 2004. The indicator increased in 2004 for PM with more than 20,001 residents (13.1% compared to 9.8% in 2003) but still very underneath the Slovene indicator (which is above 63%).
Analysing the expenditures, we observed a higher level of total expenditures, per capita for PM than for Slovene ones. This indicator grew in most of municipalities, comparing the year 2003 with 2004, except for PM with more residents and less residents. In relation to personnel expenditures, per capita, PM also presented hig-her indicator than SM. The growing rate of this indicator varied between 1% and 7% (the average rate was 5%) for Portuguese Municipalities. Slovene Municipali-ties also experienced an increase in the type of expenditure in those municipaliMunicipali-ties with residents more than 15000. For smaller SM there was a significant decrease in this indicator in 2004. About the investment and transfer expenditures (per capita), PM increased this indicator at an average rate of 18% (it varied between 4% and 30% and for PM with more population, the indicator decreased around 12%). For SM, the average growth rate for Investment and Transfer expenditures was smaller. relatively to the synthetic indicators of expenditures, we observed that the smaller PM spent less in investment and transfer expenditures than the other PM. SM spent less funds in personnel expenditures than PM, in average.
cial indica to rs fo r municip alities: a q u antit ative an al ysis
Ana Monte / P
aula F
er
nandes / J
or
ge
Alv
es / Nuno Ribeiro
293
Intervals of
residents Group (1)
revenues (2) (3) Property (4) and Services (5) revenues (6) revenues (7) (8)
2003 2004 2003 2004 2003 2004 2003 2004 2003 2004 2003 2004 2003 2004 2003 2004
Less than 5,000 1 1,817.0 1,539.4 182.3 126.3 72.8 27.4 33.1 36.3 25.7 28.1 50.7 34.5 500.5 346.3 1,006.4 1,066.8
5,001-10,000 1 1,200.4 1,269.0 165.6 170.4 34.9 30.1 11.3 8.8 55.4 68.8 64.0 62.7 303.1 268.5 731.7 775.7
10,001-15,000 1 1,143.4 1,170.4 143.1 149.6 28.5 25.9 13.1 13.7 43.7 50.5 57.7 59.4 268.9 254.3 731.4 766.5
15,001-20,000 1 909.8 930.9 161.7 202.4 51.6 33.4 1.3 1.4 43.6 45.1 65.2 122.5 238.4 194.2 509.8 534.2
More than 20,001 1 894.5 806.7 226.9 269.7 87.9 105.9 32.6 38.2 61.1 62.5 45.2 63.1 304.9 156.9 362.8 380.1
Less than 5,000 2 588.0 625.9 317.9 348.7 247.2 261.4 37.2 38.8 5.7 6.4 25.6 42.0 23.7 38.9 246.4 238.2
5,001-10,000 2 565.6 645.2 377.0 419.6 295.8 318.3 37.6 41.2 7.1 8.4 34.3 51.6 18.5 48.5 170.1 177.1
10,001-15,000 2 557.9 618.6 384.7 426.1 317.8 344.5 31.3 34.3 4.0 2.5 28.6 44.8 33.2 28.8 140.0 163.7
15,001-20,000 2 593.4 609.5 405.1 448.3 329.6 359.8 29.4 33.2 2.5 3.2 41.0 52.2 53.8 37.8 134.5 123.3
294
vist
a Enfo
q
ues
•
V
o
l.
VII
• Númer
o 11 • 2009
residents 2003 2004 2003 2004 2003 2004 2003 2004 2003 2004 2003 2004 2003 2004 2003 2004
Less than 5,000 10.0% 8.2% 27.5% 22.5% 55.4% 69.3% 4.0% 1.8% 9.3% 21.7% 4.2% 28.7% 3.3% 22.2% 6.4% 27.3%
5,001-10,000 13.8% 13.4% 25.3% 21.2% 61.0% 61.1% 2.9% 2.4% 5.8% 17.7% 1.9% 5.2% 9.2% 40.4% 10.6% 36.8%
10,001-15,000 12.5% 12.8% 23.5% 21.7% 64.0% 65.5% 2.5% 2.2% 4.9% 17.3% 2.3% 9.2% 7.5% 33.8% 9.9% 39.7%
15,001-20,000 17.8% 21.7% 26.2% 20.9% 56.0% 57.4% 5.7% 3.6% 11.0% 16.5% 0.3% 0.7% 9.3% 22.3% 13.9% 60.5%
More than 20,001 25.4% 33.4% 34.1% 19.5% 40.6% 47.1% 9.8% 13.1% 19.8% 39.3% 7.3% 14.2% 13.7% 23.2% 10.2% 23.4%
Less than 5,000 54.1% 55.7% 4.0% 6.2% 41.9% 38.1% 42.0% 41.8% 77.8% 75.0% 1.8% 11.1% 11.7% 1.8% 8.0% 12.1%
5,001-10,000 66.7% 65.0% 3.3% 7.5% 30.1% 27.4% 52.3% 49.3% 78.5% 75.9% 1.9% 9.8% 10.0% 2.0% 9.1% 12.3%
10,001-15,000 68.9% 68.9% 6.0% 4.7% 25.1% 26.5% 57.0% 55.7% 82.6% 80.8% 1.0% 8.0% 8.1% 0.6% 7.4% 10.5%
15,001-20,000 68.3% 73.6% 9.1% 6.2% 22.7% 20.2% 55.5% 59.0% 81.4% 80.2% 0.6% 7.4% 7.3% 0.7% 10.1% 11.6%
More than 20,001 81.2% 81.7% 3.9% 3.4% 14.9% 14.9% 64.4% 63.4% 79.4% 77.5% 0.2% 11.3% 11.7% 0.2% 7.9% 11.0%
cial indica
to
rs fo
r municip
alities:
a q
u
antit
ative
an
al
ysis
Ana Monte / P
aula F
er
nandes / J
or
ge
Alv
es / Nuno Ribeiro
295
Intervals of residents Group Total Expenditures (1)
Personnel Expenditures
(2)
Investment and Trans-fers Expenditures
(3)
(2)/(1) (3)/(1)
296
a Enfo
q
ues
•
V
o
l.
VII
• Númer
o 11 • 2009
Intervals of
residents Group
Indicator of Economy
rank
Economy Investment
Propensity
Investment Propensity
Total Joint
rank
Indicator of Economy
ra
Economy Investment Propensity Investment Propensity Total rank
2003 2004
Less than 5,000 1 3.308 5 7.405 5 10 4 2.884 5 6.660 5 10 3
5,001-10,000 1 4.591 3 2.057 1 4 1 4.958 4 1.948 2 6 2
10,001-15,000 1 5.010 2 2.100 2 4 1 5.912 1 1.904 1 2 1
15,001-20,000 1 4.292 4 2.109 3 7 3 5.094 3 1.989 3 6 2
More than 20,001 1 5.959 1 2.135 4 5 2 5.305 2 2.410 4 6 2
Less than 5,000 2 11.870 5 2.895 5 10 5 14.877 4 2.909 3 7 4
5,001-10,000 2 22.962 3 2.696 1 4 2 17.354 1 2.838 2 3 1
10,001-15,000 2 16.827 4 2.829 3 7 4 15.207 3 2.537 1 4 2
15,001-20,000 2 41.962 2 2.853 4 6 3 15.792 2 2.930 4 6 3
2.3 CLUSTER ANALYSIS
As mentioned above, we used Cluster Analysis to identify relatively homogeneous groups of cases based on selected characteristics and if the both Portugal and Slovenia’s groups are mixed. In hierarchical cluster analysis, an algorithm is used that starts with each case in a separate cluster and combines clusters until only one is left (Hair
et al., 1998). The most important assumption is that the basic measure of similari-ty on which the clustering is based is a valid measure of the similarisimilari-ty between the objects, and the second is that there is theoretical justification for structuring the objects into clusters (Aaker et al., 2001). For the statistical analysis we used SPSS.
To cluster cases is necessary to identify variables that we wish to be considered in creating clusters for the cases. The variables to be used for cluster formation are: Tax revenue; Income Property; Sales of Goods and Services; Capital revenues; Municipal Funds; Personnel Expenditure and Investment Expenditure, for 2003 and 2004 years. And the cluster method for combining the clusters was the bet-ween-group linkage where computes the smallest average distance between all group pairs and combines the two groups that are closest. We used the Squared Euclidean distance measuring.
Table 5
Cluster Membership, year 2003
Case: Group 4 Clusters 3 Clusters 2 Clusters
1: 1 1 1 1
2: 1 2 2 1
3: 1 2 2 1
4: 1 3 2 1
5: 1 3 2 1
6: 2 4 3 2
7: 2 4 3 2
8: 2 4 3 2
9: 2 4 3 2
10: 2 4 3 2
2
According to Table 5 we can see the profile for the four cluster solution, where present the high r-squared. Also, we observed that the all SM contributes for the same clus-ter. For PM we obtained 3 clusters, that joint municipalities with similar dimension.
The dendrogram provide a means of identifying outliers in the sample, permits a visual inspection where an outlier would be a ‘branch’ that did not join until very late. As we can observed in follow figure the case one (belonging to group 1) is an outlier and creating one cluster. Notice that, according to descriptive analysis, this case presented also the worst indicators in terms of revenues and expenditu-res, being economy inefficient and having low propensity to investments.
Figure 3
Dendrogram for Hierarchical Cluster Analysis using Between-group Linkage Method, year 2003.
Table 6
Cluster Membership, year 2004
Case: Group 4 Clusters 3 Clusters 2 Clusters
1: 1 1 1 1
2: 1 2 2 1
3: 1 2 2 1
4: 1 3 2 1
5: 1 3 2 1
6: 2 4 3 2
7: 2 4 3 2
8: 2 4 3 2
9: 2 4 3 2
10: 2 4 3 2
2
r 0,9740 0,8707 0,6877
rescaled Distance Cluster Combine
Figure 4
Conclusions and Future Research
This paper compares some financials indicators from the perspective of financing sources (revenues) between Portuguese municipalities (all municipalities of the Bragança District) and Slovene municipalities with similar population size. The analysis was made with analytical indicators (absolute numbers per inhabitant) and synthetic indicators (relative numbers), using descriptive analysis for the years 2003 and 2004 and we applied cluster analysis, for both years, to identify relatively homogeneous groups of cases based on selected characteristics and if the both Portugal and Slovenia’s groups are mixed.
The remarkable conclusions, from the descriptive analysis, are as follow: Total revenues, per capita, was higher in Portugal when compared to Slovenia, as well as for total expenditures. This difference was bigger for municipalities with less population density (it was almost three times the total revenues per capita of Slo-vene municipalities, in the interval of less than 5,000 residents) in terms of total revenues. Such fact may be justified by the significant weight of municipal funds (namely the cohesion fund, as the Portuguese municipalities, in this research, are inserted in the interior region with low economic development). The weight of capital revenues in total revenues was higher in Portugal than in Slovenia, conver-sely we noticed the opposite for current revenues. This may show the dependence of Portuguese municipalities from external financing sources (specifically bank financing) whereas in Slovenia own source of financing (current revenues) was the most significant.
the largest SM changed from the first position to last one. According to the clus-ter analysis we concluded, for both years: the cases presented the same behaviour, SM formed one cluster and PM created 3 clusters, that joint municipalities with similar dimension, and there was an outlier presented by case one.
This research has some limitations, namely we considered only the Portuguese municipalities of the Bragança District. In this manner, future research may be done by spreading the study to all Portuguese municipalities and compare it with all municipalities of Slovenia as well as dividing the municipalities in interior region and seaside.
Referencies
Aaker, David; Kumar, V. and Day, George. (2001). Marketing Research. USA: Wiley & Sons.
Abrunhosa, Vasco. (2002). Governo Civil de Bragança. http://gcivilbraganca.cidadevirtual.pt Allen, R. and Tommasi, D. (2001). Managing Public Expenditure: a reference book for transition
countries. Paris: OECD.
Argenti, J. (1993). Your organisation: What is it for? - Challenging traditional organisational Aims. New York: Mc Graw-Hill.
Devjak, Srečko and Merzelj. (1997). “Methodologische Grundlagen für die Steuerung eines optimalen” Rundholzeinschnitts=Metodološke osnove za vođenje optimalnog pos-tupka piljenja trupaca. Vol. 48. N° 3, pp. 129-136.
Devjak, S. and Merzelj. (1998). Einführung von Kenzahlen bei der Entwicklung der wirtschaft-lichen Rundholzeinschnittoptimierung. In Stark, M. (ed.) Current economic questions in forestry and wood industry. Sopron: Department of Forestry Policy and Economics University of Sopron.
Devjak, S. (2004). Budget Indicators System of Slovene Municipalities. University of Ljublja-na. Administration Faculty. Paper unpublished. pp. 1 -11.
Dworatschek, S. (1971). Management - Informations - Systeme. Berlin: Walter de Gruyter &Co.
http://ec.europa.eu/regional_policy/sources/docgener/evaluation/evalsed/guide/ methods_techniques/using_indicators/usefulness_en.htm
Groll, K. H. (1991). Erfolgssicherung durch Kennzahlensysteme. Haufe: Freiburg im Breisgau.
Hair, Joseph; Anderson, Rolph; Tatham, Ronald and Black, William. (1998). Multivariate Data Analysis. Englewood Cliffs, NJ: Prentice Hall.
Horvath, P. (1996). Controlling. München: Verlag Franz Vahlen.
INE. (2004). Retrato Territorial. Portugal: Instituto Nacional de Estatística.
Kaplan, R. And Norton, D. (2000). Uravnoteženi sistem kazalnikov (prevod). Ljubljana: Go-spodarski vestnik.
Ossadnik. (1998). Controlling. München. Ossadnik: Wien.
Schott, G. (1991). Kenzahlen - Instrument der Unternehmensfűhrung. Wiesbaden: Forkel Verlag.
Siegwart, H. (1990). Kennzahlen fűr die Unternehmungsfűhrung. Stuttgart: Verlag Paul Haupt.