F
ACULDADE DEE
NGENHARIA DAU
NIVERSIDADE DOP
ORTOAutomatic Debugging of Android
Applications
Pedro Miguel Ferreira Machado
Mestrado Integrado em Engenharia Informática e Computação Supervisor: Rui Maranhão (PhD)
Automatic Debugging of Android Applications
Pedro Miguel Ferreira Machado
Mestrado Integrado em Engenharia Informática e Computação
Approved in oral examination by the committee:
Chair: António Miguel Pontes Pimenta Monteiro (PhD) External Examiner: José Maria Amaral Fernandes (PhD) Supervisor: Rui Filipe Lima Maranhão de Abreu (PhD) Co-Supervisor: José Carlos Medeiros de Campos (MSc)
This work is financed by the ERDF – European Regional Development Fund through the COMPETE Programme (operational programme for competitiveness) and by National Funds through the FCT - Fun-dação para a Ciência e a Tecnologia (Portuguese Foundation for Science and Technology) within project PTDC/EIA-CCO/116796/2010.
Resumo
Nos últimos anos, o mercado dos dispositivos móveis tem crescido de forma exponencial. Este crescimento é evidenciado pelo facto de, em 2011, o número de dispositivos vendidos ter ultrapas-sado o número de PCs. Apesar desta evolução e das contínuas melhorias aos sistemas e arquite-turas móveis, a depuração das suas aplicações é ainda um processo manual, moroso e suscetível a erros. Embora a qualidade e fiablidade de uma aplicação possam sofrer grandes melhorias se a mesma for extensivamente testada e depurada, muitas vezes este processo não é compatível com as condições impostas pelo mercado. O diagnóstico automático de erros e/ou falhas durante o teste de software pode trazer grandes melhorias ao processo de depuração, ajudando assim ao desenvolvimento de aplicações com maior fiabilidade e qualidade.
A localização de falhas tem sido um grande foco de investigação, o que levou à criação de ferramentas como o Tarantula ou o GZOLTAR. Spectrum-based Fault Localization (SFL), ou localização de falhas baseada em espectros, a técnica na qual as referidas ferramentas se baseiam. Esta é uma técnica de depuração estatística que depende da informação de cobertura de código de execuções de teste. Contudo, os dispositivos móveis apresentam alguns desafios e particularidades devido à sua índole de sistema embebido e, por isso, poucos avanços têm sido alcançados na área do desenvolvimento de software no que diz respeito a este tipo de dispositivos.
Nesta tese é proposta uma abordagem que tem como objetivo ultrapassar os problemas cau-sados pelas particularidades dos dispositivos móveis. Esta abordagem, denominada MZOLTAR, combina análise estática (através do Lint) e análise dinâmica (através do SFL) de aplicações móveis, com o objetivo de produzir relatórios de diagnóstico que ajudem a encontrar potenciais defeitos mais rapidamente. A abordagem inclui também a representação gráfica dos relatórios de diagnóstico, melhorando a perceção dos mesmos.
Para avaliar a validade e a eficácia da abordagem proposta, foi realizada uma avaliação em-pírica, injetando falhas em quatro aplicações Android open-source. Os resultados mostram que a abordagem implica um overhead de execução baixo (5.75% em média), enquanto que, em média, é apenas necessário inspecionar 5 componentes até que a falha seja localizada. Para além disso, é demonstrado que a informação fornecida peloLintajuda na localização de falhas que de outra forma não seriam localizadas pelo SFL. Nesses casos, a integração com o Lint reduziu o número de componentes a inspecionar em 99.9% em média.
Abstract
In the past few years, we’ve been assisting to an exponential growth of the mobile devices’ market. In 2011 the number of devices shipped exceeded the number of PCs. Despite this market growth and the improvements made to the mobile architectures, debugging mobile apps is still a manual, error-prone and time consuming task. While the reliability of an application can be greatly im-proved by extensively testing and debugging it, this process often conflicts with market conditions. Automated diagnosis of errors and/or failures detected during software testing can greatly improve the efficiency of the debugging process, thus helping to make applications more reliable.
Fault localization has been an active area of research, leading to the creation of several tools, such as Tarantula and GZOLTAR. Spectrum-based Fault Localization (SFL), the technique behind the outlined tools, is a statistical debugging technique that relies on code coverage information. However, the embedded nature of mobile devices poses some particular challenges, thus very few has been reported in the area of mobile software.
This thesis proposes an approach to overcome the challenges presented by the mobile devices architecture. This approach, dubbed MZOLTAR, that combines static (usingLint) and dynamic analysis (using SFL) of mobile apps to produce a diagnostic report to help identify potential defects quickly. The approach also offers a graphical representation of the diagnostic report, making it easier to understand.
To assess the validity and performance of MZOLTAR, an empirical evaluation was performed, by injecting faults into 4 real open-source Android applications. The results show that the ap-proach requires low runtime overhead (5.75% on average), while the tester needs to inspect 5 components on average to find the fault. Furthermore, it demonstrates that Lint helps revealing bugs that otherwise would go undetected by the SFL fault localization technique. In those cases, the integration with Lint reduced the number of components to inspect by 99.9% on average.
Acknowledgements
The journey to write this thesis would have not been possible without the people that stood by me during all these years. First of all, I would like to thank my supervisors Rui Maranhão and José Campos for their help and for making me believe I was up to the challenge. Their motivation was a key point as they managed to transform an area I had never considered before into one that I am passionate about. Special thanks to my dear friend Alexandre Perez, for all the times I bored him with my problems and for all the help he gave me. Thanks to my lab partners, Carlos Gouveia, Luís Pinho, João Batista and José Barbosa for helping me whenever I needed and for the fun times. I would also like to thank Nuno Cardoso for all the helpful ideas and feedback he gave me throughout this thesis (and for the beer, the beer helped a lot!). I am also grateful to Dr. Arjan J.C. van Gemund for his valuable and helpful feedback.
To my dear friend João Santos, even though he is far, I would like to thank for all the sup-port and fun times we had chatting and playing along with Luís Silva. To my friends Fernando Fernandes, Filipe Carvalho and Mariana Ponce who have always been there for me.
I would like to thank my girlfriend, Margarida Fonseca, for all her support and understanding, for believing in my potential and for all the times she stood by my side when I had to work. I love you!
Finally, I would like to address the biggest thank of them all to my family, specially to my parents Luísa Machado and Adérito Machado, and grandparents Fernanda Ribeiro and Domingos Ferreira, for giving me the chance to make them proud and to repay all they have done for me. All the sacrifices, all the times I had to stay up late, all the times I couldn’t be with you, it pays off when I get to see the pride stamped in your faces. Thank you!
“Quality is the ally of schedule and cost, not their adversary. If we have to sacrifice quality to meet schedule, it’s because we are doing the job wrong from the very beginning.”
Contents
1 Introduction 1
1.1 Concepts and Definitions . . . 2
1.2 Motivation . . . 2
1.3 Main Goals . . . 4
1.4 Document Structure . . . 4
2 Android Operating System 5 2.1 History . . . 5
2.2 Android Manifest . . . 6
2.3 Components . . . 6
2.4 System Architecture . . . 9
2.4.1 Applications and applications framework . . . 9
2.4.2 Libraries . . . 10
2.4.3 Android Runtime . . . 10
2.4.4 Linux Kernel . . . 11
3 Related Work 13 3.1 Testing Android Applications . . . 13
3.1.1 Instrumentation framework . . . 14
3.1.2 MonkeyRunner . . . 15
3.1.3 Monkey . . . 15
3.1.4 Robotium . . . 15
3.2 Debugging of Android Applications . . . 15
3.2.1 LogCat . . . 15
3.2.2 Android Debugging Bridge (ADB) . . . 17
3.2.3 Dalvik Debug Monitor Server (DDMS) . . . 17
3.2.4 Java Debug Wire Protocol (JDWP) debugger . . . 18
3.2.5 Traceview . . . 18
3.2.6 HierarchyViewer . . . 20
3.2.7 Lint . . . 21
3.2.8 A Graphical On-Phone Debugger (GROPG) . . . 21
3.3 Automated Debugging and Testing . . . 22
3.3.1 Spectrum-based Fault Localization (SFL) . . . 22
3.3.2 Tarantula . . . 23
3.3.3 EzUnit . . . 23
3.3.4 Zoltar and GZOLTAR . . . 24
CONTENTS
4 Methodologies 29
4.1 Code Instrumentation . . . 29
4.1.1 ASM . . . 30
4.1.2 ASMDex . . . 30
4.1.3 JaCoCo Offline Instrumentation . . . 31
4.2 Collection of program spectra . . . 32
4.2.1 LogCat . . . 32
4.2.2 Sockets . . . 33
4.2.3 Files . . . 33
4.2.4 JTAG Boundary Scan Test . . . 34
4.2.5 Android Testing Framework . . . 35
4.3 Other analysis . . . 35
4.3.1 Lint Analysis . . . 35
4.3.2 Permission Analysis . . . 35
5 Tooling 37 5.1 Motivational Example . . . 37
5.2 Combining Static and Dynamic Analysis . . . 40
5.3 Workflow . . . 42 5.4 Eclipse integration . . . 43 6 Empirical Evaluation 45 6.1 Experimental Setup . . . 45 6.2 Evaluation Metric . . . 47 6.3 Experimental Results . . . 47 7 Conclusions 53 7.1 Related Work . . . 53 7.2 Methodologies . . . 53 7.3 Lessons Learned . . . 54
7.4 Empirical Evaluation Results . . . 55
7.5 Main Contributions . . . 55
7.6 Publications . . . 55
7.7 Future work . . . 56
References 59
List of Figures
1.1 Software development process. . . 1
2.1 Android activity lifecycle diagram . . . 7
2.2 Android system architecture . . . 9
3.1 Android test framework diagram. . . 14
3.2 LogCat output example . . . 16
3.3 DDMS screenshot . . . 18
3.4 The architecture . . . 19
3.5 The timeline panel of the traceview tool . . . 19
3.6 The profile panel of the traceview tool . . . 19
3.7 HierarchyViewer - View Hierarchy window . . . 20
3.8 GROPG interface. . . 22
3.9 SFL input. . . 23
3.10 Tarantula interface . . . 24
3.11 EzUnit ranking. . . 25
3.12 EzUnit call graph. . . 25
3.13 Zoltar interface [JAG09]. . . 26
3.14 GZOLTAR[CRPA12] overview. . . 26
4.1 Tool execution phases. . . 29
5.1 Sunburst visualization (and how to interpret it). . . 38
5.2 Example of SFL technique with Ochiai coefficient (adapted from [GSPGvG10]). 39 5.3 Android example application with bug in result. . . 39
5.4 Lintintegration in visualizations. . . 41
(a) Static defects only. . . 41
(b) Static and dynamic defects. . . 41
5.5 MZOLTARparameters’ interface. . . 44
5.6 MZOLTARdevice chooser. . . 44
6.1 Diagnostic accuracy Cd. . . 50
(a) CharCount . . . 50
(b) ConnectBot . . . 50
(c) Google Authenticator . . . 50
(d) StarDroid . . . 50
6.2 Impact of Grouping Test Cases on Cd. . . 50
(a) CharCount . . . 50
LIST OF FIGURES
(c) Google Authenticator . . . 50
(d) StarDroid . . . 50
6.3 Outcomes when grouping multiple tests per transaction. . . 51
(a) Density . . . 51
(b) Time . . . 51
List of Tables
6.1 Experimental Subjects. . . 45 6.2 Execution times. . . 48 6.3 Cdcomparison with and withoutLint. . . 49
LIST OF TABLES
Abbreviations
ADB Android Debugging Bridge ADT Android Development Tools .dex Dalvik Executable
DDMS Dalvik Debug Monitor Server DVM Dalvik Virtual Machine
GROPG A Graphical On-Phone Debugger GUI Graphical User Interface
IDE Integrated Development Environment JDWP Java Debug Wire Protocol
JVM Java Virtual Machine LOC Line Of Code
NDK Native Development Kit SDK Software Development Kit SFL Spectrum-based Fault Localization SUT System Under Test
UI User Interface VM Virtual Machine
Chapter 1
Introduction
In the past years, the market of mobile devices such as smartphones and tablets has been growing exponentially. The number of shipped mobile devices even exceeded the PCs in 2011. The two main operating systems in the market, Apple’s iOS and Google’s Android, have been competing for about 5 years, and in the first quarter of 2013 Android had 75% of the market share while Apple had 17%1. This has the potential to represent a big paradigm shift in some technological areas and implies substantial changes and adjustments in the software development area.
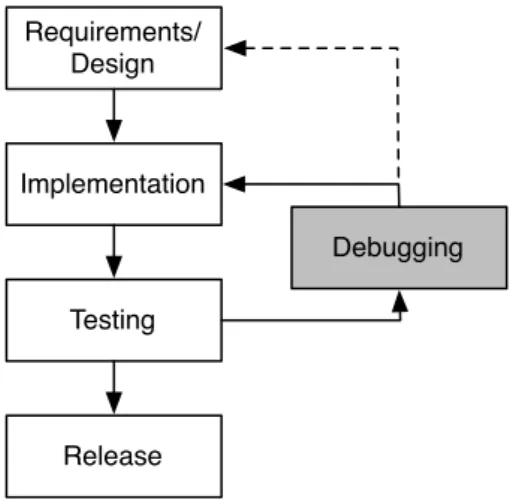
The process used to develop software for mobile devices is the same used to develop any other software. Generally the process follows four main phases: design, implementation, testing and release (see Figure 1.1).
Requirements/ Design Implementation Testing Release Debugging
Figure 1.1: Software development process.
However, it is highly probable that not all tests pass at the first try and there may be needed some adjustments in the implementation. This implies adding a new phase to the process, that includes changing the implementation (although the focus of this thesis is the implementation, in some cases the design itself may need adjustments) to assure the application is functioning
1IDC Worldwide Quarterly Mobile Phone Tracker - http://www.idc.com/getdoc.jsp?containerId=
Introduction
correctly, according to its specification. Therefore a cycle is created, following a debugging phase whenever a test or multiple tests fail. This phase includes correcting the implementation to mitigate the problem, and after the adjustments, the application is tested again, until all tests pass and all the conditions for successful release are met. Debugging is not easily estimated and, besides being the most error-prone phase in the software development life cycle, it consumes a great amount of time and other resources. Given those facts it is important to drastically reduce the debugging costs to achieve better software quality with less resources [Tas02, HS02].
Although several debugging tools are available, not much has been reported in the area of mobile software, therefore debugging mobile applications is still a manual and time-consuming task. This thesis’ main goal is to ease the task of debugging mobile applications, increasing reliability and quality, while reducing the usual time-to-market.
1.1
Concepts and Definitions
Throughout this thesis, the following terminology is used [ALRL04]:
• a failure is an event that occurs when delivered service deviates from correct service • an error is a system state that may cause a failure
• a fault (defect/bug) is the cause of an error in the system.
In this thesis, this terminology is applied to software programs, where faults are bugs in the pro-gram code. Failures and errors are symptoms caused by faults in the propro-gram. The purpose of fault localization is to pinpoint the root cause of observed symptoms (failures).
Definition 1 A software program Π (a mobile app in the context of this thesis) is formed by a sequence M of one or more statements.
Definition 2 A test suite T = {t1, . . . ,tN} is a collection of test cases that are intended to test
whether the program follows the specified set of requirements. The cardinality of T is the number of test cases in the set|T | = N.
Definition 3 A test case t is a (i, o) tuple, where i is a collection of input settings or variables for determining whether a software system works as expected or not, and o is the expected output. If Π(i) = o the test case passes, otherwise fails.
1.2
Motivation
Despite recent advances in the mobile software area, the development of applications for mobile devices - such as Android apps - still poses interesting challenges [EMK13]:
Introduction
• The large amount of available devices and their large range of specifications (e.g., cpu speed, screen resolution), makes it difficult to check the consistency and ensure portability between different devices and platforms;
• Testing apps for each target platform requires the development of several versions. Further-more, the available testing frameworks have serious limitations for testing mobile specific features;
• Developers claim that better analysis tools and techniques to help debugging apps are se-riously needed. In fact in the World Quality Report [CCSH12],2⁄
3of surveyed developers
mentioned that they do not have the proper tools to test and debug mobile apps, despite the available tools such as provided by Android Software Development Kit (SDK) and Android Development Tools (ADT) plugin.
Software reliability can generally be improved through extensive testing and debugging, however this often conflicts with market conditions. Often, software cannot be tested exhaustively, and of the bugs that are found, only those with the highest impact on the user-perceived reliability can be solved before the release. Therefore, applications tend to be released with bugs that are not easily perceived but can cause problems in the future. Given the low impact of the most software bugs in this area, the reliability is brought down to a commercial acceptable level. The goal is not to loose out to the competitors and achieve a acceptable product, with a perceivable value to the costumer, in spite of its imperfections.
In this typical scenario, testing reveals more bugs than can be solved, and debugging is a bot-tleneck for improving reliability. Although the mobile applications market has been growing a lot in the past few years, and even with the fast evolution of the mobile architectures we have been assisting, debugging mobile applications is still a manual and time-consuming task. Automated debugging techniques, based on data gathered from program executions [WDLG12, HZZ+09, AZGvG09, LFY+06, WWQZ08, SSPC13, SF12] or on expected program behaviour [MS03, MS08, dK09] may be used to reduce this bottleneck.
Locating a fault is an important step in actually fixing it. SFL is a technique, which is amongst the best performing techniques, that helps identifying the root cause of observed failures, relying on program execution data and test pass/fail information. GZOLTAR2[CRPA12], which focuses on Java programs, and Tarantula [JH05], which focuses on C programs are examples of tools offering the SFL technique. Since it is lightweight, SFL has been successfully applied in the context of embedded software [ZAGvG07, ZPA+08]. Despite these tools and the increasingly active research in the area of fault localization, not much has been reported in the area of mobile software.
Furthermore, given the particularities of mobile apps development, some faults are of a more static nature (e.g., not declaring an activity in the manifest file3). As this may conceal the fault,
SFL simply misses it. Thus, decreasing considerably the quality of the diagnostic report. Lint4
2GZOLTARhomepagehttp://gzoltar.com, 2013.
3The manifest presents essential information about the application to the Android operating system; information the system must have before it can run any of the application’s code.
Introduction
is a static analysis tool that was adapted to Android, being distributed with the Android SDK. It scans project sources seeking for potential static defects.
Tools like GZOLTARprovide visual representations of the diagnostic report. These visualiza-tions are a translation of the report into an intuitive representation that ease and speed up the fault localization process.
Hereupon, the application of SFL in conjunction with the information provided by Lint checks would ease the debugging of mobile apps. Moreover, combining the two analysis and reflecting this combination in any provided visualizations would positively affect the fault local-ization process.
1.3
Main Goals
Given the main limitations of the mobile devices, their embedded nature and the fact that they are resource constrained devices, some research questions arise:
• Is the MZOLTAR’s instrumentation overhead negligible?
• Does MZOLTARyield accurate diagnostic reports under Android device’s constrained envi-ronment?
• Does the integration withLintcontribute to a better diagnostic quality?
To answer to these questions, the purpose of this thesis was to develop a toolset that relies on SFL and Lint, devising a way to combine both dynamic and static analysis. Furthermore, the developed toolset provides visual representations of the diagnostic report(visualizations) that ease the debugging process. These visualizations will present, clearly, the combination between static and dynamic analysis. Finally, an empirical evaluation to assess MZOLTAR’s performance and
verify its applicability to the context of mobile apps was performed.
This way, the developed toolset mitigates some time and reliability constraints faced by devel-opers, increasing the quality of the developed and released mobile applications.
1.4
Document Structure
Besides Chapter 1, the Introduction, this document is composed by six more chapters. Chapter 2 describes the Android platform’s history and architecture.
Chapter 3 aims to present the related work in the mobile applications debugging field. It also presents some automatic fault localization tools and techniques.
Chapter 4 contains the description of the proposed solutions as well as the tools this solutions are based on.
Chapter 5 details the developed toolset as well as its underlying technique. Chapter 6 presents the outcome of the performed empirical study.
Chapter 7 presents the conclusions drawn from this thesis’ work. 4
Chapter 2
Android Operating System
Android is an open source Linux-based operating system targeted for mobile or embedded devices. Typically, Android applications are developed in Java language. However, languages such as C or/and C++ may also be used to compile into native code. Note, that Android reuses the Java language syntax and semantics, but it does not provide the full class libraries and APIs bundled with Java SE. Java development is mainly supported by a comprehensive set of development tools SDK, while native code is supported by the Native Development Kit (NDK). Android applications have a specific lifecycle that differs from the Java regular applications’ lifecycle. Instead of a main function, Android applications’ main components are: Activities; Services; Content providers; Broadcast receivers. Furthermore, Android applications are not only comprised of source files, but also include resource files (mainly related to the specification of layouts and translations) and a manifest file (as mentioned before, responsible to provide the necessary information about the application to behave correctly to the Android system).
2.1
History
Android’s alpha and beta versions where launched in late 2007. Its first commercial version, Android 1.0, was released in 2008. The first Android device, HTC Dream, incorporated this version of the operating system. So far seventeen versions of the API have been released, the most recent being Android 4.2 also known by the code-name Jelly Bean.
As stated by Google, the company who leads the Android open-source project, “Android is an open-source software stack for mobile phones and other devices. (...) The goal of the Android Open Source Project is to create a successful real-world product that improves the mobile expe-rience for end users.”. It is open-source nature and permissive licensing allows manufacturers to freely modify and distribute the operating system with their devices, therefore allowing some flex-ibility in what it touches to compatflex-ibility issues. As the years passed, Android also gathered a big community of developers who willingly modify and even add features to the operating system in
Android Operating System
order to improve the performance of some devices. There is also a big community of Android ap-plications developers, hence Google Play application market as reached the 25 billion downloaded applications and currently has around 700 thousand applications available to download.
In the first quarter of 2013 Android had a market share of 75.0% and according to the its official Engineering team it reached the 500 million devices activated worldwide and about 1.3 million activations per day. On the other hand, Android’s competitors registered smaller shares: Apple’s iOS had a 17.3% while Blackberry, Linux, Symbian and Windows Phone had about 7.7% all together.
2.2
Android Manifest
The manifest file (AndroidManifest.xml) must be present in the root directory of every application. The Android system relies on this file to access file about the application before being able to successfully run it (i.e., if an activity is not declared the system will not be able to run it, if the internet permission is not declared the system will not be able to perform http connections). The manifest is responsible for:
• Declaring an unique identifier for the application (package name); • Describing application components (see Subsection 2.3);
• Determining which processes will host application components;
• Declaring which permissions the application must have to access protected parts of the API and interact with other applications;
• Declaring the permissions that others are required to have to interact with the application’s components;
• Listing the Instrumentation classes that provide profiling and other information as the appli-cation is running;
• Declaring the minimum level of the Android API that the application requires; • Listing the libraries that the application must be linked against;
2.3
Components
As stated before, Android applications have a very specific lifecycle. Their main components are: Activities; Services; Content providers; Broadcast receivers.
An Activity1is the most common application component that provides a graphical user inter-face with which users can interact to perform actions. Examples of Android activities are “dial a
1Android Activities homepage http://developer.android.com/guide/components/activities.
html, 2013.
Android Operating System
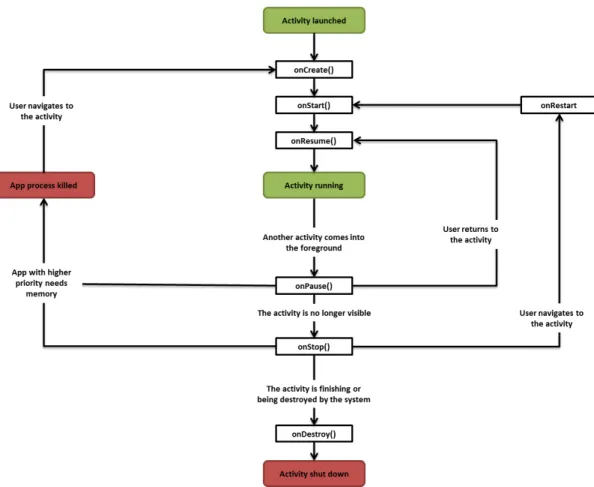
phone number”, “take a photo”, “send an email”, “view a map”, etc. Activities are implemented as a subclass of the Android SDK’s Activity class and can be customized to perform any action requiring user interaction. The lifecycle of an activity (see Figure 2.1) is based on a set of states and the actions performed when the activity changes its state.
Figure 2.1: Android activity lifecycle diagram
onCreate() - Called when the activity is first created. Most activity initialization should be made here, such as UI inflation, data binding or recovery of a previously frozen state. It’s always followed by onStart();
onRestart() - Called after if onStop() was called before the activity starts again. Always followed by onStart();
onStart() - Called when the activity becomes visible to the user. Followed by onResume() if the activity comes to the foreground or onStop() if it becomes hidden;
onResume() - Called when the activity will start interacting with the user. Actions such as an-imations or opening exclusive access-devices (e.g., camera) should be done here. Always followed by onPause();
onPause() - Called when a new activity is launched in front of the previous activity. Persistent data should be saved here. The actions made here must be quick and simple, because the
Android Operating System
new activity will only start when onPause() returns. In most cases this activity is followed by onStop();
onStop() - Called when the activity is no longer visible to the user. This method may only be called when the system does not have enough memory to keep the activity running. It can be followed by onRestart() if the activity becomes visible to the user again, or by onDestroy() if the activity is going to be destroyed by the system;
onDestroy() - Called when the activity is destroyed either by the system or by an explicit call to the finish method.
The state may change when events are triggered. For instance, when an Activity is first cre-ated it will be on the Crecre-ated state, and then its state will be changed to Started. Between any state transition, an action is executed and it can be customized by overriding each of the callback methods in the Activity class. When the activity is created and before setting its state to Created, the onCreate() method will be called and the consequent action will be performed, as well as the onStart()method will be called during the transition between the Created and Started states.
A Service2is an application component intended to perform long-running operations, usually in the background. Examples of services are playing music, perform network operations or to supply functionality for other applications to use. Unlike activities, services do not provide a user interface.
Content providers3 are components that manage access to a structured set of data, as they
encapsulate the data and provide mechanisms to define data security. A content provider is the alternative to an SQLiteDatabase and should be used when multiple applications use the stored data. The encapsulated data is provided to applications through a ContentResolver4 interface. Android itself includes content providers that manage data such as audio, video, images, and personal contact information.
Broadcast Receivers5respond to system-wide announcements, such as a broadcast announc-ing that the screen has turned off, the battery is low, or a picture was captured. Commonly, a broadcast receiver is a gateway to other components and should do a very small amount of work. For instance, it might initiate or an activity a service to perform some work based on the event.
2Android Services homepagehttp://developer.android.com/guide/components/services.html, 2013.
3Android Content Providers homepagehttp://developer.android.com/guide/topics/providers/
content-providers.html, 2013.
4Android Content Resolver homepage http://developer.android.com/reference/android/
content/ContentResolver.html, 2013.
5Android Broadcast Receivers homepage http://developer.android.com/reference/android/
content/BroadcastReceiver.html, 2013.
Android Operating System
2.4
System Architecture
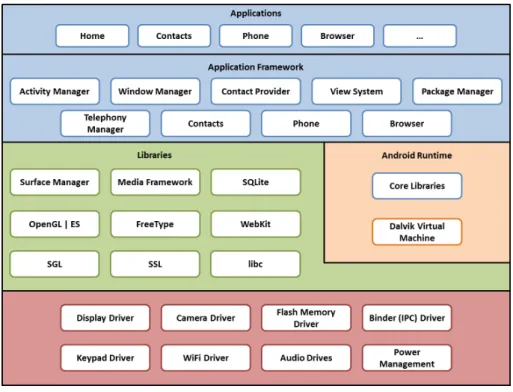
Android is a stack of different layers which includes an operating system, middleware and key applications. Each layer provides different services to the layers just above it. The architecture layers are specified in Figure 2.2.
Figure 2.2: Android system architecture
2.4.1 Applications and applications framework
Android base releases have a set of core applications that are indispensable for the systems proper functioning. Additionally the development framework used to develop the core applications is provided as an open development platform. It allows the developers to take advantage of the device’s hardware and features to their applications benefit.
Although Android applications are written mainly in Java, as referred, there are some points in which Android applications and standard Java applications differ from each other. The differing points are the following:
• Android applications have a specific lifecycle that differs from the Java regular applications’ lifecycle. Instead of having a main function, Android applications are based on activities and each activity transitions between different states in its lifecycle (see Figure 2.1). In order to perform some actions in the state transitions (depending on the needs actions may be performed in different state transitions) the corresponding functions must be overridden. • Some libraries of JavaSE and Android may not be compatible as they may not include all
Android Operating System
• A Java regular application uses Java Virtual Machine (JVM) while Android uses Dalvik Virtual Machine (DVM) (see Section 2.4.3).
• Android uses XML to declare its User Interface (UI) elements while regular Java applica-tions use platforms like SWING or JavaFX.
2.4.2 Libraries
Android includes a set of C/C++ libraries used by various components of the Android system. Developers can access these capabilities through the provided development framework. These capabilities include system libraries, media libraries, graphic libraries, browser, database engine. The libraries are hardware specific. There follow some examples of core libraries of the Android system:
• Surface Manager: composes UI on the screen; • SGL: the underlying 2D graphics engine;
• OpenGL ES: 3D library implemented based on OpenGL ES 1.0 APIs;
• Media Framework: supports playbacks and recording of various audio, video and picture formats;
• Free Type: bitmap and vector font rendering;
• WebKit: browser engine which powers both the Android browser and an embeddable web view;
• libc: implementation of the standard C system library (libc), tuned for embedded Linux-based devices;
• SQLite: relational database engine available to all applications.
2.4.3 Android Runtime
Android Runtime consists of DVM and Core Java libraries. DVM runs Dalvik Executable (.dex) files unlike the JVM that runs .class files. But Java source files are not directly compiled into .dex files. They first are compiled into .class (java bytecode) files and then transformed into .dex files (dalvik bytecode). Dalvik Executable files are optimized to achieve higher efficiency on resource constrained environments like mobile devices. Dalvik was written to allow the running of multiple virtual machines efficiently and, therefore, allow each application to run on its own virtual machine instance, then providing security, isolation, multi-level memory management and threading support.
It is also important to highlight the Android permission mechanism, that enforces restrictions on the specific operations that a particular process can perform or grant access to specific pieces
Android Operating System
of data. Android applications have no permissions associated by default, which prevents the ap-plication from doing anything that would adversely impact the user experience or any data on the device. If any feature uses any method that requires a given permission, that permission must be explicitly specified in the manifest by the developer. Minimizing the required permissions by declaring just the ones the application really needs is a must.
Some of the Java core libraries may not be exactly equal to the JavaSE libraries as they may not include all of the elements of their JavaSE equivalents. For instance the method isEmpty() in-cluded in the java.lang.String class since the 1.5 version of JavaSE launched in 2004 that was only included in version 9 of Android API. Other example is the System.out and System.err streams, which do not provide any output when used in Android, being the use of the android.util.Log class encouraged. Oh the other hand some APIs are exclusive to Android, such as the contacts API.
2.4.4 Linux Kernel
The Linux Kernel it is the lowest layer and acts as an abstraction layer between the hardware and all the architectural layers. There Kernel never interacts directly with the user. Its importance stems from the fact that it provides the following functions in the Android system:
• Hardware Abstraction
• Memory Management Programs • Security Settings
• Power Management Software • Other Hardware Drivers
Android Operating System
Chapter 3
Related Work
When analysing debugging tools, there are two categories that can be taken into account: • manual debugging tools based on a step-by-step execution
• automatic debugging tools on the history of several executions or on expected program behaviour
Debugging Android applications is a manual and not trivial task. Moreover it is a rather time-consuming and error-prone process. Android SDK provides several tools for this purpose, all of them fitting in the manual debugging tools category.
Statistical debugging is type of automated debugging and has been a very active subject of research in the past years. Some automatic fault localization tools like GZOLTAR or Tarantula have been developed, using a SFL approach (see Subsection 3.3.1), and have been proven to be accurate and efficient. Nevertheless, very few has been reported in the area of mobile software.
Despite the myriad of techniques and approaches, there are still shortcomings when applying these techniques in the context of mobile, resource-constrained apps. Available automated fault localization toolsets do not offer easy integration into the mobile apps world. As a consequence, manual approaches are still prevalent in the mobile apps debugging and testing phases, and the debugging tools available for mobile apps only offer manual debugging features [EMK13].
In this chapter, the Android testing framework will be presented along with some debugging tools provided by the Android SDK, as well as some automatic approaches.
3.1
Testing Android Applications
The testing framework provided by Android SDK extends JUnit1with specific features that
pro-vide access to Android system components and ease the implementation of several testing strate-gies [Mil11].
Related Work
Android testing framework also provides an instrumentation framework to control the tested application. With the instrumentation framework is possible to inject mock Android system ob-jects to simulate specific situations.
Test projects are similar to the main applications’ projects. This way the user does not need to learn a new set of tools and can easily design and build tests for the developing application.
Figure 3.1 summarizes the Android testing framework. In this section the instrumentation framework will be analysed, along with MonkeyRunner, Monkey and Robotium tools.
Figure 3.1: Android test framework diagram.
3.1.1 Instrumentation framework
Android instrumentation is a set of control methods or “hooks” in the Android system. With in-strumentation is possible to invoke callback methods that are exclusively controlled by the system and cannot be invoked directly, providing a way to, for example, run through the lifecycle of a component step by step.
Instrumentation also controls the way tests run, by shutting down any previous running in-stances of the main application on the device and controlling the test runner responsible for run-ning the tests.
Related Work
3.1.2 MonkeyRunner
MonkeyRunner is a tool that provides an API to write Python programs that control a device or emulator from outside the application code. The programs run on the developing system and not on the device itself, sending specific events to the device.
The results are presented as UI screenshots and can even be compared to a set of screenshots that are known to be correct.
3.1.3 Monkey
The infinite monkey theorem states that a monkey hitting keys at random on a typewriter keyboard for an infinite amount of time will almost surely type a given text, such as the complete works of William Shakespeare. Monkey is a tool that transposes this theorem to the Android applications’ context. In this context an entity that produces random events on the device could crash the application under test.
Monkey is a command line tool and runs on a device or emulator and generates pseudo-random streams of user events such as clicks, touches, or gestures, as well as a number of system-level events. The tool provides the possibility of performing stress-tests to an application, by using several configurations like event types and frequencies.
3.1.4 Robotium
Robotium2is a test framework created to make it easy to write automatic black-box test cases for Android applications. It simulates touching, clicks, typing, and other UI actions relevant for An-droid applications. The presentation of the results is very similar to the JUnit results presentation (red/green bar to represent failed/passed tests).
To write and run tests with Robotium, no source code is required. With just the apk and minimal knowledge of the application under test it is possible to write solid test cases. The tests are written to follow a given UI flow and assert the properties of some system components.
3.2
Debugging of Android Applications
As stated, Android SDK provides a set of tools that make it possible to debug the developed applications. In this section each one of these tools will be presented and briefly described.
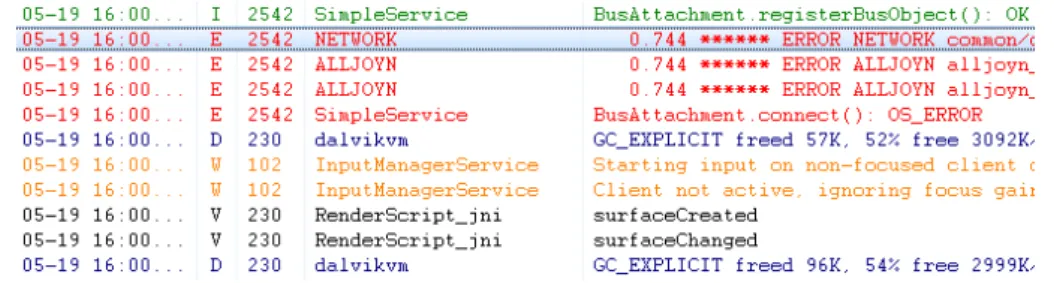
3.2.1 LogCat
The Android logging system, dubbed LogCat, is a way to output information directly from the device and track application events (see Figure 3.2). It can be viewed both from command line through Android Debugging Bridge (ADB) or from Eclipse (or some other external tool that im-plement an interface to ADB). The use of JavaSE system outputs, System.out and System.err, is
Related Work
discouraged in Android, as they are redirected to LogCat (or simply does not display anything in some old versions of Android).
LogCat has several fields and can be displayed in some kinds of formats, depending on its main goal. LogCat fields are the following:
• Time - The time at which the LogCat message was generated in the device • Priority - Indicates the severity of the message
• PID (Process ID) - ID of the process that generated the message • TID (Task ID) - ID of the task that generated the message • Tag - Message tag
• Message - Message content itself
Figure 3.2: LogCat output example
Not only the messages originated in the applications under development are shown, as the Android system itself often outputs its own LogCat messages, in most cases, related with system events. Many types of information is output in the LogCat system and the severity of each mes-sage may differ, thus mesmes-sages can have different priorities. The possible severities for a LogCat message are the following:
• V — Verbose (lowest priority) • D — Debug
• I — Info • W — Warning • E — Error • F — Fatal
• S — Silent (highest priority, on which nothing is ever printed)
Although LogCat is not the most precise debugging tool, as an output system it lets users track specific behaviours or states of an application, thus providing a versatile way for tracking what the application is doing in a specific situation.
Related Work
3.2.2 Android Debugging Bridge (ADB)
ADB is a command line tool included in the Android SDK that plays a very important role in the process of debugging Android applications. It represents a direct connection layer between a device and the developing system.
ADB acts as a intermediary between a device and the developing system, not only providing a tool for managing the devices connected (install/remove applications, sync files) and run a UNIX shell in a given device but also serving as a connection between the device and the developing system itself.
An ADB device daemon runs on the device, while a ADB host daemon runs on the develop-ing system, providdevelop-ing a debugger that connects to this interface a way to collect information to successfully debug an application running on a device or emulator.
3.2.3 Dalvik Debug Monitor Server (DDMS)
DDMS is a graphic debugging tool (see Figure 3.3), both accessible through Eclipse or command line, whose features include:
• Viewing heap usage for a process • Tracking memory allocation of objects
• Working with an emulator or device’s file system • Examining thread information
• Starting method profiling • Using the Network Traffic tool • Using LogCat
• Emulating phone operations and location • Changing network state, speed, and latency • Spoofing calls or SMS text messages • Setting the location of the phone
When it starts, DDMS connects to ADB, then creating a Virtual Machine (VM) monitoring system that notifies DDMS whenever a device is connected or disconnected. As in Android every application runs in its own process, each of which running in its own VM, DDMS opens a connec-tion to each VM’s debugger through the ADB daemon on the device and then assigns a debugging port to each VM. When a debugger connects to one of these ports, all traffic from the associated VM is forward to that port.
Related Work
Figure 3.3: DDMS screenshot
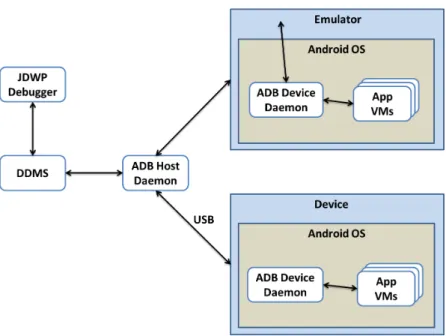
3.2.4 Java Debug Wire Protocol (JDWP) debugger
JDWP is a protocol used for communication between a debugger and a JVM. 1The DVM supports the JDWP protocol to allow debuggers to attach to a VM. Each application runs in a VM and exposes a unique port to which a debugger can be attached to via DDMS. If the goal is to debug multiple applications, attaching to each port might become tedious, so DDMS provides a port forwarding feature that can forward a specific VM’s debugging port to port 8700. It is possible to switch freely from application to application by highlighting it in the Devices tab of DDMS. DDMS forwards the appropriate port to port 8700. Most modern Java IDEs include a JDWP debugger, but a command line debugger, such as jdb, can also be used. Figure 3.4 shows how the various debugging tools work together in a typical debugging environment.
3.2.5 Traceview
A trace graphical viewer that shows trace file data for method calls and times for the developing application, giving useful information that helps profiling its performance. A trace log file, used by traceview, can be generated either by adding tracing code to the application or by DDMS. After the files are loaded, two panels are then provided:
• Timeline Panel (see Figure 3.5) which describes visually when each thread and method started and stopped. Each method is shown in another colour (colours are reused in a round-robin fashion starting with the methods that have the most inclusive time). The thin lines underneath the first row show the extent (entry to exit) of all the calls to the selected method.
Related Work
Figure 3.4: The architecture
• Profile Panel (see Figure 3.6) presents a summary of the time spent in the method. Both the exclusive time (time spent in the method) and inclusive time (time spent in functions called by the method) are presented, as well as the percentage of total time. This panel also presents the number of calls to this method plus the number of recursive calls in the last column.
Figure 3.5: The timeline panel of the traceview tool
Related Work
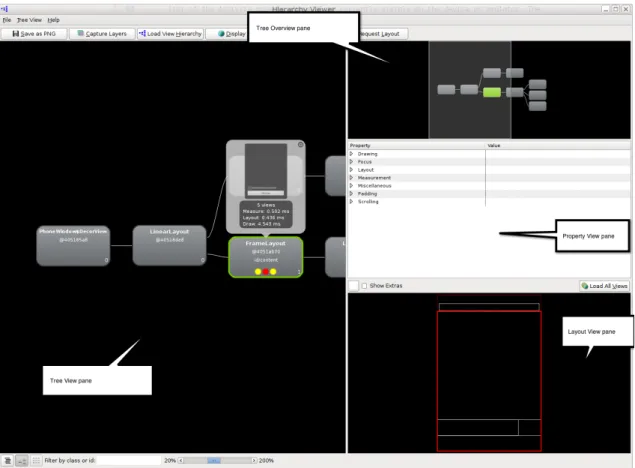
3.2.6 HierarchyViewer
Graphical programs that makes it possible to debug and profile an application’s UI, by providing a visual representation of the layout’s View hierarchy (the View Hierarchy window) and a magnified view of the display (the Pixel Perfect window).
The two panels provided are detailed next:
• View Hierarchy window (see Figure 3.7) displays the View objects that form the UI of the Activity that is running on the device or emulator. It can be used to look at individual View objects within the context of the entire View tree. For each View object, the View Hierarchy window also displays rendering performance data. It is also possible to observe an individual View from the View tree in detail, obtaining more detailed information about it, thus easing the debugging of a specific part of the UI.
Figure 3.7: HierarchyViewer - View Hierarchy window
• Pixel Perfect window displays a magnified image of the screen that is currently visible on the emulator or device. In this window, it is possible to examine the properties of individual pixels in the screen image. It is also possible to use the Pixel Perfect window to help lay out the application UI based on a bitmap design.
Related Work
3.2.7 Lint
Lint3 is a static analysis tool for Android applications. It was introduced in the version num-ber 16 of the Android SDK Tools. It is based on an homonym tool developed at Bell Labs4 in 1977 that flags some suspicious and non-portable constructs (likely bugs) in C language source code. Android’sLintacts on the Java source code used in Android applications and also aims at flagging potential bugs and optimization improvements for correctness, security, performance, us-ability, accessibility, and internationalization. In addition, Android’sLintalso analyses Android specific resources, like layout files or the Android manifest file, to point out problems specific to the platform.
When analysing the source code and the resources of an Android project, Lint performs a series of checks that are associated with specific known issues. Each issue is characterized by three properties
Category
Indicates the nature of the issue, such as Usability, Correctness or Performance. A subcat-egory may also be presented, e.g., Usability:Icons;
Severity
Indicates the impact the issue may represent to the application. There are three levels of severity: Warning (lowest threat), Error and Fatal (highest threat).
Priority
Indicates the priority of the issue. If an issue has a priority of 10 it should be accessed before another issue with priority 6. The priority assumes values between 1 and 10.
Lintgenerates a report with all the errors found after analysing the code. Lint’s proprieties can be customised, to ignore some issues that are not relevant in a project, to change the severity of a specific problem or to add new/customised checks.
3.2.8 A Graphical On-Phone Debugger (GROPG)
Besides the tools provided by the Android SDK, there is another tool that presents a different ap-proach. GROPG5[NCT13] was developed at University of Texas at Arlington and is a on-phone debugger that enables the debugging of the application in real time on the top of the running ap-plication itself (see Figure 3.8). Its biggest advantage is that this approach runs on the device and does not need any interaction with the developing system. GROPG provides traditional debug-ging actions like breakpoints, step into, step over, step out, in-scope variable analysis and thread analysis.
3Linthomepagehttp://developer.android.com/tools/help/lint.html, 2013. 4Bell Labs homepagehttp://www3.alcatel-lucent.com/wps/portal/belllabs, 2013. 5GROPG homepagehttp://cseweb.uta.edu/~tuan/GROPG/, 2013.
Related Work
Figure 3.8: GROPG interface.
3.3
Automated Debugging and Testing
Statistical debugging is a type of automated debugging where statistical models of a program’s success/failure are used to track program bugs. These models expose the correlation between program behaviour and success or failure of an execution. This type of approaches guides the developers to the root causes of the bugs, by correlating program misbehaviours with the failures and presenting the suspiciousness of a given component being faulty.
In this section will be presented a statistical debugging approach, SFL, as well as some statis-tical debugging tools.
3.3.1 Spectrum-based Fault Localization (SFL)
Spectrum-based Fault Localization (SFL) [AZGvG09, AZvG07] is a statistics-based lightweight fault localization technique and it is considered to be amongst the most effective ones [AZGvG09, LFY+06, WWQZ08]. This technique uses a dynamic analysis approach, as it relies on program execution information (program spectrum) from previous runs (passed and failed) to correlate the software components with the observed failures and determine the likelihood of each component being faulty. Passed runs are executions of a program that completed correctly, while failed runs are executions in which an error was detected. A Program spectrum is a collection of data that indicates which components of the software were hit during a run [AZvG07].
The input of the SFL is constituted by the hit spectra and an error-vector (see Figure 3.9). The hit spectra of N runs constitutes a binary N × M matrix A. M represents the instrumented
Related Work
components of the program. The error-vector has N-length and represents the information of which runs passed or failed.
Nspectra Mcomponents a11 a12 · · · a1M a21 a22 · · · a2M .. . ... . .. ... aN1 aN2 · · · aNM error vector e1 e2 .. . eN Figure 3.9: SFL input.
After receiving the input, SFL quantifies the resemblance between each column of the matrix A with the error-vector. The more a column resembles with the error-vector, the greater is the suspiciousness of the corresponding software component being faulty. To do this, SFL relies on similarity coefficients like sJ (Jaccard coefficient), sT (the coefficient used in the Tarantula
tool 3.3.2) and sO (Ochiai coeficient, see Equation 3.1). The latter is considered to be one of the
best performing similarity coefficients for fault localization [AZGvG09]. sO( j) =
n11( j)
p(n11( j) + n01( j)) · (n11( j) + n10( j))
(3.1)
where npq(m) is the number of runs in which a component (m) was hit (p = 1) or not hit (p = 0)
during an execution, and where that execution failed (q = 1) or was successful (q = 0). npq(m) is
formally defined as
npq(m) = |{i | ai j= p ∧ ei= q}| (3.2)
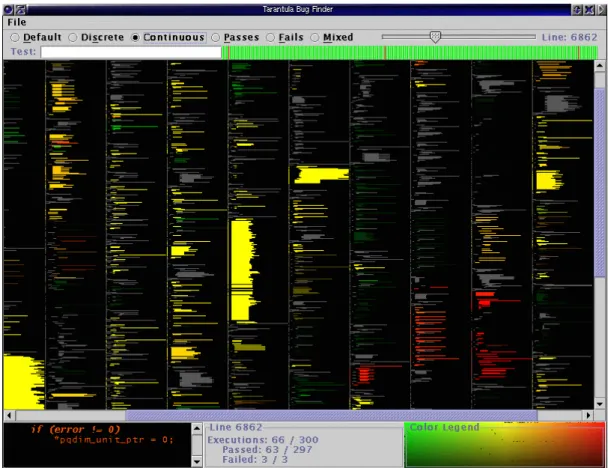
3.3.2 Tarantula
Tarantula6 [JH05] is a tool used to debug projects written in C, developed at Georgia Tech, that relies on SFL. The visual interface is one of Tarantula’s key points (see Figure 3.10), as it high-lights each line of code accordingly to their suspiciousness of being faulty (from red for maximum suspiciousness to green for minimum suspiciousness).
3.3.3 EzUnit
EzUnit7was developed at University of Hagen and is a statistical debugging tool that aims at the debugging of Java projects, using JUnit test cases. It highlights each line of code accordingly to their suspiciousness of being fault (see Figure 3.11), using colours from red (higher suspicious-ness) to green (lower suspicioussuspicious-ness). It also provides a call-graph view that uses the same colour schema (see Figure 3.12).
6Tarantula - Fault Localization via Visualization homepagehttp://pleuma.cc.gatech.edu/aristotle/
Tools/tarantula/, 2013.
7EzUnit – Easing the Debugging of Unit Test Failures homepage http://www.fernuni-hagen.de/ps/
Related Work
Figure 3.10: Tarantula interface
3.3.4 Zoltar and GZOLTAR
Zoltar is a fault localization tool for C/C++ projects (see Figure 3.13) and it has been developed at Delft University of Technology (TUDelft). It was the base of Rui Abreu’s PhD thesis [Abr09] and it won the Best Demo Award prize at The 24th IEEE/ACM International Conference on Auto-mated Software Engineering (ASE’09) with the publication Zoltar: A Toolset for Automatic Fault Localization[JAG09].
GZOLTAR8 [CRPA12] is Java implementation based on Zoltar. It is a framework aimed at debugging Java projects and provides powerful hierarchical and interactive visualizations like sunburst and treemap (see figure 3.14). Like some of the aforesaid tools, GZOLTAR also uses
a colour range from red (most probable cause of failure) to green (least probable cause of failure) and implements SFL with the Ochiai coefficient (Equation 3.1).
Besides fault localization, GZOLTARalso provides a test suit reduction and prioritization tool
dubbed RZoltar. This tool minimizes the size of the original test suite using constraint-based approaches.
The GZOLTAR tool was the base of André Riboira’s MSc thesis [Rib11] and it is the base for the work detailed on this thesis, that aims at adapting this tool to the automatic debugging of Android applications.
8The GZOLTARProject –http://www.gzoltar.com/
Related Work
Figure 3.11: EzUnit ranking.
Related Work
Figure 3.13: Zoltar interface [JAG09].
Figure 3.14: GZOLTAR[CRPA12] overview.
Related Work
3.3.5 Mobile approaches
Attempts to automate the process of testing and debugging mobile apps include the following. Bo Jiang et al. described a statistical fault localization technique for mobile embedded sys-tems [JLG+11], where not only the code is targeted, but also suspicious context providers. By incorporating a fault localization logic into the app, so when it crashes, it is capable of choosing the most reliable context provider. The new context provider is chosen from a list of the same group of providers, ordered based on their suspiciousness score.
A system to automatically and systematically generate input events to exercise smartphone apps and its underlying algorithm, based on a concolic testing approach, are described in [ANHY12]. Moreover, GUI testing in mobile devices is an active research subject [HN11, TKH11, AFT+12, JKK+09].
Pascual et al. used a generic algorithm to automatically generate optimal application config-urations, based on feature model, at runtime [PPF13]. This optimizes the configuration of the system at runtime according to the available resources. The approach does not entail excessive overhead, and helps the app coping with the resource constrained environment and optimizing its performance.
Embedded systems, category in which mobile devices can be fit, were already targeted to measure SFL’s performance in such resource-constrained environments [ZAGvG07]. This study has confirmed that fault diagnosis through analysis of program spectra perform well under harsh conditions and opened corridors to new applications, such as run-time recovery.
Related Work
Chapter 4
Methodologies
To successfully implement the proposed tool, using SFL, several options must be taken into ac-count in each one of its operating phases (see Figure 4.1). In a simplified manner the process is as follows. First the System Under Test (SUT) must be instrumented (Section 4.1) and then the tests must run in order for the tool to be able to retrieve the program spectra (Section 4.2). Finally the tool must analyse the collected data and present the results to the user. Some other analysis can also be included in this process (Section 4.3).
Figure 4.1: Tool execution phases.
In this chapter, the options available for each phase will be presented. Each one of them will be briefly detailed and analysed, trying to find out which one fits best.
4.1
Code Instrumentation
Code instrumentation is a technique used to monitor and analyse runtime information like traces, performance or even code-coverage. It is usually implemented in the form of code instructions
Methodologies
that, for example, output the information or send it to a monitoring tool. There are two types of instrumentation: source instrumentation and binary instrumentation.
Instrumenting is needed to provide the tool with the needed information about the SUT, al-lowing it to yield useful visual information to the user. Two tools, ASM and ASMDex, both using binary instrumentation, were considered for this work and will be presented in this section.
4.1.1 ASM
ASM1is a Java bytecode manipulation and analysis framework [BLC02] and was developed by OW22, an open-source software community. It was designed and implemented for performance and be as small and as fast as possible, which makes it a good option for dynamic systems. ASM can be used to modify classes or generate them dynamically.
ASM was successfully used in GZOLTAR’s implementation, with the same purposes it was considered in this project. This fact represents an advantage given the knowledge obtained with previous usages.
Advantages:
• Experience from previous usage; • JVM is stack-based;
• Well documented api. Disadvantages:
• Lack of usage examples.
4.1.2 ASMDex
ASMDex3 is also a bytecode manipulation and analysis framework and is also developed by OW22. But, unlike ASM, it handles Dalvik bytecode (used by the DVM as explained in Chapter 2) instead of Java bytecode.
There are a few usage differences between ASM and ASMDex, but both are used essentially the same way. Nevertheless, the virtual machines addressed by both tools have specificities that make all the difference between the mentioned tools. While JVM is stack-based, DVM is register-based. This means that, because ASMDex does not provide any automatic register allocation method, there is a possibility of causing program misbehaviour with the injected instructions dur-ing the instrumentation phase. This fact discourages the use of ASMDex, in favour ASM.
Consequently, as detailed in Section 2.4.3, the best approach is to instrument the generated .class files using ASM and let the SDK handle the apk building (and consequent transformation
1ASM - Java bytecode manipulation and analysis framework homepagehttp://asm.ow2.org/, 2013. 2OW2 Consortium homepagehttp://www.ow2.org/, 2013.
3ASMDex - Dalvik bytecode manipulation and analysis framework homepage http://asm.ow2.org/
asmdex-index.html, 2013.
Methodologies
of class files into .dex files). That way, the problems associated with the register allocations are mitigated.
Advantages:
• Centralized file (all classes are in the same .dex file, compressed into de .apk file); • Well documented API.
Disadvantages:
• DVM is register-based; • Lack of usage examples.
4.1.3 JaCoCo Offline Instrumentation
JaCoCo4Offline Instrumentation5was developed to cope with situations where on-the-fly instru-mentation (using an agent) is not suitable, such as:
• Runtime environments that do not support Java agents.
• Deployments where it is not possible to configure JVM options.
• Bytecode needs to be converted for another VM like the Android DVM. • Conflicts with other agents that do dynamic classfile transformation.
With JaCoCo Offline instrumentation, class files must be pre-instrumented and replace the original files. Moreover, a jacocoagent.jarmust be present in the application’s classpath. This file contains the agent responsible for dumping code coverage information to a file or by TCP. The coverage information files created by the agent can be analysed using the JaCoCo API. This instrumentation can replace the EMMA6instrumentation used by the Android Testing frame-work to perform code coverage analysis7. This way, the coverage file is dumped into the device and can easily be retrieved through ADB (see Subsection 3.2.2).
Advantages:
• Coverage information can be dumped to a file or through TCP;
• Replaces the EMMA instrumentation used by the Android Testing framework; • Is updated on a regular basis;
4Acronym for Java Code Coverage.
5JaCoCo Offline instrumentation homepage http://www.eclemma.org/jacoco/trunk/doc/offline.
html, 2013.
6EMMA code coverage homepagehttp://emma.sourceforge.net/, 2013. 7EMMA has not been updated since 2005, while JaCoCo is updated on a regular basis.
Methodologies
• Provides an easy retrieval of the coverage file; • Straightforward analysis through the JaCoCo API. Disadvantages:
• Files must be pre-instrumented;
• .classfiles are instrumented instead of.dexfiles.
4.2
Collection of program spectra
As mentioned in Subsection 3.3.1, a program spectrum is code-coverage information of a given run, used as an input to SFL. Unlike GZOLTAR, where the SUTs are common Java programs,
in this project, the nature of the SUTs and the platform itself represent a considerable amount of restraints. To obtain the program spectra, some options have been considered and will be detailed in this section.
4.2.1 LogCat
LogCat is the Android logging system and it can be used to output specific information throughout the code. It has been detailed in section 3.2.1.
Using the LogCat system as a way to transmit program spectra information to the tool was the first considered option. LogCat seemed like the best solution for this problem as it is fast, getting the output information is not too complicated and the instrumentation required in order to use it is fairly simple. However, after implementing this approach and analysing the results, some dis-crepancies were noticed. These disdis-crepancies were due to the fact that LogCat as a priority-based way of deciding which messages should be shown. So, when any message had an higher degree of priority over the messages originated by the instrumented code, some of the key messages were lost. This would change the results and affect the tool effectiveness. Thus, LogCat approach was dumped and other options have been considered since then.
Advantages:
• good for performance when compared with other approaches; • simple instrumentation;
• simple to get the information. Disadvantages:
• priority-based approach which can discard key information. 32
Methodologies
4.2.2 Sockets
Another one of the weighted approaches was the using of network sockets. The communication between the device and the development system can be made through ADB using an USB cable. A tcp port forward is done so the socket opened in the device can communicate with the server socket opened on the tool and transmit the program spectra information.
Although this is a good approach and it is still at stake, it has a big constraint. For it to be used, it is necessary to inject a new class to the bytecode, where the sockets would be created and the communication with the server would be made. However, synchronization problems are a reality. After Android tests are completed, the system forces the application to shut down, which creates the need to send all the information before that happens. As the network operations cannot be done in the UI thread, they have their own thread, which will be killed along with the application’s process. This set or problems creates serious time and synchronization constraints.
Advantages:
• simple to set up communication between the device and the developing system; • simple to get the information.
Disadvantages:
• fairly complicated instrumentation; • time constraints;
• needs the network or internet permissions declared on the application’s manifest; • synchronization problems.
4.2.3 Files
The creation of files containing the program spectra was another considered approach. It is very similar to the sockets approach. During each test run, a file would be created containing the spec-trum information about a run. After each run, the file would be retrieved through ADB and then analysed. Synchronization would not be a problem, once file operations do not need their own thread in Android. However, new constraints arise. The information contained in the files can, depending on the size of the SUT, occupy a big amount of space, which can be a problem given the known space constraints of mobile devices. On the other hand, the retrieval of the file can represent a performance setback.
Advantages:
• no synchronization problems; • simple to get the information.
Methodologies
Disadvantages:
• performance issues;
• only works on rooted devices; • space constraints.
4.2.4 JTAG Boundary Scan Test
JTAG, or Joint Test Action Group, is the common name for the IEEE 1149.1 [IEE90]. This standard defines circuitry that may be built into an integrated circuit to assist in the test, mainte-nance, and support of assembled printed circuit boards. The circuitry includes a standard interface through which instructions and test data are communicated.
Although JTAG’s early applications targeted board level testing, it is becoming broadly used to debug software that runs in embedded systems. As the OCD (On-chip debugger) is accessible through the JTAG interface, it is possible to retrieve trace information about running applica-tions [JCCR12]. For this purpose is necessary to use a JTAG controller as an intermediate to connect to the system under test.
This approach makes it possible to eliminate the instrumentation, thus it can represent a big performance improvement. Android devices are equipped with JTAG ports that are commonly used by the community to fix devices with hardware problems.
Although this may seem to be a good approach to obtain program spectra, the entailed dis-advantages rushed its disposal. First of all, although Android devices provide a JTAG port it is internal and located in the motherboard and the only possibility of accessing it is by opening the device. That being said, is not possible to use this approach with emulators. Furthermore, the need to use an extra device (JTAG controller) to retrieve the program spectra, would make the tool difficult to access by the common developer, as the said devices are considerably expensive. Advantages:
• Android devices have JTAG ports;
• does not require instrumentation, thus eliminating instrumentation overhead. Disadvantages:
• cannot be used in emulators;
• JTAG port is located on the device’s motherboard, so to access it is necessary to open the device;
• requires an expensive JTAG controller. 34