i
Understanding the Individual-level Digital Divide:
Evidence of an African Country
Glória Eduara Moura Gonçalves
Dissertation presented as partial requirement for obtaining
the Master’s degree in Information Management
ii
NOVA Information Management School
Instituto Superior de Estatística e Gestão de Informação
Universidade Nova de Lisboa
UNDERSTANDING THE INDIVIDUAL-LEVEL DIGITAL DIVIDE:
EVIDENCE OF AN AFRICAN COUNTRY
by
Glória Eduara Moura Gonçalves
Dissertation presented as partial requirement for obtaining the Master’s degree in Information Management, with a specialization in Information Systems and Technologies Management
Co Advisors: Tiago André Gonçalves Félix de Oliveira, Ph.D. Frederico Cruz Jesus, Ph.D.
iii In memory of Avô Rasga.
iv
ACKNOWLEDGEMENTS
I would like to thank my advisors, Professor Dr. Tiago Oliveira and Professor Dr. Frederico Cruz Jesus, for their patience and impeccable supervision.
Many thanks to my parents, brothers, sister, and all family members to whom I owe profound gratitude for the support and participation in my intellectual and personal growth.
To my masters colleagues who collaborated in classes and group works.
I would like to express my particular gratitude to all who contributed to the data collection. A special thanks to the Faculty of Sciences’ community at Agostinho Neto University.
v
ABSTRACT
Digital divide, the differential in access and use of information and communication technologies (ICT) represents an obstacle to the information society, and general wellbeing. This study combines the extended unified theory of acceptance, and use of technology (UTAUT2) (Venkatesh, Thong, & Xu, 2012), Schwartz’s basic human values theory (Schwartz, 1992) and ICT skills to: (1) understand which factors influence ICT acceptance among individuals; (2) explore the role of basic values on ICT acceptance; and, (3) examine how these factors explain the digital divide. The research model was tested in the context of a sub-Saharan country. Empirical results suggest that ICT use is mainly influenced by behavioral intention, habit, and ICT skills. Hedonism, achievement, benevolence, and universalism were the most significant values.
KEYWORDS
vi
RESUMO
A divisão digital, a diferença de acesso e uso das tecnologias da informação e da comunicação (TIC), constitui um obstáculo à sociedade da informação e ao bem-estar geral. Este estudo combina a teoria unificada de aceitação e uso de tecnologia (UTAUT2 - extended unified theory of acceptance,
and use of technology) (Venkatesh, Thong, & Xu, 2012), a teoria de valores humanos básicos de
Schwartz (Schwartz, 1992) e as competências em TIC para: (1) compreender quais fatores influenciam a aceitação das TIC entre indivíduos; (2) explorar o papel dos valores básicos na aceitação das TIC; E, (3) examinar como esses fatores explicam a divisão digital. O modelo de pesquisa foi testado no contexto de um país subsaariano. Resultados empíricos sugerem que o uso das TIC é influenciado principalmente pela intenção comportamental, hábito e as competências em TIC. Hedonismo, realização, benevolência e universalismo foram os valores mais significativos.
PALAVRAS-CHAVE
vii
SUBMISSION
SUBMISSION RESULTING FROM THIS DISSERTATION
PAPER
Gonçalves, G., Oliveira, T, Cruz-Jesus, F. UNDERSTANDING THE INDIVIUAL-LEVEL DIGITAL DIVIDE: EVIDENCE OF AN AFRICAN COUNTRY. (Submission to a Journal)
viii
INDEX
1.
Introduction ... 1
2.
Theorectical background ... 3
2.1.
The concept of digital divide ... 3
2.2.
Prior research on digital divide ... 3
2.3.
Measuring ICT adoption ... 5
2.4.
Adoption models at an individual level ... 6
2.5.
Culture/Values and ICT ... 8
3.
Research Model ... 10
4.
Methodology ... 14
4.1.
Measurement ... 14
4.2.
Data collection ... 14
5.
Results... 15
5.1.
Measurement model ... 15
5.2.
Structural model ... 19
6.
Discussion ... 21
6.1.
Theoretical implications ... 22
6.2.
Practical implications ... 22
6.3.
Limitations and Future Research ... 23
7.
Conclusions ... 24
Bibliography... 25
Appendix A – Prior research on digital divide ... 32
Appendix B – Items list ... 33
ix
LIST OF FIGURES
Figure 2.1 – Schwartz’s theoretical model (Schwartz, 2012) ... 9
Figure 3.1 – Theoretical model ... 10
x
LIST OF TABLES
Table 2.1 – ICT-related technologies previously used to study the digital divide ... 6
Table 2.2 – Summary of studies about adoption models at the individual level to explain
digital divide ... 8
Table 4.1 – Sample characteristics ... 14
Table 5.1 – Loadings and Cross-Loadings ... 16
Table 5.2 – Descriptive statistics, correlations and AVEs ... 18
xi
LIST OF ABBREVIATIONS AND ACRONYMS
AVE Average Variance Extracted
CR Composite Reliability
EU European Union
GPT General Purpose Technology
ICT Information and Communication Technology
IDT Innovation Diffusion Theory
IT Information Technology
ITU International Telecommunications Union
MATH Model of Adoption of Technology in Households
MM Motivational Model
MPCU PC Utilization Model
NEPAD New Partnership for Africa Development
OECD Organization for Economic Cooperation and Development
PC Personal Computer
PLS Partial Least Squares
RQ Research Question
SCT Social Cognitive Theory
SEM Structural Equation Modeling
SNS Social Network Services
TAM Technology Acceptance Model
TPB Theory of Planned Behavior
TRA Theory of Reasoned Action
UNCTAD United Nations Conference on Trade and Development UNDP United Nations Development Program
UTAUT Unified Theory of Acceptance and Use of Technology
1
1. INTRODUCTION
Information and communication technologies (ICT) have become an important part of contemporary society. These technologies can be used for a large range of everyday activities and has affected business, governments and individuals by including new, or modified means of communication and interaction (OECD, 2011). ICT represent an opportunity for both social and economic growth (Doong & Ho, 2012; Xiaoqun Zhang, 2017), but at the same time, inequalities in access and use of ICT can prevent certain groups from exploring these opportunities, to fully participate in society and, thus, create a new group of disadvantaged people. This inequality of access and use is known as the digital divide. In general, digital divide refers to the gap between those who do have access and use ICT and those who do not (Dewan & Riggins, 2005).
The past years have been characterized by unprecedented growth and spread of ICT, however, the digital divide remains, and even seems to be ever widening in some segments (ITU, 2014b). The reasons behind this fact have to do, firstly, because ICT diffusion does not take place uniformly across countries, regions, nor individuals (OECD, 2004; US Department of Commerce, 2002). In second place, ICT include a variety of technologies, not only computers and Internet (Selwyn & Facer, 2007). Hence, these technologies include advanced services and the usage of different types of media which demands the presence of digital skills alongside basic reading and writing abilities (OECD, 2011; van Dijk, 2006). All of these factors are drawing pronounced differences between individuals who have access to new forms of information technology and those who do not. Within this context, understanding the causes behind individual ICT acceptance became a matter of importance which has drawn the attention of both researchers, international organizations and policy-makers. For instance, at the World Summit on the Information Society (2005), it was recognized that ICT is a core basis for an inclusive information society and the importance of measuring ICT development was emphasized. The European Commission, via the Digital Agenda for Europe, defined the role that ICT should play to turn the European Union into “a smart, sustainable and inclusive economy” (European Commission, 2010b, p. 3). The digital divide represents an obstacle that needs to be overcome in order to build a society where everyone can create, access, utilize and share information and knowledge (WSIS, 2005).
Despite the contributions in this research area, there is a lack of studies addressing the digital divide phenomena from the theoretical perspective of technology adoption models (Hsieh, Rai, & Keil, 2008), which is a central research area in information systems literature (Bhattacherjee & Sanford, 2006). To the best of the authors’ knowledge, few studies have used this approach (e.g., Hsieh et al., 2008; Niehaves & Plattfaut, 2014). Nevertheless, these studies usually focus on a specific technology – usually the Internet – and, therefore, do not include all of the ICT extent. Drawing from digital divide literature, technology adoption and personal values, this study aims to understand the drivers that explain the digital divide/ICT acceptance at an individual level in the context of a sub-Saharan country following the suggestion of Venkatesh, Thong and Xu (2012) to test the extended unified theory of acceptance and use of technology (UTAUT2) in other countries and technologies. In the specific context of the digital divide, we find this recommendation of special relevance, as most of the individual-level information technology (IT) adoption studies are held in developed countries. Moreover, according to the United Nations Development Program (UNDP) (2015), Africa in particular sub-Saharan Africa, is the least developed region of the world in terms of income, life expectancy and
2 school attainment. Thus, understanding individual-level digital divide in developing countries is a critical issue to advance the living conditions and welfare of millions of individuals that, currently, most need it. Hence, we intend to answer the following research questions (RQs):
RQ1 – What are the main drivers of individual-level ICT acceptance?
RQ2 – To what extent does UTAUT2 explain the individual level digital divide? RQ3 – Does one’s personal values affect ICT acceptance? And how so?
RQ4 – What measures can be developed by policy-makers of developing countries to
effectively engender ICT acceptance by its individuals?
In answering these questions, the paper is organized as follows: section two has the theoretical background; section three the conceptual model developed in the context of this study; section four includes the methodology, whereas the fifth section has the results. In the sixth section, both theoretical and practical implications are addressed, as also the study limitations, and future research. The conclusions of this paper are in the last section.
3
2. THEORECTICAL BACKGROUND
2.1.
T
HE CONCEPT OF DIGITAL DIVIDESince the publication of the “Falling Through the Net” series reports (NTIA, 1995, 1998, 1999, 2000), the digital divide gained attention and became an important topic among researchers and governments around the world (Hargittai, 2006). Although the origin of the term is still uncertain (Gunkel, 2003), it is frequently associated to the former Assistant Secretary for Communication and Information of the US Department of Commerce’s, Larry Irving Junior.
In the first years, the concept digital divide was commonly understood as the gap between those who have access to ICT and those who do not (Dewan & Riggins, 2005; van Dijk, 2006), where access referred to the possession of a personal computer (PC) and the means to connect the Internet (Dimaggio, Hargittai, Celeste, & Shafer, 2001). Consequently, it was implicit that the digital divide could be solved by simply providing access to ICT (Hsieh et al., 2008). Neglecting the fact that access is just the first step and does not guarantee continued use (Brandtzæg, Heim, & Karahasanović, 2011; Karahanna, Straub, & Chervanny, 1999). Later on, however, as researchers increasingly started to move beyond differences in access, the initial definition was found narrow and the digital divide concept was expanded (van Dijk, 2006). Presently the understanding of this subject includes not only the disparities regarding access, but also in the different ways of ICT use (Brandtzæg, Heim, & Karahasanović, 2011) - named first and second digital divides, respectively (Dewan & Riggins, 2005). Although there is no ultimate digital divide definition, this study considers the one (perhaps) most widely used, provided by the Organization for Economic Cooperation and Development (OECD) which refers to “the gap between individuals, households, businesses and geographic areas at different socio-economic levels with regard to both their opportunities to access information and communication technologies and their use of the Internet for a wide variety of activities” (OECD, 2001, p. 5).
2.2. P
RIOR RESEARCH ON DIGITAL DIVIDEOne stream of digital divide research focus on inequalities across countries, that is, global-level digital divide. To name a few, Cuervo and Menéndez (2006) and Cruz-Jesus et al. (2012) studied the digital divide in the European Union (EU) countries, concluding that digital imbalances reflect the social and economic disparities between Member States. Dewan, Ganley and Kraemer (2010), conducted a cross-country study on the diffusion of PC and the Internet, concluding that the diffusion of these technologies has been slower in developing countries. Brandtzæg et al. (2011) focused on the different patterns of Internet usage across Europe, concluding that most of the citizens were either non- or sporadic users.
Besides the global digital divide, there is also a divide between regions and groups of individuals within countries, that is, the domestic digital divide (Dewan & Riggins, 2005). In this stream of research, the first studies primarily focused on a simplistic and binary perspective of “have” versus “have not” access to ICT. During the 90s a series of surveys in the United States highlighted these inequalities particularly on computer and Internet adoption (Selwyn, 2006). Statistical data regarding PC and Internet penetration were collected and analyzed under socio-economic and demographic points of view, taking into consideration factors such as: gender, age, ethnicity, income and
4 education (see, e.g., Hoffman & Novak, 1998; NTIA, 1995, 1998, 1999; Payton, 2003). A great part of these studies concluded that the inequality of access was mostly driven by the differences in income and education levels. Also, these studies pointed out that individuals belonging to minority ethnical groups were less likely to have access to ICT.
Afterward, researchers began to focus on use behavior once access had been granted (Attewell, 2001; NTIA, 2000; Payton, 2003). It was found that people used technology mostly for educational purposes and as a communication tool (NTIA, 1999). Similarly, to what happened with access, education and income ended up being the main predictors of ICT use. Bonfandelli (2002) asserted that people with higher education use the Internet in an instrumental way, while people with lower education use Internet mostly for entertainment purposes. Regarding level of income, Eamon (2004) concluded that poor youth are likely to use computers for productive purposes as often as non-poor youth. Researchers also demonstrated that technology adoption models may be able to provide better understanding of digital divide especially, when analyzed under a socio-demographic perspective, taking into consideration already familiar factors such as: gender, age, ethnicity, income and education. For instance, Hsieh et al. (2008) decomposed the theory of planned behavior (TPB) to understand user acceptance of ICT between socio-economically advantaged and disadvantaged. These authors showed that different factors affect continued use intention for both groups, where attitude and hedonic outcomes were more influential for disadvantaged people. Niehaves and Plattfaut (2014) studied age-related digital divide in the adoption of the Internet by the elderly by comparing two theories, the model of adoption of technology in households (MATH), and the unified theory of acceptance and use of technology (UTAUT). Both UTAUT, and MATH were able to explain Internet adoption. Nevertheless, MATH had a superior explanatory power, while UTAUT had a greater feasibility. More recently, the digital divide debate has been focused in another dimension, the necessary skills in using ICT. A study by van Dijk (2006) showed how the digital divide is shaped by four types of access: motivational, physical, skills, and usage. Whereas the first three are necessary conditions for actual technology use. The skills access includes the possession of three types of digital skills: operational, information, and strategic. According to the author, at least in developed countries, the access divide is closing whereas the skills divide tends to increase. In a study regarding the divide among Web content creation, Correa (2010) hypothesized that online skills are related to greater levels of content creation, however, skills are found not to be significant when perceived competence, meaning feeling able to perform a task regardless of the skills, was considered. The results of a study by Ferro, Helbig and Gil-Garcia (2011), showed that IT literacy influences Internet use more than income, age, and having a home PC. For these authors, IT literacy can be seen, at the same time, as a factor of the digital divide and a division itself.
This line of research showed that the digital divide is a broader and more complex subject than mere technology access. It is a multidimensional phenomenon that requires deep analysis (Cuervo & Menéndez, 2006) of the social, cultural and psychological causes behind it (van Dijk, 2006). There is not one digital divide (Gunkel, 2003), it exists in many forms between: individuals, countries, regions (Dragulanescu, 2002) and may even exist between different organizations as Dewan and Riggins (2005) asserted. In this study, the digital divide is analyzed from a technology adoption perspective where the behavior of interest is the use of ICT once access had been granted (i.e. second order digital divide). For a comprehensive literature review please see Appendix A.
5
2.3. M
EASURINGICT
ADOPTIONConsidering the fact that digital divide is characterized by the differences in ICT adoption, by being able to understand them, we will be able to shed some light on the subject. Weber and Kauffman (2011) defined ICT as “technologies that support data and information processing, storage and analysis, as well as data and information transmissions and communication via the Internet and other means“ (p. 684). Accordingly, some authors (e.g., Cruz-Jesus et al., 2012; Cuervo & Menéndez, 2006; Doong & Ho, 2012) conceptualized ICT as a general purpose technology (GPT), meaning innovations with the potential to impact a wide range of sectors in a society (Guerrieri & Padoan, 2007). These technologies are characterized by their pervasiveness of use and technological dynamism. According to Selwyn and Facer (2007), there is a broad and a diverse range of technologies that can be considered as ICT, including goods and services (UNCTAD, 2011). From these perspectives, ICT can be seen as a diverse set of technologies that enable information processing and communication by electronic means which can be used for a wide range of everyday activities and has a constantly changing landscape.
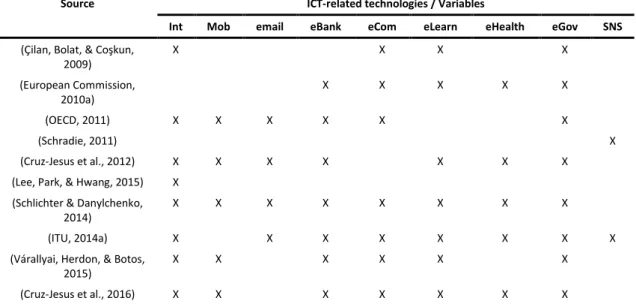
Considering the complex and dynamic nature of ICT, measuring its adoption is a challenging task (Cruz-Jesus et al., 2012). The pervasiveness of ICT in almost every aspect of our society (e.g., social, economic, political, cultural) (OECD, 2011), as well as the wide variety of frameworks (Schlichter & Danylchenko, 2014) creates serious difficulties. Some of the existing conceptual measurement frameworks were developed by international organizations such as the International Telecommunications Union (ITU), the OECD, the United Nations Conference on Trade and Development (UNCTAD) and the World Bank (ITU, 2014a) with the aim of explaining ICT adoption, using several indicators regarding ICT infrastructure, access and use, to calculate composite indices which indicate the level of ICT adoption of a country. Another approach found in the literature is the use of multivariate methods to assess the complexity of ICT development (Cruz-Jesus, Vicente, Bacao, & Oliveira, 2016; Cuervo & Menéndez, 2006). At an individual level, studies concerning ICT acceptance usually focus on a single technology or a small group of technologies. For instance, Liao, Chen and Yen (2007) addressed the continued use of online services; Andrade and Doolin (2016) conducted a study to understand how Internet and social media influence social inclusion of refugees in New Zealand. However, some authors (e.g., Billon, Marco, & Lera-Lopez, 2009; Cruz-Jesus et al., 2012) argued that a single technology is not enough to study ICT adoption. Thus, to achieve a better understanding ICT is conceptualized considering several technologies. In order to select the ICT-related technologies an analysis of previous studies was conducted (please see Table 2.1). Even though some of these variables were used in global level analysis, they derived from aggregated data of individuals.
6
Source ICT-related technologies / Variables
Int Mob email eBank eCom eLearn eHealth eGov SNS
(Çilan, Bolat, & Coşkun, 2009) X X X X (European Commission, 2010a) X X X X X (OECD, 2011) X X X X X X (Schradie, 2011) X (Cruz-Jesus et al., 2012) X X X X X X X
(Lee, Park, & Hwang, 2015) X (Schlichter & Danylchenko,
2014)
X X X X X X X X
(ITU, 2014a) X X X X X X X X
(Várallyai, Herdon, & Botos, 2015)
X X X X X X
(Cruz-Jesus et al., 2016) X X X X X X X
Table 2.1 – ICT-related technologies previously used to study the digital divide
The Internet, a key aspect for societal activity (European Commission, 2010a), is often used in literature to measure ICT adoption (Cruz-Jesus et al., 2012; ITU, 2014a; OECD, 2011). According to Doong and Ho (2012), the number of individuals using mobile devices to access the Internet has grown. Lee et al. (2015) even stated that smartphones have emerged as a new dimension of the digital divide. E-mail has been a common solution for communication (Andrade & Doolin, 2016). For these reasons, regular Internet use (Int), the use of mobile devices to access the Internet (Mob), and sending/receiving e-mails (email) are considered in our study. Consistent with the literature (Cruz-Jesus et al., 2012; ITU, 2014a; OECD, 2011), e-banking (eBank), e-commerce (eCom), e-learning (eLearn), e-health (eHealth), and e-government (eGov) are also considered, since they represent some of the most advanced electronic services (European Commission, 2010a). According to ITU (2014b) more and more people are participating in the information society by using social media in both developed and developing countries. Therefore, the use of social network services (SNS) is also considered as part of general-ICT adoption.
Regarding the selected technologies, although we acknowledge that our set is not exhaustive in terms of representing all multiple facets of ICT, we believe that it successfully reflects the pervasiveness of ICT in different sectors of society.
2.4. A
DOPTION MODELS AT AN INDIVIDUAL LEVELOriginally from a psychology, sociology, and information systems point of view, technology adoption has been extensively studied and several theories and models have been proposed (Venkatesh, Morris, Davis, & Davis, 2003) in order to explain attitudes and behavior towards technology (Agarwal & Karahanna, 2000). According to Qingfei, Shaobo and Gang (2008), the most influential among several models at an individual level that have been developed, include the theory of reasoned action
(TRA) (Fishbein & Ajzen, 1975), TPB (Ajzen, 1991), the technology acceptance model (TAM) (Davis,
1989), and most recently UTAUT (Venkatesh et al., 2003). All these theories are based on the concept that individual reactions lead to intention to use a particular technology which in turn, lead to actual use (Venkatesh et al., 2003).
7 Venkatesh et al. (2003) developed the UTAUT based on eight prominent previously established theories: TRA, TAM, motivational model (MM) (Davis, Bagozzi, & Warshaw, 1992), TPB, PC utilization model (MPCU) (Thompson, Higgins, & Howell, 1991), innovation diffusion theory (IDT) (Rogers, 1995), social cognitive theory (SCT) (Bandura, 1986), and combined TAM and TPB (C-TAM-TPB) (Taylor & Todd, 1995). UTAUT proposes four constructs, three of which are main determinants of intention to use, namely: performance expectancy, effort expectancy, and social influence; while the fourth, facilitating conditions jointly with behavioral intention are theorized to direct influence usage behavior (Venkatesh et al., 2012). In addition, four moderating variables which affect the relationship between the constructs and the dependent variables are considered, namely: age, gender,
experience, and voluntariness of use. Since its publication, UTAUT has been applied in a wide variety
of studies to explore technology adoption (Venkatesh, Thong, & Xu, 2016). It was applied in different technologies such as mobile commerce (Qingfei et al., 2008), tablet (Magsamen-Conrad, Upadhyaya, Joa, & Dowd, 2015), Internet banking (Martins, Oliveira, & Popovic, 2014), mobile banking (Zhou, Lu, & Wang, 2010), and e-government (Kurfalı, Arifoğlu, Tokdemir, & Paçin, 2017) with different control factors. For instance, Niehaves and Plattfaut (2014) also used this same model to explain age-related digital divide focusing on Internet adoption by the elderly. Although UTAUT was considered one of the most important theories of IT adoption (Qingfei et al., 2008), it has some limitations (Baptista & Oliveira, 2015). In 2012 Venkatesh et.al. (2012) proposed UTATU2, which extends UTAUT to consumer acceptance, and use context. The UTAUT2 model incorporates three new constructs:
habits, hedonic motivation, and price value. According to UTAUT2 performance expectancy, effort
expectancy, social influence, hedonic motivation, and price value are hypothesized to have direct relationship with the dependent variable behavioral intention, while facilitating conditions, and habit have direct influence in both behavioral intention, and use behavior. The model also abandons voluntariness as a moderating variable, keeping only age, gender, and experience from the previous UTAUT.
Table 2.2 summarizes some of the research based on the theories previously mentioned that address digital divide, only three studies emerge (Chen, Lin, & Lai, 2010; Hsieh et al., 2008; Niehaves & Plattfaut, 2014) and none have analysed more than one technolgy. Hence, our study intends to help bridge the gap in the literature.
Study objectives ICT under study
Theories Variables Findings Authors
Investigate differences in the factors affecting continued use intention of Internet TV among socio-economically advantaged and disadvantaged groups
Internet TV TPB Internet TV continued use intention, attitude, hedonic outcomes, utilitarian outcomes, subjective norms, family relatives friends and peers' influence,
governmental influence, perceived behavioral control, self-efficacy, perceived ease of use, availability, personal network exposure, Internet PC ownership
Attitude has a stronger influence on Internet TV continuance use intention. Social network affects post-implementation and acceptance of Internet TV (Hsieh et al., 2008) Investigate China’s rural digital divide
Internet TPB Utilitarian outcomes, hedonic outcomes, perceived risk, social network influence, government influence, self-efficacy, availability, attitude, subjective norms, perceived behavioral control, continued
Hedonic outcomes are important to shape attitudes toward Internet continued use intention. Perceived risk exerted significant impact for rural residents.
(Chen et al., 2010)
8 use intention
Understand the age-related digital divide
Internet UTAUT and MATH
Behavioral intention to adopt Internet, performance expectancy, effort expectancy, social influence, education, gender, income, age
The added socio-demographic variables increase the coefficient of determination of the models. Education has a positive effect on Internet adoption
(Niehaves & Plattfaut,
2014)
Table 2.2 – Summary of studies about adoption models at the individual level to explain digital divide
2.5. C
ULTURE/V
ALUES ANDICT
Some studies (e.g., Baptista & Oliveira, 2015; Srite & Karahanna, 2006; Udo, Bagchi, & Kirs, 2012) have pointed out the significant role that cultural factors play in technology adoption. According to Zhang and Maruping (2008), the most popular conceptualization of culture among researchers has been the work developed by Hofstede (1980) which classifies countries along four cultural dimensions: individualism/collectivism, power distance, uncertainty avoidance, and masculinity/femininity. Srite and Karahanna (2006) examined the espoused cultural values on technology acceptance. They posit that national culture impacts individuals’ cultural values, and subsequently affects technology acceptance. Similarly, Udo et al. (2012) studied the role of espoused cultural values on e-services acceptance. Baptista and Oliveira (2015) used cultural factors to explain mobile banking acceptance in Mozambique. These authors concluded that cultural moderators were an important driver of behavior intention over use behavior. However, according to Smith (2002) culture is made up by individuals, and comprises a set of shared values. Bagchi et al. (2015) asserted that while cultural factors are variables in which groups differ, values are variables in which individuals differ. Values serve as the basic criteria in which individuals select and justify actions and events (Schwartz, 1992). Furthermore, values are beliefs that refer to desirable goals that motivate action (Schwartz, 2012).
Schwartz developed a theory at the individual level concerning basic values that people, in all cultures, presumably recognize (Schwartz, 2012). The theory of basic human values (Schwartz, 1992) identifies 10 motivationally distinct types of values namely: self-direction, stimulation, hedonism,
achievement, power, security, conformity, tradition, benevolence, and universalism. These values are
grouped into four high-level values: self-enhancement, openness to change, self-transcendence, and
conservation (please see Figure 2.1). Where openness to change refers to readiness, and openness to
new experiences; conservation emphasize order, preservation and avoidance to change; self-enhancement relates to success and dominance; and self-transcendence concerns the welfare of the others. In addition, the theory specifies the dynamic relations among each value in a circular structure. Adjacent values are compatible and opposite values conflict with each other forming a motivational continuum. For instance, openness to change values contrasts with conservation, self-enhancement values contrasts with self-transcendence values. The tradeoff among competing values serves as guiding principles in life (Schwartz, 1992). In 2012, the theory of basic human values was refined, as Schwartz et al. (2012) proposed a larger and more conceptually detailed set of values, where some values were partitioned into two or more subtypes.
9 Figure 2.1 – Schwartz’s theoretical model (Schwartz, 2012)
The values theory has for example, been used to study: political preferences, environmental attitudes, and human rights (Davidov, Schmidt, & Schwartz, 2008). Nevertheless, few studies applied this theory in technology adoption. For instance, in a study about the most influential experiences in successful and unsuccessful technology adoption Partala and Saari (2015) found that values (except security) are related to successful technology adoption. Bagchi et al. (2015) developed a model using the Schwartz values framework to study Internet use. They concluded that personal values affect Internet use, with the exception of the power value, which ended up being not influential.
10
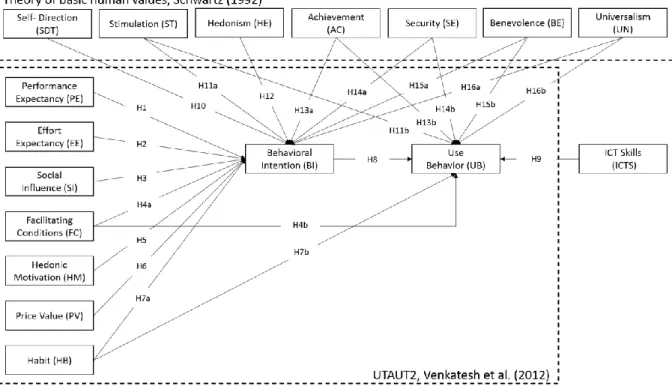
3. RESEARCH MODEL
An integrated model (please see Figure 3.1), combining constructs from UTAUT2, the Schwartz basic human values theory, and ICT skills, serves as theoretical lenses for understanding the individual level ICT acceptance/digital divide behavioral intention and behavior. According to Baptista and Oliveira (2015), UTAUT2 provides a better explanation of variance for both behavioral intention and technology use than its predecessor, which was considered the most complete model to predict technology adoption (Martins et al., 2014). Thus, the UTAUT2 model is used in this study. Considering that ICT is characterized by the perceived social impact, due to the facts that have changed individuals’ lifestyles (European Commission, 2010a), and the digital divide is considered in the literature as a social phenomenon (Dewan & Riggins, 2005; OECD, 2011). In order to provide a deeper understanding of ICT’s individual acceptance, we believe that the values concept which is an important construct in social sciences and all the areas concerned with human behavior (Schwartz, 1992), provides new insights into technology acceptance, since values has been considered in psychology literature as one of factors that influence behavior (Bardi & Schwartz, 2003). Therefore, Schwartz’s basic values are also used in the model.
Figure 3.1 – Theoretical model
Performance expectancy is defined as the degree to which an individual believes that a particular technology will enhance personal performance (Venkatesh et al., 2003). It reflects the perception of utility gained from using ICT. For instance, performance expectancy was found to have great influence on Internet adoption (Niehaves & Plattfaut, 2014) and mobile banking (Baptista & Oliveira, 2015), specific applications of ICT and, thus, associated with the concept of digital divide. Therefore, we hypothesize:
11 Effort expectancy is the degree of ease associated to the use of technology (Venkatesh et al., 2003). According to Agarwal and Karahanna (2000), individuals are more likely to interact with technology if they perceive that they will expend little effort. Moreover, in research about the digital divide, it is often argued that the easier the use of ICT is, the likelier one is to use them (Cruz-Jesus et al., 2016; Hsieh et al., 2008), which is in the realm of considering education as an important aspect of digital inequalities. It is natural for one to hypothesize that the less complex ICT seem to one person, the more prone it is that same individual to use them. Therefore, we hypothesize:
H2. The influence of effort expectancy (EE) on behavioral intention (BI) will be positive.
Social influence represents the degree to which an individual perceives it to be important that others (e.g., family and friends) believe he or she should use a particular technology (Venkatesh et al., 2003). Earlier studies found for instance, that social influence affects household PC adoption (Venkatesh & Brown, 2001) and Internet (Niehaves & Plattfaut, 2014) which are some specific examples of ICT. Moreover, in developing countries, the importance of others in individual decisions is high (Venkatesh & Sykes, 2013). Therefore, we hypothesize:
H3. The influence of social influence (SI) on behavioral intention (BI) will be positive.
Facilitating conditions defines the degree to which an individual believes that the resources and support to use a particular technology are available (Venkatesh et al., 2012). Regarding ICT, facilitating conditions entails aspects such as, technical infrastructure, material resources, and necessary knowledge to use it. Individuals that have access to adequate conditions are more likely to adopt ICT (Venkatesh et al., 2012). According to these authors facilitating conditions have a direct influence on both behavioral intention and use behavior. Therefore, we hypothesize:
H4a. The influence of facilitating conditions (FC) on behavioral intention (BI) will be positive. H4b. The influence of facilitating conditions (FC) on use behavior (UB) will be positive.
Hedonic motivation is conceptualized as the perceived pleasure derived from using a technology (Venkatesh et al., 2012). Earlier digital divide research found that entertainment purposes are important for ICT acceptance, especially for individuals with lower socioeconomic status (Bonfadelli, 2002; Hsieh et al., 2008). Van der Heijden (2004) concluded that perceived enjoyment is a stronger determinant of use intention. Therefore, we hypothesize:
H5. The influence of hedonic motivation (HM) on behavioral intention (BI) will be positive.
Price value is defined as the tradeoff between benefits and monetary value (Venkatesh et al., 2012). Price value is positive when the benefits of using the technology are perceived to be greater than the cost associated to it (Venkatesh et al., 2012). As shown in literature review, cost related factors have been one of the main drivers of uneven ICT adoption. However, given the potential value of ICT, the perceived benefits may be more important. For instance, in a study about web-enabled cell-phones (Setterstrom, Pearson, & Orwig, 2013) it was found that perceived value had a positive influence on acceptance intention. Therefore, we hypothesize:
H6. The influence of price value (PV) on behavioral intention (BI) will be positive.
Habit refers to the extent which a person tends to perform a specific behavior automatically because of learning (Limayem, Hirt, & Cheung, 2007; Venkatesh et al., 2012). The pervasiveness of ICT in many aspects of individuals’ lives (e.g., professional, social, economic) may trigger the automatic behavior to use ICT. According to Venkatesh et al. (2012) habit has both a direct effect on use
12 behavior and an indirect effect through intention, likewise, Baptista and Oliveira (2015) found that habit is significant in explaining mobile banking intention and use . Therefore, we hypothesize:
H7a. The influence of habit (HB) on behavioral intention (BI) will be positive. H7b. The influence of habit (HB) on use behavior (UB) will be positive.
According to Venkatesh et al. (2003) behavioral intention has a positive influence on use behavior. Which is consistent with other theories as seen in literature review. Therefore, we hypothesize:
H8. The influence of behavioral intention (BI) on use behavior (UB) will be positive.
The use of ICT require certain knowledge and skills to be able to work with them (van Dijk, 2006). According to Pavlou and Fygenson (2006), personal skills and knowledge is a major antecedent of behavior. Moreover, according to ITU (2015), skills are critical to determine the effective use of ICT. ICT-related skills found to have positive effect on Internet use (Ferro et al., 2011). Therefore, we hypothesize:
H9. The influence of ICT skills (ICTS) on use behavior (UB) will be positive.
Drawing on the conceptual definitions from both the original and the refined theory of basic values, we identified values that may be particularly relevant to the context of ICT acceptance. Self-direction is defined as the independent thought and action of choosing, creating and exploring (Schwartz, 1992). It derives from autonomy and represents the creativity, freedom, and curiosity of an individual. The motivational goals behind stimulation are novelty, excitement and change in life (Schwartz, 1992). These two values fall under the openness to change grouping, which encourages pursuing new experiences, ideas and challenges. Due to the changing nature of technology, these values seem to relate positively to ICT acceptance. The sense of curiosity of both values is likely to relate with the willingness to try ICT, and the challenge goal behind stimulation may also affect the effective use of ICT. Bagchi et al. (2015) found that self-direction and stimulation positively correlated with Internet use. Therefore, we hypothesize:
H10. The influence of self-direction (SDT) on behavioral intention (BI) will be positive. H11a. The influence of stimulation (ST) on behavioral intention (BI) will be positive. H11b. The influence of stimulation (ST) on use behavior (UB) will be positive.
Hedonism emphasizes the pursuit of pleasure and enjoying life. It is defined as pleasure or sensuous gratification for oneself (Schwartz, 1992), thus it is conceptually different from hedonic motivation. ICT, more specifically Internet and mobile Internet, further social interactions and offer entertainment activities (van Deursen, van Dijk, & Ten Klooster, 2015), which may be appealing for an individual who values enjoyment. Therefore, we hypothesize:
H12. The influence of hedonism (HE) on behavioral intention (BI) will be positive.
Grouped under self-enhancement, achievement and power are primarily concerned with one’s own interests. Achievement is conceptualized as the personal success through the demonstration of competence according to social standards (Schwartz, 1992). It underlines social approval and expresses the desire to be judged by others as successful (Schwartz et al., 2012). Power represents the individual needs for dominance and control over people and resources (Schwartz, 1992). This suggests that people who value power are concerned with the pursuit of material goods and imposing one’s will, while pursuing achievement can be seen as a way to promotes one’s capabilities which can be related to the expectation of growth and personal development that ICT represents. Therefore, we hypothesize:
13
H13b. The influence of achievement (AC) on use behavior (UB) will be positive.
Contrasting with openness to change, there are conservation values, which stress self-restrictions, order and avoidance to change (Schwartz et al., 2012). The security value highlights safety of society and of self (Schwartz, 1992). Conformity is defined as restraint of actions and inclinations most likely to violate social expectations or norms (Schwartz, 1992). Tradition is related to commitment, respect and acceptance of ideas that culture or religion imposes (Schwartz, 1992). From the three, tradition has a strong opposition to openness to change, since it would limit autonomy and freedom (Schwartz et al., 2012). However, in the context of ICT, concerns about security may undermine their use. Security was considered important in e-government (Gupta, Dasgupta, & Gupta, 2008), mobile banking (Wu & Wang, 2005) and Internet use (Bagchi et al., 2015). Therefore, we hypothesize:
H14a. The influence of security (SE) on behavioral intention (BI) will be negative. H14b. The influence of security (SE) on use behavior (UB) will be negative.
Self-transcendence values have a social focus. Benevolence emphasizes the preservation of the welfare of one’s close group (Schwartz, 1992). It also promotes close emotional bonds and relationships. Universalism focuses more on tolerance and protection for the welfare of all people and for nature (Schwartz, 1992). Those who pursue self-transcendence values prefer the group at the expense of the individual, which suggests that they are less likely to adopt new technologies. Since, according to Bagchi et al. (2015) “individualism contributes to ICT adoption”. Moreover, in the majority of developing countries personal interaction is considered very important. Therefore, we hypothesize:
H15a. The influence of benevolence (BE) on behavioral intention (BI) will be negative. H15b. The influence of benevolence (BE) on use behavior (UB) will be negative. H16a. The influence of universalism (UN) on behavioral intention (BI) will be negative. H16b. The influence of universalism (UN) on use behavior (UB) will be negative.
14
4. METHODOLOGY
4.1. M
EASUREMENTAn English questionnaire based on the research model was developed. The items and scale were adapted from prior literature. The UTAUT2 constructs were adapted from Venkatesh et al. (2012). Use behavior was adapted from Venkatesh, Brown, Maruping and Bala (2008) and both frequency and intensity of use were measured. The values constructs were adapted from Schwartz et al. (2012). A seven-point range scale anchored from totally disagree (1) to totally agree (7) was used to measure most of the items, with the exception of the Schwartz values items which used a six-point scale ranging from not like me at all (1) to very much like me (6). To measure ICT skills, the items of e-skills module of the EUROSTAT survey on ICT usage in households and by individual’s version 3.2 were used. Yes-no questions were used to ask participants about the activities carried out in the last 12 months. For more details, please see Appendix B. Demographic questions about age, gender and education were also included. Age was measured in years. Gender was coded as a dummy variable where women were represented by 0. Education was measured by degrees.
4.2. D
ATA COLLECTIONTo test the research model, we collected data from Angola. Since the questionnaire was administrated in Portuguese, the official language of Angola, the items were independently translated by a professional translator. Empirical data was collected via a self-administrated survey, designed with the Portuguese version of the questionnaire. First, the survey was pretested among a group of 30 individuals who were not included in the final data. Preliminary analysis demonstrated that items were valid and reliable. Overall, we managed to collect 479 responses, from which after excluding incomplete cases, 245 were kept in the final sample. The common method bias was examined using Harman's one factor test (Podsakoff, MacKenzie, Lee, & Podsakoff, 2003). The first factor explains 32.9% of variance, evidence of no significant common method bias. Further, we applied the marker variable technique (Lindell & Whitney, 2001; Malhotra, Kim, & Patil, 2006) to test for common method biases. No significant common method bias found in our dataset.
The respondents’ characteristics are shown in Table 4.1. Males (76%) outnumber females (24%). The majority of the respondents were younger than 30 years old (78%). Concerning education, more than 67% claimed to have a bachelor degree.
Variable Value Frequency %
Gender Male Female 186 59 75.9 24.1 Age 18-30 31-40 41-50 >51 191 32 19 3 78 13 7.8 1.2 Education Lower than Bachelor
Bachelor Master or higher 62 166 17 25.3 67.8 6.9 Table 4.1 – Sample characteristics
15
5. RESULTS
Partial least squares (PLS) was used to test the research model. PLS is a component-based approach to structural equation modeling (SEM) (Chin, 1998). This method is suitable for complex models and for prediction-oriented research (Hair, Ringle, & Sarstedt, 2011; Henseler, Ringle, & Sinkovics, 2009). Therefore, PLS can be considered appropriate for this study. Data analysis was conducted in two stages as recommended by Anderson and Gerbing (1988). First, the measurement model was examined to assess reliability and validity of the instrument, followed by the assessment of the structural model. SmartPLS 3 software (Ringle, Christian M., Wende, Sven, & Becker, 2015) was used for this purpose.
5.1. M
EASUREMENT MODELThe measurement model was assessed regarding construct reliability, indicators reliability, convergent validity, and discriminant validity. The constructs were modelled using reflective indicators.
The results of the measurement model are presented in Table 5.1 and 5.2. To evaluate internal consistency reliability two measures can be used, Cronbach’s alpha and composite reliability (CR). Cronbach’s alpha provides an estimate for reliability based on the indicators intercorrelations and assumes that all indicators are equally reliable (Henseler et al., 2009). Unlike Cronbach’s alpha, CR takes into account that indicators have different loadings, thus making it more appropriate for PLS, which prioritizes indicators according to their reliability (Hair et al., 2011; Henseler et al., 2009). As seen in Table 5.1, all composite reliability values are higher than 0.70, providing evidence of construct reliability. Individual indicator reliability was evaluated based on factor loadings, which should preferably be higher than 0.70 (Chin, 1998) and indicators with loadings below 0.40 should be eliminated (Hair et al., 2011). Based on Table 5.1 we can conclude that indicators reliability is adequate.
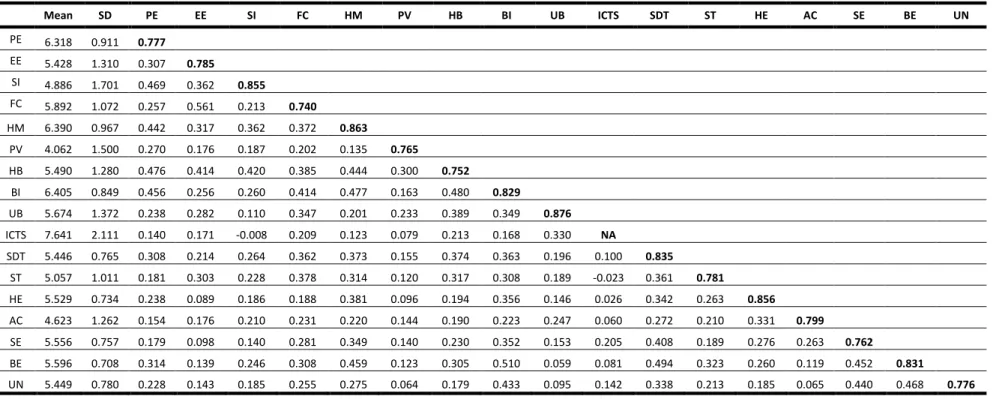
Values of the average variance extracted (AVE) are above 0.50, meaning that the latent variable explains more than half of variance of its indicators (Hair et al., 2011; Henseler et al., 2009). Thus, ensuring convergent validity. Discriminant validity was assessed using three criteria. First, the square root of AVE should be greater than the correlations between constructs (Fornell & Larcker, 1981; Henseler et al., 2009). As seen in Table 5.2, the square roots of AVE (diagonal elements) are greater than inter-constructs correlations (off-diagonal elements). Second, each indicator’s loading should be higher than all cross-loadings (Chin, 1998; Henseler et al., 2009). This criterion was also met, as shown in Table 5.1. Finally, heterotrait-monotrait ratio (HTMT) should be lower than 0.90 (Henseler, Ringle, & Sarstedt, 2015). This criteria was also achieved (please, see Appendix C).
16 Construct PE EE SI FC HM PV HB BI UB SDT ST HE AC SE BE UN Performance Expectancy (PE) CR=0.858 PE1 0.780 0.251 0.303 0.204 0.352 0.177 0.388 0.359 0.198 0.216 0.103 0.216 0.109 0.161 0.216 0.209 PE2 0.691 0.268 0.291 0.128 0.365 0.121 0.308 0.240 0.094 0.136 0.097 0.083 0.008 0.093 0.164 0.076 PE3 0.846 0.153 0.426 0.214 0.382 0.259 0.404 0.423 0.155 0.300 0.177 0.240 0.118 0.180 0.399 0.275 PE4 0.783 0.317 0.418 0.234 0.290 0.252 0.370 0.360 0.274 0.270 0.172 0.165 0.213 0.105 0.153 0.105 Effort Expectancy (EE) CR= 0.826 EE2 0.194 0.824 0.300 0.477 0.292 0.121 0.329 0.208 0.255 0.120 0.237 0.047 0.204 0.055 0.093 0.104 EE3 0.118 0.634 0.191 0.363 0.174 0.145 0.192 0.096 0.077 0.113 0.181 0.087 0.096 0.095 0.074 0.144 EE4 0.347 0.876 0.331 0.477 0.263 0.162 0.399 0.253 0.268 0.242 0.281 0.088 0.112 0.094 0.146 0.116 Social Influence (SI) CR=0.891 SI1 0.364 0.282 0.848 0.200 0.331 0.139 0.326 0.217 0.083 0.221 0.195 0.176 0.170 0.185 0.280 0.223 SI2 0.442 0.264 0.902 0.151 0.311 0.172 0.396 0.237 0.091 0.214 0.219 0.136 0.209 0.130 0.168 0.212 SI3 0.395 0.390 0.813 0.199 0.287 0.167 0.352 0.213 0.108 0.245 0.169 0.168 0.157 0.043 0.188 0.033 Facilitating Conditions (FC) CR=0.783 FC2 0.109 0.487 0.114 0.685 0.176 0.150 0.246 0.164 0.287 0.132 0.210 0.038 0.188 0.086 0.132 0.079 FC3 0.191 0.413 0.175 0.807 0.230 0.102 0.340 0.311 0.294 0.289 0.358 0.161 0.205 0.182 0.197 0.189 FC4 0.248 0.371 0.173 0.722 0.392 0.197 0.262 0.406 0.202 0.345 0.257 0.190 0.128 0.321 0.327 0.268 Hedonic Motivations (HM) CR= 0.898 HM1 0.343 0.300 0.397 0.292 0.872 0.093 0.390 0.379 0.142 0.348 0.317 0.348 0.205 0.271 0.368 0.234 HM2 0.299 0.253 0.265 0.281 0.837 0.129 0.392 0.349 0.152 0.259 0.220 0.299 0.174 0.229 0.340 0.149 HM3 0.473 0.270 0.282 0.374 0.880 0.126 0.375 0.485 0.214 0.348 0.273 0.338 0.191 0.380 0.460 0.305 Price Value (PV) CR= 0.807 PV1 0.081 0.192 0.064 0.133 0.017 0.676 0.155 0.053 0.136 -0.003 0.102 0.093 0.075 0.045 0.005 -0.010 PV2 0.147 0.200 0.166 0.194 0.058 0.740 0.260 0.088 0.209 0.043 0.128 0.071 0.150 0.078 0.027 0.048 PV3 0.291 0.095 0.167 0.154 0.160 0.867 0.256 0.175 0.189 0.204 0.078 0.074 0.109 0.150 0.163 0.071 Habit (HB) CR= 0.838 HB1 0.342 0.440 0.327 0.356 0.383 0.240 0.790 0.381 0.303 0.399 0.248 0.139 0.124 0.225 0.315 0.237 HB2 0.250 0.254 0.253 0.206 0.185 0.192 0.682 0.243 0.304 0.106 0.258 0.024 0.149 -0.015 0.060 -0.001 HB3 0.447 0.117 0.356 0.230 0.402 0.249 0.698 0.426 0.187 0.276 0.182 0.313 0.134 0.257 0.304 0.148 HB4 0.382 0.405 0.321 0.344 0.345 0.221 0.828 0.378 0.369 0.308 0.269 0.101 0.167 0.193 0.213 0.129 Behavioral Intention (BI) CR= 0.868 BI1 0.317 0.155 0.124 0.338 0.447 0.061 0.309 0.768 0.226 0.301 0.186 0.264 0.121 0.317 0.471 0.418 BI2 0.351 0.257 0.228 0.367 0.395 0.159 0.418 0.869 0.273 0.324 0.302 0.311 0.173 0.307 0.430 0.329 BI3 0.458 0.224 0.287 0.327 0.350 0.179 0.458 0.848 0.362 0.280 0.274 0.307 0.254 0.255 0.375 0.335 Table 5.1 – Loadings and Cross-Loadings
17 (Table 5.1 Continued)
Construct PE EE SI FC HM PV HB BI UB SDT ST HE AC SE BE UN
Use Behavior (UB) CR= 0.908 U2 0.162 0.265 0.098 0.281 0.241 0.228 0.346 0.355 0.857 0.224 0.160 0.190 0.165 0.155 0.096 0.070 U3 0.229 0.252 0.117 0.309 0.181 0.216 0.359 0.297 0.889 0.219 0.173 0.126 0.271 0.166 0.102 0.126 U4 0.233 0.227 0.075 0.321 0.109 0.169 0.318 0.267 0.881 0.078 0.163 0.070 0.216 0.086 -0.039 0.056 Self-direction (SDT) CR=0.821 SDT1 0.344 0.200 0.284 0.312 0.348 0.160 0.369 0.290 0.155 0.819 0.337 0.266 0.191 0.351 0.471 0.303 SDT2 0.177 0.159 0.162 0.293 0.278 0.102 0.260 0.315 0.171 0.850 0.269 0.304 0.260 0.331 0.359 0.262 Stimulation (ST) CR=0.758 ST1 0.167 0.254 0.186 0.369 0.244 0.156 0.263 0.224 0.146 0.369 0.756 0.227 0.186 0.215 0.322 0.196 ST2 0.119 0.222 0.172 0.230 0.247 0.038 0.235 0.256 0.149 0.204 0.806 0.186 0.145 0.087 0.190 0.140 Hedonism (HE) CR=0.846 HE1 0.250 0.102 0.150 0.210 0.345 0.095 0.207 0.328 0.152 0.286 0.253 0.881 0.265 0.212 0.209 0.149 HE2 0.150 0.046 0.170 0.104 0.307 0.066 0.119 0.279 0.095 0.303 0.193 0.831 0.306 0.267 0.240 0.170 Achievement (AC) CR=0.779 AC1 0.070 0.133 0.176 0.211 0.216 0.040 0.154 0.139 0.204 0.202 0.193 0.227 0.763 0.132 0.077 0.081 AC2 0.170 0.147 0.162 0.164 0.143 0.179 0.152 0.213 0.194 0.231 0.148 0.298 0.834 0.278 0.111 0.027 Security (SE) CR=0.892 SEP1 0.109 0.085 0.053 0.207 0.133 0.013 0.080 0.230 0.042 0.148 0.100 0.107 0.061 0.645 0.270 0.322 SEP2 0.190 0.065 0.137 0.185 0.359 0.096 0.200 0.276 0.153 0.358 0.179 0.261 0.201 0.835 0.429 0.258 SEP3 0.170 0.069 0.173 0.206 0.235 0.074 0.154 0.295 0.086 0.277 0.135 0.224 0.189 0.790 0.370 0.353 SES1 0.172 0.144 0.162 0.257 0.351 0.177 0.259 0.325 0.140 0.445 0.212 0.284 0.287 0.832 0.390 0.396 SES2 0.101 0.052 0.079 0.207 0.295 0.113 0.189 0.227 0.191 0.321 0.112 0.248 0.266 0.748 0.232 0.293 SES3 0.049 0.017 -0.001 0.229 0.172 0.145 0.133 0.241 0.066 0.255 0.099 0.091 0.157 0.705 0.358 0.407 Benevolence (BE) CR=0.869 BE1 0.300 0.139 0.167 0.276 0.407 0.117 0,276 0.465 0.013 0.437 0.283 0.249 0.078 0.424 0.874 0.406 BE2 0.275 0.031 0.168 0.270 0.379 0.140 0.239 0.426 0.030 0.449 0.299 0.207 0.092 0.428 0.890 0.388 BE3 0.199 0.182 0.291 0.217 0.353 0.044 0.243 0.374 0.112 0.337 0.217 0.188 0.130 0.260 0.716 0.373 Universalism (UN) CR=0.818 UN1 0.232 0.128 0.203 0.251 0.321 0.073 0.188 0.396 0.120 0.306 0.212 0.177 0.119 0.389 0.467 0.852 UN2 0.154 0.114 0.093 0.123 0.134 0.030 0.096 0.273 0.020 0.230 0.146 0.058 0.043 0.243 0.247 0.682 UN3 0.134 0.091 0.117 0.200 0.151 0.038 0.117 0.324 0.063 0.242 0.130 0.176 -0.027 0.375 0.342 0.784
Notes: PE: performance expectancy; EE: effort expectancy; SI: social influence; FC: facilitating conditions; HM: hedonic motivation; PV: price value; HB: habit; BI: behavioral intention; UB: use behavior; SDT: self-direction; ST: stimulation; HE: hedonism; AC: achievement; SE: security; BE: benevolence; UN: Universalism
18 Mean SD PE EE SI FC HM PV HB BI UB ICTS SDT ST HE AC SE BE UN PE 6.318 0.911 0.777 EE 5.428 1.310 0.307 0.785 SI 4.886 1.701 0.469 0.362 0.855 FC 5.892 1.072 0.257 0.561 0.213 0.740 HM 6.390 0.967 0.442 0.317 0.362 0.372 0.863 PV 4.062 1.500 0.270 0.176 0.187 0.202 0.135 0.765 HB 5.490 1.280 0.476 0.414 0.420 0.385 0.444 0.300 0.752 BI 6.405 0.849 0.456 0.256 0.260 0.414 0.477 0.163 0.480 0.829 UB 5.674 1.372 0.238 0.282 0.110 0.347 0.201 0.233 0.389 0.349 0.876 ICTS 7.641 2.111 0.140 0.171 -0.008 0.209 0.123 0.079 0.213 0.168 0.330 NA SDT 5.446 0.765 0.308 0.214 0.264 0.362 0.373 0.155 0.374 0.363 0.196 0.100 0.835 ST 5.057 1.011 0.181 0.303 0.228 0.378 0.314 0.120 0.317 0.308 0.189 -0.023 0.361 0.781 HE 5.529 0.734 0.238 0.089 0.186 0.188 0.381 0.096 0.194 0.356 0.146 0.026 0.342 0.263 0.856 AC 4.623 1.262 0.154 0.176 0.210 0.231 0.220 0.144 0.190 0.223 0.247 0.060 0.272 0.210 0.331 0.799 SE 5.556 0.757 0.179 0.098 0.140 0.281 0.349 0.140 0.230 0.352 0.153 0.205 0.408 0.189 0.276 0.263 0.762 BE 5.596 0.708 0.314 0.139 0.246 0.308 0.459 0.123 0.305 0.510 0.059 0.081 0.494 0.323 0.260 0.119 0.452 0.831 UN 5.449 0.780 0.228 0.143 0.185 0.255 0.275 0.064 0.179 0.433 0.095 0.142 0.338 0.213 0.185 0.065 0.440 0.468 0.776
Notes: Diagonal elements are square root of the AVEs and off-diagonal elements are correlations.
PE: performance expectancy; EE: effort expectancy; SI: social influence; FC: facilitating conditions; HM: hedonic motivation; PV: price value; HB: habit;
BI: behavioral intention; UB: use behavior; ICTS: ICT skills; SDT: self-direction; ST: stimulation; HE: hedonism; AC: achievement; SE: security; BE: benevolence; UN: universalism.
19
5.2. S
TRUCTURAL MODELThe assessment of the structural model was done using three models (1) UTAUT2, (2) Schwartz’s basic values, and (3) combined model (UTAUT2 + basic values + ICT skills – research model). The path significances were estimated using a bootstrapping resampling technique with 5,000 iterations (Hair et al., 2011). Coefficient of determination (R2) and adjusted R2 of the dependent variables, path
significances, and their respective significance levels are presented in Table 5.3.
UTAUT2 Basic values UTAUT2 + Basic values + Skills Hypotheses Conclusion Behavioral Intention (BI)
R2 0.392 0.373 0.504
Adjusted R2 0.374 0.355 0.474
Performance Expectancy (PE) 0.240*** -- 0.194*** H1 Supported
Effort Expectancy (EE) -0.108 -- -0.053 H2 Not supported
Social Influence (SI) -0.041 -- -0.080 H3 Not supported
Facilitating Conditions (FC) 0.252*** -- 0.161** H4a Supported
Hedonic Motivation (HM) 0.221*** -- 0.081 H5 Not supported
Price Value (PV) -0.027 -- -0.031 H6 Not supported
Habit (HB) 0.242*** -- 0.239*** H7a Supported
Self-direction (SDT) -- 0.014 -0.081 H10 Not supported
Stimulation (ST) -- 0.089 0.017 H11a Not supported
Hedonism (HE) -- 0.172** 0.135* H12 Supported
Achievement (AC) -- 0.085 0.058 H13a Not supported
Security (SE) -- 0.025 -0.001 H14a Not supported
Benevolence (BE) -- 0.308*** 0.220*** H15a Not supported
Universalism (UN) -- 0.218*** 0.200*** H16a Not supported
Use Behavior (UB)
R2 0.215 0.183 0.311
Adjusted R2 0.205 0.162 0.284
Behavioral Intention (BI) 0.158* 0.377*** 0.224** H8 Supported
Facilitating Conditions (FC) 0.188** -- 0.150* H4b Supported
Habit (HB) 0.241*** -- 0.200*** H7b Supported
Stimulation (ST) -- 0.099 0.049 H11b Not supported
Achievement (AC) -- 0.150** 0.126* H13b Supported
Security (SE) -- 0.068 0.001 H14b Not supported
Benevolence (BE) -- -0.195** -0.196** H15b Supported
Universalism (UN) -- -0.038 -0.036 H16b Not supported
ICT Skills -- -- 0.233*** H9 Supported
Notes: * p<0.10; **p<0.05; *** p<0.01
Table 5.3 – Structural model results
The adjusted R2, which accounts for the number of independent variables included in the model
(Niehaves & Plattfaut, 2014), was used to evaluate the models. The adjusted R2 for UTAUT2 model,
Schwartz’s basic values model, and for UTAUT2 + basic values + ICT skills model (conceptual model proposed) are respectively, 0.374, 0.355, and 0.474 for behavioral intention and 0.205, 0.162, and 0.284 for use behavior. This suggests that the theoretical model proposed is best, for this reason, the remainder of the paper is based on the final model (i.e. UTAUT2 + basic values + ICT skills model).
20 The model explains 50.4% of the variation in behavioral intention and 31.1% of the variation in use behavior.
To explain behavioral intention, performance expectancy, facilitating conditions, habit, and hedonism were found to be statistically significant, thus supporting hypotheses H1, H4a, H7a, and H12. Effort expectancy, social influence, price value, and hedonic motivation were not statistically significant, therefore H2, H3, H5, and H6 are not supported. In the same way, self-direction, stimulation, achievement, and security were found to be not significant in explaining behavioral intention, not supporting H10, H11a, H13a, and H14a. Benevolence and universalism were statistically significant, however, we hypothesized that they would negatively influence behavioral intention. As shown in Table 5.3, these variables had an unexpected sign, thus H15a and H16a are not supported.
Behavioral intention, facilitating conditions, habit, achievement, benevolence, and ICT skills were all found to be statistically significant in explaining use behavior. Consequently, supporting hypotheses H4b, H7b, H8, H9, H13b, and H15b. Stimulation, security and universalism did not have a significant effect over use behavior. Therefore, hypotheses H11b, H14b, and H16b are not supported. Overall, ten of the twenty-three hypotheses were supported.
21
6. DISCUSSION
The research model explains 50.4% of behavioral intention variation. In determining behavioral intention performance expectancy, facilitating conditions, habit, hedonism, benevolence, and universalism were significant. In turn, ICT use behavior (31.1% of variation explained) was found to be mainly influenced by ICT skills, habit, benevolence (negatively), and behavioral intention. With a low magnitude, facilitating conditions and achievement also exerted influence on ICT use behavior. The performance expectancy finding is consistent with earlier studies (Niehaves & Plattfaut, 2014; Venkatesh et al., 2012) and reflects the importance of utilitarian functions of ICT. This finding is also in line with prior digital divide research (e.g., Bonfadelli, 2002; Eamon, 2004), that considers utilitarian outcomes a major driver of ICT acceptance, especially for those with higher educational levels. Facilitating conditions was significant in explaining both behavioral intention and use behavior. This suggests that respondents consider resources and support to be important to ICT acceptance. Habit had a strong influence over both behavioral intention and use behavior, thus suggesting that once ICT use becomes a routine, individuals are more likely to use it. The results also validated the relationship between behavioral intention and use behavior, this is consistent with earlier research (Ajzen, 1991; Venkatesh et al., 2003, 2012) that considers intention an important antecedent of use behavior. Hedonism was found to positively influence behavioral intention, while hedonic motivation was not. This indicates that leisure and entertainment are considered important factors concerning ICT acceptance, which is in line with prior studies (e.g., Brown & Venkatesh, 2005; Niehaves & Plattfaut, 2014). Moreover, this finding also reveals that more important than enjoyment derived from using a specific technology, is enjoyment in a broader sense. Hence, one’s characteristic overcomes the technology one. Contrary to what was expected, benevolence and universalism had a positive influence over behavioral intention. Both of these values emphasize welfare of others. Hence, individuals who value welfare of people in general, are more likely to try ICT. Regarding use behavior, two values conflict with each other. Valuing demonstration of personal success (achievement) is perceived by the respondents to foster ICT use, while valuing benevolence, which focuses on personal bonds and human-to-human interactions is perceived to limit actual ICT use. This is consistent with the postulated conflicts between values (Schwartz, 2012). ICT skills was one of the most important factors in explaining use behavior, confirming the idea that skills are essential to successfully and effectively use ICT (Ghobadi & Ghobadi, 2013; van Dijk, 2006). This finding also provides support for the argument that inequalities regarding ICT use are mainly driven by individuals’ skills.
The results did not validate some UTAUT2 relationships. For instance, effort expectancy, the degree of ease associated to ICT use had no significant influence on behavioral intention. Thus, contradicting prevailing argument that technology use depends on the perception of how easy its use is (Agarwal & Karahanna, 2000; Hsieh et al., 2008). Price value had no significant importance, probably due to the fact that in Africa, the price of ICT remains very high (Bornman, 2016; ITU, 2015). Therefore, people do not consider it to be a fair tradeoff between the cost and benefits. Which, suggests that cost remains a strong barrier to ICT acceptance, consequently, contributing to digital divide. While some studies (Gupta et al., 2008; Niehaves & Plattfaut, 2014; Venkatesh & Brown, 2001) highlighted the importance of social influence in forming behavioral intention, the results suggest that individuals are not influenced by significant others, which is probably due to the fact that the data was collected