Y-box binding protein 1 (YB-1) relevance in estrogen
receptor-positive (ER+) breast cancer
Mestrado em Biologia Molecular e Genética
Dissertação
Maria José Palma Bettencourt
Trabalho orientada por:
Professora Doutora Sandra Cristina Cara de Anjo Casimiro, IMM-FMUL
Professora Doutora Maria Margarida Perestello Ramos, DBV-FCUL
O trabalho descrito na presente dissertação foi desenvolvido no Laboratório LCosta, Instituto de Medicina Molecular, Faculdade de Medicina de Lisboa sob orientação da Professora Doutora Sandra Cristina Cara de Anjo Casimiro e sob co-orientação da Professora Doutora Maria Margarida Perestello Ramos, Faculdade de Ciências de Lisboa. Este trabalho foi parcialmente financiado pela Bolsa de Investigação em Oncologia Terry Fox 2014/2015 da Liga Portuguesa Contra o Cancro – Núcleo Regional do Sul.
AGRADECIMENTOS
Com a realização deste projeto termina um capítulo da minha vida, uma etapa que não seria possível sem o apoio e contribuição de algumas pessoas.
Em primeiro lugar, gostaria de agradecer aos meus orientadores. À Professora Sandra Casimiro pela sua disponibilidade em me orientar e acompanhar durante o desenvolvimento deste trabalho nesta unidade. Pela oportunidade e responsabilidade que me foi concedida no desenrolar deste estudo, pelos ensinamentos, experiências e conhecimentos passados, que me fizeram crescer a nível pessoal e profissional. Ao Professor Luís Costa pela oportunidade de me receber na sua equipa, pelo entusiasmo e conhecimento cientifico transmitido que foram uma verdadeira dádiva. À Professora Margarida, pela coordenação e orientação de todo o processo ao nível da FCUL, como pelas discussões cientificas e disponibilidade em ajudar e aconselhar.
Um sentido agradecimento a toda a equipa do laboratório Luís Costa, à Marta, Teresa, Joana, Inês e Raquel pelas discussões cientificas, esclarecimento de dúvidas e também por serem excelentes colegas de trabalho. Em especial tenho de agradecer à Irina, por me ter aturado, pelos esclarecimentos e por toda a ajuda. Foste fundamental no desenrolar de todo este projeto, obrigada pela tua amizade. Ao Professor Afonso, pela avaliação minuciosa das amostras que em muito colaborou para o desenvolvimento desta tese. Obrigada também pelos conhecimentos que me transmitiu, que foram uma enorme mais valia para a minha formação profissional. Foi um verdadeiro privilégio aprender consigo. Ao Mário pelos conselhos e pela ajuda na imunohistoquímica. Ao Arlindo, pela ajuda na análise estatística.
Aos amigos e colegas que fiz durante esta etapa no Instituto e que me acompanharam nesta longa jornada. À Andreia, Ana Margarida e Bruna do Laboratório de Histologia e Patologia Comparada, ao António e à Ana de BioImagem e a todos os elementos do laboratório do Sérgio Almeida, em especial, obrigada Sílvia e Ioana. Agradeço a todos pelos bons momentos que aqui passei, cresci e aprendi muito.
Um obrigada a todos os meus amigos. Às amizades de infância e aqueles que se cruzaram no meu caminho e foram ficando, que me apoiam e estão sempre presentes. À Xoa, Amélia, Rita, Madalena, Pata e Francisco. Aos Veríssimos, Tiago e Vasco que tiveram presença assídua ao longo do meu percurso académico. À Teresa, ao Rui, Chico e Dani. Às minhas companheiras, Rita e Cati, obrigada pelo suporte que têm sido nesta fase. À Carolina e à Ioana (mais uma vez) pelas longas conversas, partilha de momentos e ciência. À Leonor, à Ré e à Joana que mesmo à distância me acompanham.
A toda a minha enorme Família, Avós, Tias, Tios e Primos que têm uma grande influência naquilo que sou hoje. Um especial agradecimento à minha Tia Elisa pela partilha e gosto pela ciência, pela confiança e empurrão final e à minha prima Carolina, companheira de escrita. Ao Pedro e à sua Família, pelo apoio, pelo cuidado e carinho especial, e por teres estado ao meu lado.
Aos meus irmãos, António e Ana com quem partilhei os melhores momentos e também os menos bons desta etapa. Obrigada por serem o meu suporte.
Aos meus pais a quem dedico esta Tese, Mãe e Pai obrigada por tudo. Nada disto teria sido possível sem o vosso apoio incondicional. Estarei eternamente grata.
i RESUMO
O cancro da mama é uma doença heterogénea determinada por várias características clínicas e patológicas, incluindo parâmetros histológicos e marcadores moleculares como o recetor de estrogénio (RE), recetor de progesterona (RP) e o recetor 2 do fator de crescimento epidérmico humano (HER2). A classificação de cancro da mama em três principais grupos com interesse clínico reflete essencialmente a classificação molecular: subtipo Luminal, Luminal A (RE+ e/ou RP+, HER2-, Ki67 baixo) e Luminal B (RE+ e/ou RP+, HER2+ ou Ki67 elevado); subtipo com sobre-expressão de HER2 (RE-, PR-, HER2+); e subtipo triplo negativo (RE-, RP- HER2-).
Os tumores da mama positivos para o RE são os mais frequentes (cerca de 80%) e são os que apresentam melhor prognóstico. No entanto, cerca de 30% irão progredir com metastização à distância, resultando num aumento da taxa de mortalidade. O cancro da mama RE+ é dependente de estrogénios que ativam o RE, um factor de transcrição importante. Neste contexto, o gene YBX1, que codifica a proteína YB-1 (Y-box binding protein 1), foi recentemente identificado como parte de um preditor de mau prognóstico em cancro da mama dependente de RE.
A proteína YB-1 parece estar envolvida em todos os hallmarks do cancro, sendo um indicador de mau prognóstico, recidiva, invasão e resistência a fármacos. Em cancro da mama, a proteína YB-1 encontra-se normalmente sobreexpressa, e tem sido associada com a progressão da doença e com a ausência de RE e RP.
Devido à sua capacidade de ligação aos ácidos nucleicos, a proteína YB-1 é um regulador importante de transcrição e tradução de vários genes relacionados com o cancro, como ERBB2, cyclin A/B1, E2F, MDR1, MYC, PIK3CA, e também um componente principal das partículas de ribonucleoproteínas mensageiras, contribuindo assim para a sua estabilização e regulação de tradução. O papel funcional da proteína YB-1 parece ser dependente da sua localização celular, que é estreitamente regulada. Em condições fisiológicas normais a proteína é maioritariamente citoplasmática, embora possa também ser encontrada no núcleo. A translocação nuclear surge, geralmente, em resposta a um stress ou estímulo, e pode ocorrer por clivagem proteolítica ou fosforilação da proteína. A proteína YB-1 é fosforilada no resíduo de serina YB-102 localizada no cold shock domain, pela cinase p90 ribossomal S6 e pela cinase Akt serina/treonina.
Recentemente, utilizando um modelo animal de xenotransplantes ortotópicos de cancro da mama RE+ vs. RE-, com modulação dos níveis de estradiol, o nosso grupo mostrou que o gene YBX1 se encontra sobrexpresso em tumores RE+ que cresceram na presença de 17β-Estradiol (E2), comparativamente a tumores RE+ que cresceram na ausência de E2. Assim, o objetivo deste projeto foi explorar a relevância biológica e clínica da regulação de YB-1 mediada pelo RE em cancro da mama. A nossa hipótese é que as terapias dirigidas ao
ii RE possam afectar o gene YBX1, levando a uma diminuição da sua expressão e que a cessação da hormonoterapia possa desencadear um aumento da sua expressão e consequentemente da proliferação tumoral. Para testar a nossa hipótese usámos uma abordagem translacional, baseada em modelos celulares de cancro da mama e na análise de grupos clínicos relevantes de pacientes com cancro da mama.
O estudo do efeito do E2 na expressão do gene YBX1 na linha celular de cancro da mama positiva para RE MCF-7, mostrou que a adição de E2 ao meio de cultura per se não é suficiente para alterar os níveis de expressão de YBX1. De facto, a análise de um painel de 124 genes regulados pelo RE revelou que a sua regulação in vitro difere substancialmente do que foi observado in vivo, o que indica que existirão outros fatores e/ou mecanismos envolvidos, quer sejam intrínsecos da célula ou derivados do hospedeiro, que poderão afetar a relação entre o RE e YBX1. O efeito do E2 nos níveis de YB-1 foi também avaliado ao nível da proteína por Western Blot e imunofluorescência, utilizando anticorpos específicos contra YB-1 total e a forma fosforilada no resíduo de serina 102 (p-YB-1). O estímulo com E2 induziu um aumento da p-YB-1 e da sua localização nuclear. Este efeito mostrou ser dependente do RE, uma vez que foi inibido pelo tamoxifeno e não foi observado na linha celular RE negativa MDA-MB-231. Assim, embora não tenha sido observado um efeito da ativação da via do RE pelo E2 na expressão do gene YBX1, foi detetado um aumento na fosforilação da proteína YB-1, o que sugere que no modelo in vitro, a expressão e atividade de YB-1 pode ser modulada pela via RE ao nível pós-transducional.
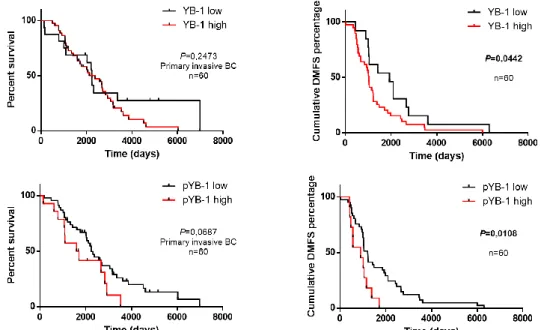
No contexto clínico, o nosso principal objetivo consistiu em estabelecer uma possível correlação entre a expressão de YB-1 e o cancro da mama RE+. Deste modo, analisámos pela primeira vez a expressão de p-YB-1 em amostras cancro da mama, num conjunto de 60 amostras de tumor primário e 32 metástases emparelhadas. Observou-se uma associação entre níveis elevados de p-YB-1 e tumores RE e RP negativos (P=0,006 e P=0,037, respetivamente). Relativamente aos outcomes clínicos, a expressão de YB-1 e p-YB-1 correlacionou-se com uma diminuição da sobrevivência livre de recidiva (P=0.0442, HR 0.5514 95%CI 0.3088-0.9846 e P=0.0108, HR 0.058 95%CI 0.1230-0.7606 respetivamente), mas não com a sobrevivência global (P=0.2473, HR 0.6097 95%CI 0.3704-1.292 e P=0.0687, HR 0.4789 95%CI 0.2168-1.058). Desta forma, YB-1 e p-YB-1 são importantes biomarcadores de pior prognóstico, nomeadamente para risco de recidiva, especialmente em pacientes com tumores RE-, RP-. Em amostras de metástases, observou-se uma correlação positiva entre a expressão elevada de p-YB-1 e metástases RP negativas (P=0,030), sendo que a marcação de YB-1 não mostrou associação significativa com nenhum dos parâmeros clínicos. Verificámos ainda não existirem níveis diferentes de expressão de ambos os marcadores nos tumores primários e metástases, refletindo uma alteração durante a progressão tumoral (Teste McNemar: P=0.7728 e P=0.0771, respetivamente; Paired t-test: P=0.5754 e P=0.1883,
iii respetivamente). Este estudo consiste n a primeira análise da expressão de YB-1 e p-YB-1 em tumores primários da mama e metástases emparelhadas.
Visto que a deteção da proteína YB-1 em tecidos tumorais é um marcador de mau prognóstico, procurámos de seguida avaliar se a deteção de YB-1 no soro de doentes com cancro da mama poderia ser igualmente significante. A deteção de níveis séricos de proteínas é uma técnica minimamente invasiva e de fácil aplicação. Para esta análise foi utilizado um grupo de amostras de soro disponível de doentes com cancro da mama e metástases ósseas. Foi detetada a presença de YB-1 no soro de 22 doentes, correlacionada com a presença de metástases extra-ósseas (P=0.044). A análise multivariada mostrou que os doentes com YB-1 no soro apresentaram uma progressão da doença óssea mais rápida (HR 3.29, 95% CI YB-1.YB-13 – 9.60, P=0.029), no entanto sem diferenças ao nível da sobrevivência global (HR 2.04, 95% CI 0.86 – 4.87, P=0.108). Este estudo corresponde à primeira análise dos níveis séricos de YB-1 em doentes com cancro da mama.
Em suma, os resultados obtidos neste projeto mostram que não só a proteína YB-1, mas também p-YB-1 e YB-1 secretada têm valor de prognóstico em doentes com cancro da mama, reforçando a sua utilidade clínica como fator de prognóstico e possível alvo terapêutico. Este estudo mostrou ainda a regulação in vitro e in vivo de YBX1 não é exclusivamente dependente da presença de E2. No geral, este estudo gerou dados significativos e colocou questões importantes que serão abordadas em projetos futuros.
Palavras-chave:
iv ABSTRACT
Estrogen receptor-positive (ER+) tumors are the most frequent breast cancers (BC), and have the better prognosis. Nevertheless, about 30% of patients with ER+ BC will develop distant metastases, with increased mortality rates. ER+ BC is dependent on estrogens that activate ER, an important transcription factor. In this context YBX1, which encodes for Y-box binding protein 1 (YB-1), was recently identified as part of an ER-dependent poor prognosis predictor for ER+ BC. YB-1 is an oncoprotein overexpressed in BC, where it has been associated with disease progression and ER/PR negativity. Recently, using an orthotopic mouse model of ER+ vs. ER- BC, our group showed that YBX1 is overexpressed in ER+ tumors growing under the presence of 17β-Estradiol (E2).
Therefore, this project aimed to establish a biological and clinical link between ER and YB-1 expression in BC. Using BC cell lines, we showed that E2 per se did not altered YB-1 expression, at the mRNA or protein level, but induced its phosphorylation. These results need further investigation to address the mechanism behind YB-1/ER connection we observe in the in vivo model. Next, we explored the prognostic value of p-1 expression and secreted YB-1 in the clinical setting. We demonstrated that p-YB-YB-1 is a biomarker of decreased distant metastases-free survival and overall survival, and that secreted YB-1 correlates with faster bone disease progression in patients with BC and bone metastases.
In conclusion, the results obtained in this project demonstrate that not only YB-1 but also p-YB-1 and secreted YB-1 have prognostic value in BC patients, reinforcing its clinical utility as prognostic factor and putative target. We also showed that the in vitro and in vivo regulation of YBX1 is not exclusively dependent on the presence of E2. Overall, this work generated significant data and raised important questions to be addressed in future projects.
Keywords:
v TABLE OF CONTENTS
RESUMO ... i
ABSTRACT ... iv
LIST OF FIGURES ... vi
LIST OF TABLES ... vii
ABBREVIATIONS ... viii
1. INTRODUCTION ... 1
1.1 Breast cancer subtypes... 1
1.2 Estrogen Receptors (ERs) ... 1
1.2.1 ER pathway as a therapeutic target ... 2
1.3 Y-box binding protein 1 (YB-1) ... 3
1.3.1 YB-1 as an oncoprotein ... 4
1.3.2 Detection of YB-1 in human breast cancer ... 4
1.3.3 Secreted YB-1 ... 5
2. OBJECTIVES ... 6
3. MATERIALS AND METHODS ... 7
3.1 Cell culture and cellular assays ... 7
3.2 RNA isolation, cDNA synthesis and RT-qPCR ... 7
3.3 Western Blot ... 8
3.4 Immunofluorescence ... 9
3.5 Immunohistochemistry ... 9
3.6 YB-1 quantification in serum samples ...10
3.7 Statistical analysis ...10
4. RESULTS AND DISCUSSION ...12
4.1 Impact of E2 on YBX1 expression in BC cells in vitro ...12
4.1.1 E2 stimuli does not affect YBX1 expression in MCF-7 BC cells ...12
4.1.2 E2 induces an increase in YB-1 phosphorylation...15
4.2 Prognostic value of YB-1 and p-YB-1 expression in primary tumors and paired metastases from BC patients...18
4.3 Prognostic value of seric YB-1 in BC patients with bone metastatic disease ...24
5. CONCLUSION AND FUTURE PERSPECTIVES ...28
6. REFERENCES ...29 7. APPENDICES ... A
vi LIST OF FIGURES
Figure 1 Representative diagram of YB-1 protein structure. ... 3 Figure 2 Expression pattern of housekeeping genes (HKGs) under 17β-Estradiol (E2) stimulus in the estrogen receptor positive (ER+) MCF-7 cell line.. ...12 Figure 3 YBX1 expression under 17β-Estradiol (E2) in BC cell lines. ange was determined using the 2-ΔΔCt method and RPL13A was used as housekeeping gene...13 Figure 4 Effect of 17β-Estradiol (E2) in YB-1 protein expression and phosphorylation. ...16 Figure 5 Localization and expression of YB-1 total and phosphorylated form under E2 stimuli. ...17 Figure 6 Histologic findings and expression of YB-1 and p-YB-1 in human breast cancer and adjacent normal tissue.. ...19 Figure 7 Kaplan-Meier overall survival (Percent survival) and distant metastasis-free survival (DMFS) curves according to YB-1 and p-YB-1(Ser102) in primary invasive BC patients (n=60). ...21 Figure 8 Kaplan-Meier overall survival (Percent survival) curves according to YB-1 and p-YB-1(Ser102) in paired metastases of BC patients (n=32). ...23 Figure 9 Blox graphs of YB-1 and p-YB-1 scores in primary and paired metastases samples ...23 Figure 10 Concordance of YB-1 and p-YB-1 between primary tumors and paired metastases ...24 Figure 11 Kaplan-Meier Overall survival (A), Time to bone disease progression (B) and Skeletal Related Events (C) curves according to YB-1 secretion at baseline. ...26
Figure S1 CT values of HKGs under E2 stimuli. Stability of HKGs in different media and increased concentrations of E2. ... A Figure S2 YBX1 expression under E2 in MCF-7 cell line.. ... B Figure S3 Evaluation of basal YBX1 expression in human tissues and breast epithelial or tumor cell lines. ... B Figure S4 Reported basal YBX1 expression levels in human tissues (A) and breast cell lines (B). ... B Figure S5 Up and down-regulated ER related genes in MCF-7 cells treated with 17β-Estradiol (E2)±Tamoxifen (TAM).. ... C Figure S6 Optimization of detection of YB-1 and p-YB-1 by immunohistochemistry.. ... D Figure S7 Immunohistochemical staining intensity scores of YB-1 and p-YB-1. ... D
vii LIST OF TABLES
Table 1 Up and down-regulated ER related genes in MCF-7 cells treated with 17β-Estradiol (E2)±Tamoxifen (TAM). ...15 Table 2 Cut-off values obtained for randomized samples between low and high YB-1 or p-YB-1 using cut-off finder software and overall survival (OS) as endpoint. ...p-YB-19 Table 3 Association between YB-1 and p-YB-1 and clinicopathological characteristics of patients with BC ...20 Table 4 Association between YB-1 and p-YB-1 and clinical characteristics in paired metastasis of BC patients ...22 Table 5 Association between YB-1 seric levels and clinical and pathological characteristics of patients with BM from BC ...25
Table S1 CT data of HKGs using BestKeeper software tool ... A Table S2 Types of scores tested to analyze overall survival and disease-free survival for patients with primary breast cancer and/or metastatic disease. ... E Table S3 Population characteristics of BC samples and paired metastasis ... F
viii ABBREVIATIONS % Percentage µg Microgram µl Microliter µM Micro molar 18S 18S ribosomal RNA AI Aromatase Inhibitor
AKT Serine/threonine kinase
B2M Beta 2 Microglobulin
BC Breast Cancer
BM Bone Metastases
BSA Bovine Serum Albumin
cDNA Complementary DNA
ChIP-seq Chromatin Immunoprecipitation sequencing
CI Confidence Interval
CIP Calf Intestinal Alkaline Phosphatase
CRS Cytoplasmatic Retention Site
CSD Cold Shock Domain
csFBS Charcoal-Stripped Fetal Bovine Serum
Ct Threshold Cycle
CTD C-terminal domain
DAPI 4’,6-diamidino-2-phenylindole
DMEM Dulbecco’s Modified Eagle Medium
DMFS Distant Metastasis Free-Survival
DNA Deoxyribonucleic acid
DNase I Deoxyribonuclease I
E2 17β-Estradiol
EGFR Epidermal Growth Factor Receptor
ELISA Enzyme-Linked Immunosorbent Assay
EMT Epithelial-Mesenchymal Transition
ER Estrogen Receptor
ERE Estrogen Response Element
FBS Fetal Bovine Serum
FFPE Formalin-Fixed Paraffin-Embedded
ix GAPDH Glyceraldehyde 3-phosphate dehydrogenase
GFP Green Fluorescent Protein
h hours
HER2 Human Epidermal Growth Factor Receptor 2
HKG Housekeeping Genes
HR Hazard-ratio
HRP Horseradish Peroxidase
HT Hormone Therapy
IARC International Agency for Research on Cancer
IF Immunofluorescence
IHC Immunohistochemistry
kDa KiloDalton
KO Knockout
Luc Luciferase
MAPK Mitogen-Activated Protein Kinase
MCF-7 Michigan Cancer Foundation-7 (Breast Cancer Cell Line)
MDA-MB-231 M.D. Anderson – Metastatic Breast 231 (Breast Cancer Cell Line) MHC II Major Histocompatibility Complex Class II
min Minutes
mL Milliliter
MMPs Matrix Metalloproteinases
mRNA messenger Ribonucleic Acid
mRNP Messenger Ribonucleoprotein Particles
NLS Nuclear Localization Signal
nM Nanometer
NSG NOD scid gamma
ºC Degree Celsius
OR Odds ratio
OS Overall Survival
PBS Phosphate Buffered Saline
PBST Phosphate Buffered Saline with 0,05% Triton X-100
PCR Polymerase Chain Reaction
Pen Penicillin
PFA Paraformaldehyde
PI3K Phosphoinositide 3-kinase
x
RNA Ribonucleic Acid
RPKMs Reads Per Kilobase of transcript per Million mapped reads
RPL13A Ribosomal Protein L13a
RT Room Temperature
RT-qPCR Reverse Transcription-semi quantitative Real Time PCR SDS-PAGE Sodium Dodecyl Sulphate-Polyacrylamide Gel Electrophoresis SERD Selective Estrogen Receptor Down Regulator
SERM Selective Estrogen Receptor Modulator
SREs Skeletal-related events
Strep Streptomycin
TAM Tamoxifen
TNBC Triple Negative Breast Cancer
UV Ultraviolet
V Volts
WHO World Health Organization
1 1. INTRODUCTION
Breast Cancer (BC) is the second most common cancer, after lung cancer. Among women, BC is the most frequent type of cancer, with 1,671 million new cases diagnosed worldwide in 2012, and an overall incidence of 11,9%1. According to World Health Organization
(WHO) and the International Agency for Research on Cancer (IARC), in 2012, 521,907 women died from BC, representing the fifth highest mortality rate among all cancers2. Based on
GLOBOCAN prediction for 2020, 1,979,022 new cases will be diagnosed and 622,676 women will die from this disease worldwide34. In Portugal, we observe an identical scenario, with 6,088
new cases diagnosed in 2012, corresponding to the third most common cancer in the general population, and the most frequent in the female population5. Also in 2012, 1,570 women died
from BC in Portugal (16% mortality rate)6.
1.1 Breast cancer subtypes
BC is a heterogeneous disease characterized by various clinical and pathological parameters, including histological evidences and molecular markers such as estrogen receptor (ER), progesterone receptor (PR) and human epidermal growth factor receptor 2 (HER2)7. The
clinically relevant classification of BC recapitulates the molecular classification in three major subtypes: Luminal BC, including Luminal A (ER+ and/or PR+, HER2-, low Ki67) and Luminal B (ER+ and/or PR+, HER2+ or high Ki67); HER2 amplified BC (ER-PR-HER2+); and TNBC BC (ER-/PR-/HER2-)8–10.
Luminal BC is the most common subtype, corresponding to approximately 60% of all BC. It also has the better prognosis, exhibiting low tumor grade, low tumor growth, and lower risk of relapse at an early stage11. However, and despite major improvements in clinical
management and outcomes, almost 30% of ER+ patients will develop metastatic disease predominantly in bone and soft tissue during the following 15 years12. Bone recurrence
represents 65% of all ER+ metastatic BC. When tumor cells spread to the bone, their interaction with the bone microenvironment will favor bone osteolysis, leading to the onset of skeletal related events (SRE), increasing morbidity and mortality.
1.2 Estrogen Receptors (ERs)
Estrogen receptors (ERs) are ligand-induced transcription factors that control cell differentiation and proliferation13,14. There are two major estrogens receptors, ER alpha (ERα)
and ER beta (ERβ), encoded by ESR1 and ESR2 respectively15,16. ERβ seems to act as a
negative modulator of ERα and its expression is minor in tumor cells. ERα is the one with major relevance in clinical treatment of BC and from now on will be referred to as ER.
ER is overexpressed in 60% of all BC and is mainly activated by 17β-Estradiol (E2), the main systemic steroid ovarian hormone (review in17). ER pathway is involved in main
2 cellular functions, such as proliferation, differentiation, invasion, apoptosis and angiogenesis, promoting tumor growth. ER exerts its main function in the nucleus. When E2 binds to ER, it promotes its dimerization and translocation to the nucleus, where it will recruit co-factors and modulate gene expression. The specificity of the transcriptional response depends on the complex ER/co-factors that binds to estrogen response elements (EREs) in the promoter region of the target genes. Binding to DNA can also occur indirectly through interaction with another transcription factors, such as FOXA1.
Studies of ER-related genes have been mostly restricted to model systems10. Recently,
using a cohort of BC patients with different clinical outcomes, ChIP-seq mapping of ERα chromatin binding events allowed the identification of predictive signatures of endocrine resistance and prognostic of clinical outcome18. In fact, ER-binding events in different genomic
regions clustered into differential groups that correlate with survival. Genes clustered in good prognosis group contained genomic regions mainly with EREs, whereas the poor prognosis set contained EREs as much as FOXA1-binding motifs. In this context, we are currently addressing the relation between YBX1, part of the poor prognosis predictor and the ER pathway.
Despite its major role in genomic activity, ER pathway is also important in membrane and intracellular signaling pathways. At this level, ER regulation occurs by interaction with membrane tyrosine kinase receptors, like epidermal growth factor receptor (EGFR) and HER219,20. Downstream activation of PI3K/AKT and Ras/MAPK signaling pathways can
contribute to endocrine therapy resistance21,22.
Clinical evidences raise the hypothesis that ER regulated genes could also have a major role in the development of site specific metastases, like the predominant bone metastases (BM) in ER+ BC, but the molecular mechanisms are still unknown.
1.2.1 ER pathway as a therapeutic target
Presently, hormone therapy (HT) is the most effective option in BC treatment by blocking ER pathway and therefore its activity in tumor development23. HT for BC includes
selective estrogen receptor modulators (SERMs), selective estrogen receptor down regulators (SERDs), and aromatase inhibitors (AIs). SERMS, such as Tamoxifen (TAM), antagonize estrogen effects on target specific genes17. Nevertheless, although most ER+ BC patients are
eligible for endocrine therapy, even in advanced disease stage. the clinical indication will depend on tumor aggressiveness, risk of relapse and expression levels of molecular receptors. In general, Luminal A BC shows the best response to HT24.
Despite HT effectiveness some patients with primary tumors and the majority of patients with distant metastases will develop resistance to the treatment (reviewed in 23).
3 Tumor resistance may be due to loss of ER or loss of its activity; crosstalk between ER and growth factors; and alteration in one of the downstream targets could affect ER pathway and mediate resistance by providing another proliferation or survival stimuli. Understanding the molecular mechanisms behind resistance to HT could allow the identification of new biomarkers, contributing to improve personalized treatment for BC patients.
1.3 Y-box binding protein 1 (YB-1)
YB-1 (Y-box binding protein 1), encoded by YBX1 gene (1p34), is a multifunctional protein member of the cold-shock protein superfamily25. YB-1 is constitutively expressed in
tissues, but at different levels according to development stage and type of tissue (reviewed in
26). YB-1 plays a major role in several cellular functions, like proliferation, apoptosis, cell cycle
control, drug resistance, epithelial-mesenchymal transition (EMT) and stress response. YB-1 was initially identified as a transcriptional regulator that binds to Y-box in the promoter region of MHC II genes27 and to enhancers of the EGFR and ERBB2 genes28. YB-1
protein has 324 amino acids, 36kDa of molecular mass, and an electrophoretic mobility of approximately 50kDa. YB-1 has three major domains: a N-terminal domain; a cold shock domain (CSD), with a phosphorylation site at Serine 102 residue (Ser102); and a C-terminal domain (CTD), which has a cytoplasmic retention site (CRS), a nuclear localization signal (NLS), and a cleavage site.
Due to its ability to bind to nucleic acids, YB-1 is an important regulator of transcription and translation of several genes, including ERBB228, cyclin A/B129, E2F30, MDR131, MYC32,
PIK3CA33, and is also a major component of messenger ribonucleoprotein particles
(mRNPs)34, contributing to its stabilization and acting as regulator of its own translation.
Therefore, the functional role of YB-1 seems to depend on its cellular localization which is highly regulated. In normal conditions YB-1 is mainly cytoplasmic, mostly located in the perinuclear region, although it can also be found in the nucleus35. Generally, YB-1 translocation
to the nucleus occurs in response to stress, namely UV irradiation, oxidative stress and drugs, and it may be promoted by cytokines and growth factors. In addition, YB-1 translocation to the nucleus can occur by proteolytic cleavage of the CRS36, or upon phosphorylation. YB-1 is
Figure 1 Representative diagram of YB-1 protein structure. N-terminal domain contains alanine and proline
residues (A/P domain); CSD, cold-shock domain; Ser 102, phosphorylation site at serine 102; NLS, nuclear localization signal; CTD, C-terminal domain; CRS, cytoplasmic retention site. Adapted from C.Kosnopfel et al.,
4 phosphorylated at Serine 102, located at the CSD, by the p90 ribosomal S6 kinase37 and the
serine/threonine kinase Akt (RSK1/2)38.
1.3.1 YB-1 as an oncoprotein
YB-1 has been implicated in all hallmarks of cancer39 (reviewed in 40). Elevated YB-1
levels have been correlated with cancer progression and poor prognosis in several types of cancers, such as breast41–43, prostate44, gastric45, non-small cell lung cancer46,
osteosarcoma47, melanoma48 and multiple myeloma49. An association between YB-1 levels
and an increase of proliferation and/or inhibition of apoptosis has been shown in vitro in different tumor cell lines50 and seems to be dependent of YB-1 translocation to the nucleus38.
In melanoma, both nuclear localization and phosphorylation of YB-1 have been correlated with tumor progression using a human tissue array48. In MCF-7 BC cells, a point
mutation in Ser102 residue decreased its nuclear localization, and affected EGFR and HER2 regulation, showing a major role of phospho-YB-1Ser102 (p-YB-1) in the regulation of these
genes.51.YB-1 also contributes to EMT in BC cells, by increasing levels of metalloproteases
(MMPs) which play an important role in invasion and metastization52,53. Importantly, YB-1 also
plays a role in mitosis and has been considered a centrosomal protein, with functions in chromosomal instability and influence in actin filaments54.
YB-1 is commonly expressed in BC and a marker of poor prognosis, EMT, relapse and drug resistance31,42,52,53. And as previously mentioned, YBX1 was recently identified as being
part of the ER-related predictor of poor prognosis in BC patients18. In BC, YB-1 nuclear
localization has been associated with the expression of MDR1 and P-glycoprotein, which contribute to the development of a multi drug resistance phenotype 31. More recently, it was
shown in a transgenic mice model that overexpression of YB-1 in mammary epithelial cells contributes to the development of different histological types of BC, another strong evidence of YB-1 role as an oncoprotein54.
1.3.2 Detection of YB-1 in human breast cancer
Among BC subtypes, YB-1 is more expressed in basal-like tumors, and is correlated with an aggressive tumor phenotype42. In Luminal BC YB-1 expression is inversely correlated
with ER and PR levels 30. In accordance, it has been shown that YB-1 knock-down in MCF-7
cells leads to an increase in ER expression 55.
In a large cohort of 4,049 BC patients, high YB-1 expression, assessed by immunohistochemistry (IHC), was related to lower overall survival (OS) and higher risk of relapse across all BC subtypes, with a superior predictive value in comparison with ER and HER242. In this study it was also shown a positive correlation between the nuclear localization
meta-5 analysis that included 8 studies that assessed the prognostic role of YB-1 by IHC, has shown that YB-1 correlates with OS43.
Despite significant clinical data, the relation between ER and YB-1 regulation has not been investigated.
1.3.3 Secreted YB-1
In addition to the intracellular role of YB-1, this protein has also been reported to be secreted and act as an extracellular mitogen, in a monocytic model of inflammation 56. In BC,
addition of YB-1 to MCF-7 cells in vitro, has also shown to promote proliferation 57. Secreted
YB-1 was also identified in plasma of patients with different types of malignancies, including BC58. Therefore, secreted YB-1 may be a strong biomarker of malignancy59.
Taking into account the major role of YB-1 in oncogenesis, and the finding that YB-1 is present in the serum of cancer patients, including BC, further studies need to be performed in order to analyze the importance and predictive value of secreted YB-1.
6 2. OBJECTIVES
Previously in our lab, we investigated how the expression of ER-regulated genes, identified as part of a poor prognosis predictor18, varied in vivo according to the BC subtype
and 17β-Estradiol (E2) availability (unpublished data). MCF-7GFP+Luc+ and MDA-MB-231GFP+Luc+
human BC cell lines (Luminal A and TNBC, respectively) were orthotopically engrafted in the mammary fat pad of NSG mice, in the absence of endogenous E2 (ovariectomized mice) and in presence or absence of an exogenous source of E2 (E2 or placebo sub-cutaneous slow release pellets, respectively). Data from gene expression profiling showed that 32 genes were upregulated in ER+ tumors supplemented with E2, being YBX1 the most up-regulated gene (23,98 fold). As expected, in MDA-MB-231(ER-) tumors, gene expression did not change with E2 supplementation.
Due to the potential oncogenic role of YBX1, we decided to explore the biological and clinical significance of related YBX1 up-regulation in BC. We hypothesized that ER-targeted therapies could affect YBX1, down-regulating its expression, and that HT cessation could trigger an increase in YBX1 and, consequently, in tumor cell proliferation. To address our hypothesis, we use a translational approach, based in cellular models of BC and analysis of clinically relevant cohorts of patients with BC.
In the scope of this specific project, the specific aims were:
1) to address in vitro the effect of ER pathway activation over YB-1 expression, namely:
a. to evaluate the impact of E2 stimuli over the expression of YBX1;
b. to assess the effect of ER pathway activation by E2 in YB-1 expression and localization;
2) to address a possible correlation between YB-1 expression and ER pathway in the clinical setting, namely:
a. to analyze the prognostic value of YB-1 and p-YB-1 in patients with advanced BC and its correlation with clinicopathologic characteristics; b. to evaluate the potential of secreted YB-1 as biomarker of BC and its
7 3. MATERIALS AND METHODS
3.1 Cell culture and cellular assays
The BC cell lines MCF-7GFP+Luc+ and MDA-MB-231GFP+Luc+ were gently provided by
Sérgio Dias Lab, IMM. Both cell lines were routinely propagated in Dulbecco’s modified Eagle’s medium (DMEM, Gibco) containing 10% (v/v) fetal bovine serum (FBS, Gibco), 1% (v/v) Penicillin/Streptomycin (Pen/Strep, 10,000 U/mL Penicillin, 10,000 µg/mL Streptomycin, Gibco). The medium of MCF-7GFP+Luc+ cell line was supplemented with 0,01mg/mL Insulin
(Gibco). Cells were maintained at 37ºC with 5% CO2 in a humidified atmosphere, and medium
was replaced every 2 or 3 days. For experiments with 17β-Estradiol (E2, Sigma-Aldrich), cells were seeded in 6-well plates, at a density of 4x10⁵cells/well, in DMEM supplemented with 10%
charcoal-stripped fetal bovine serum (csFBS, Gibco) or 0,1% FBS. After 24h, medium was replaced with fresh medium supplemented with 1 or 10nM E2, with or without 10μM Tamoxifen (TAM, Sigma-Aldrich).
3.2 RNA isolation, cDNA synthesis and RT-qPCR
Cells were treated as described above. At different time-points, medium was removed and cells were washed with 1xPBS. Total RNA was extracted with NZY Total RNA Isolation kit (NZY Tech), according to the manufacturer’s instructions. Incubation with DNase I was extended to 30min to remove any genomic DNA contamination. Total RNA was quantified in NanoDropTM 1000 Spectrophotometer (Thermo Scientific) and 1μg of total RNA was used to
synthesize complementary DNA (cDNA).
For cDNA synthesis, Oligo(dT)18 primer and NZY M-MuLV First-Strand cDNA Synthesis Kit (NZY Tech) were used according to manufacturer’s instructions.
Interest genes were amplified by real time semi quantitative PCR (qPCR) using ViiATM
Real-Time PCR System (Applied Biosystems). Reactions were performed using 2x TaqMan Gene Expression Master Mix (Applied Biosystems), 900 nM TaqMan® Gene Expression Assay (Applied Biosystems), or 2x iTaqTM Universal SYBER® Green Supermix (Biorad), 10µM
specific primers (Invitrogen) and 5% cDNA (v/v) in a final volume of 20 µl in Micro Amp Optical 384-well Plates (Applied Biosystems). Reactions were run in triplicate, and non-template and RNA template controls were included. The TaqMan® Gene Expression Assays used were: 18S (Hs99999901_s1), GAPDH (Hs02758991_g1), RPL13A (Hs00744303_s1), YBX1 (Hs03044127_g1) and ESR1 (Hs0017486_m1). Gene array assay was performed with a Custom Inventoried TaqMan® Array Plate, Format 96 + Endogenous Controls (Standard) (Applied Biosystems). c-myc specific primer (Invitrogen) sequence: exon 1 (190) forward 5’- GCC GCA TCC ACG AAA CTT T-3’ reverse 5’-TCC TTG CTC GGG TGT TGT AAG-3’.
8 Cycling conditions were the following: holding at 50ºC for 2 min, initial denaturation at 95ºC for 10min, followed by 40 cycles of 95ºC for 15 second and 60ºC for 1min. Relative mRNA expression levels were normalized to RPL13A, GAPDH and B2M and calculated using the 2 -ΔCT or 2-ΔΔCT method.
3.3 Western Blot
Cells were treated as described above. At different time-points cells were transferred to 1.5 mL tubes and centrifuged for 5min, at 1,000 x g and 4ºC. The pellet was re-suspended and lyzed in RIPA Lysis buffer (Santa Cruz), containing 1:100 (v/v) phosphatase inhibitor cocktail (Sigma), 1:100 protease inhibitor cocktail, 1:100 PMSF and 1:100 sodium orthovanadate (all from Santa Cruz). After cooling on ice for 30min, the extracts were sonicated for approximately 1 min in Soniprep 150 (MSE) and centrifuged at 10,000 x g for 20min at 4ºC. Supernatants were transferred to a new tube and quantified using PierceTM BCA Protein Assay
Kit (Thermo Scientific), according to manufacturer’s instructions. Absorbance was measured at 562nm and protein concentration was determined by standard curve of known albumin concentrations. 5x SDS-PAGE Sample Loading Buffer (NZY Tech) was added to each extract, proteins were denatured for 5 min at 95ºC and stored at -20ºC.
Proteins were loaded into 10% SDS-PAGE gels (10µg per lane), and separated by denaturant electrophoresis at 120V. The Precision Plus Protein Standard (Bio Rad) was used as a ladder. Proteins were electro blotted onto nitrocellulose membranes (iBlot 2 NC Regular Stacks, Thermo Fisher Scientific), using Invitrogen Dry Erase mini-gel drying system (Invitrogen) according to manufacturer’s instructions. Membranes were blocked for 1h in 5% Bovine Serum Albumin (BSA, Santa Cruz) or 5% non-fat dry milk, in PBST (1xPBS with 0,05% Tween, Sigma-Aldrich). Membranes were incubated with the following primary antibodies: rabbit anti-human YB1 (D299) (1:1,000, Cell Signaling) and rabbit anti-human p-YB1 (Ser102) (1:500, Cell Signaling), diluted in 5%BSA in PBST, overnight at 4ºC; mouse anti-human β-Actin (1: 25,000, Abcam), diluted in 5% non-fat milk in PBST, for 1h at room temperature (RT). Membranes were rinsed 3x 10 min in PBST, and incubated with the respective secondary horseradish peroxidase (HRP) antibody for 2h at RT: donkey polyclonal anti-rabbit (1:4000, Santa Cruz) or donkey anti-mouse (1: 2,000, Santa Cruz), diluted in 5% non-fat milk in PBST. After washing membranes, proteins were detected using Amersham ECL Western Blotting Detection Reagent (GE Healthcare Life Sciences) or the SuperSignalTM West Femto Maximum
Sensitivity Substrate (Thermo Scientific), according to manufacturer’s instructions. Signal was detected on radiographic film (Fujifilm), using Curix. Membranes were reused after stripping with Stripping Reagent (Dako), according to manufacturer’s instructions.
9 3.4 Immunofluorescence
MCF-7GFP+Luc+ cells (4x10⁵cells/well) were seeded in 6-well plates over glass cover
slips, in 10% csFBS medium. Medium was replaced with fresh medium supplemented with 10nM E2 ± 10μM Tamoxifen, and cells were incubated for 2 or 24h. Following incubation, medium was removed, cells were rinsed twice with 1xPBS, fixed with 3,7% paraformaldehyde (PFA) for 10 min at RT, and permeabilized with 0,5% Triton X-100 for 10 min at RT. Cells were incubated with primary antibodies, rabbit anti-human YB1 or rabbit anti-human phospho YB1 (Ser102), diluted 1:100 in 1% PBS, 0,3% Triton X-100, 1% BSA, overnight at 37ºC, and then incubated with secondary antibody, AffiniPure Goat anti-rabbit Cy3 (1:200, Jackson Immunoresearch), for 1h at 37ºC. Fixation was performed with 2% Formaldehyde for 10min at 4ºC, cover slips were mounted in Vectashield Mount. Medium (Baptista Marques) with DAPI (1:1,000, Sigma-Aldrich) and stored at 4ºC.
Images were acquired with a Zeiss LSM 7 Live Confocal Laser Line-Scanning Microscope (Carl Zeiss MicroImaging) and analyzed in ImageJ Software (version 1.50b, National Institutes of Health, USA).
3.5 Immunohistochemistry
Protocol optimization was performed in an anonymized human BC formalin-fixed paraffin-embedded (FFPE) sample from Histology and Comparative Pathology Laboratory, IMM. The same sample was used as positive control of all experiments. Expression of YB-1 and p-YB-1 was evaluated by IHC in a cohort of FFPE samples from human primary breast tumors (n=60) and paired distant metastases (n=32), stored at the Pathology Archive of Hospital de Santa Maria-CHLN.
Deparaffinization and antigen retrieval was performed in PT Link Pre-Treatment Module for Tissue Specimens (Dako), using Antigen Retrieval pH6 solution (Dako), at 94ºC for 20min. Activity of endogenous peroxidase was blocked with Blocked Endogenous Peroxidase Solution (Dako) for 10 min at RT, and total protein was blocked by incubation with Protein Block Solution (Dako), for 20min at RT. Incubation with primary antibodies was performed overnight at 4ºC with the following antibodies: rabbit anti-human YB1 (D299) (Cell Signaling), diluted 1:50 in Antibody Diluent (Dako) and rabbit anti-human p-YB1 (Ser102) (Cell Signaling), diluted 1:500 in Protein Block Solution. The visualization system Dako REALTM EnVisionTM Detection System, peroxidase/DAB+, rabbit/mouse (Dako) was used according to manufacturer’s instructions, with 2 min of incubation with DAB. Slides were counterstained with hematoxylin, dehydrated and diaphanized in running water, alcohols at 70%, 96% and 100% (30seconds each) and xylene for 10 min.
Sections were mounted with Quick-D mounting medium (Klinipath) and visualized in a bright field microscope (Leica DM2500).
10 Negative controls included the omission of primary antibodies and a phosphatase treated tissue as specific negative control for p-YB-1. In this case, slides were incubated with 0,3U/μl Calf Intestinal Alkaline Phosphatase (CIP, New England BioLabs, inc.), for 2h at 37ºC in a Hybridizer (Dako) after blockage of endogenous peroxidase. Samples were analyzed by a Medical Pathologist. Staining intensity was classified from 0 to 3: (0) absence of staining, (1) weak, (2) moderated and (3) strong staining. Samples were scored according to the percentage of cells with each intensity and randomized to high or low YB-1 and p-YB-1 using different types of cut off values.: the median; the value obtained using cut-off finder software60,61, taking into account the percentage of cells with cytoplasmic staining of intensity
equal or superior to 2 and overall survival (OS) as endpoint; the presence of cells with cytoplasmic staining of intensity 3 or 2 with nuclear staining; positive and negative nuclear staining; the presence of cells with cytoplasmic staining graded with score 3. Final dichotomization between high and low levels of YB-1 and p-YB-1 was performed using cut-off finder software and OS as endpoint.
3.6 YB-1 quantification in serum samples
Serum samples for the quantification of YB-1 were obtained from a prospective collection of serum from patients with BC and BM, followed at the Oncology Division of Hospital de Santa Maria – CHLN. All patients signed an informed consent and the use of these samples to analyze biomarkers was previously approved by the Ethics Committee of Hospital de Santa Maria – CHLN. Baseline cohort (n=44) correspond to samples collected at the time of BM diagnosis. YB-1 was quantified using Human YBX1/YB1 Sandwich ELISA kit (LSBio, LifeSpan BioSciences, Inc.), according to manufacturer’s instructions. Absorbance was measured in InfiniteM200 Plate Reader (Tecan) at 450nm and YB-1 concentration was calculated based on standard curve.
3.7 Statistical analysis
Statistical analyses were performed with the software GraphPad Prism version 6.00 for Windows (GraphPad Software, La Jolla California USA, www.graphpad.com) or Stata 13.1 software (StataCorp LP).
In vitro assays were performed in triplicate and values were expressed as the mean. Differences between groups were analyzed by two-tailed unpaired t-test.
Demographic and clinicopathological characteristics of patients are described using frequencies for categorical variables and central tendency, dispersion and range for continuous variables. Univariate association of these characteristics and YB-1 levels was performed using two-tailed unpaired t-test, Fisher’s exact test and Chi-squared test when appropriate. The concordance between YB-1 and p-YB-1 in primary tumors and paired
11 metastasis was analyzed with McNemar’s test62. Percentage survival and cumulative DMFS
plots were performed using Kaplan–Meier. Univariate differences between survival rates were tested for significance using the log-rank test, while multivariate analysis for survival was tested using Cox proportional hazards models. All patients with missing data in relevant variables were excluded from the multivariate analysis. Significance was defined by a P-value<0, 05.
12 4. RESULTS AND DISCUSSION
4.1 Effect of E2 over YBX1 expression in BC cells in vitro
4.1.1 E2 stimuli does not affect YBX1 expression in MCF-7 BC cells
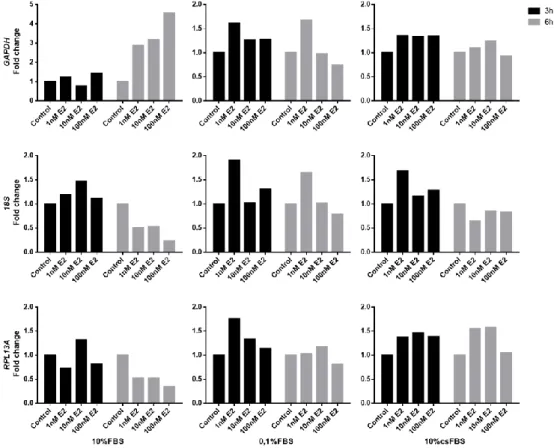
To study the impact of E2 on YBX1 expression we started by assessing YBX1 expression in MCF-7 cells, at different time points after exposure to E2. Since YBX1 expression was quantified by RT-qPCR we first assessed the effect of E2 on housekeeping genes (HKGs), used as endogenous controls for data normalization.
HKGs used for RT-qPCR normalization must have stable expression independently of factors added to the experiment. GAPDH is commonly used as an HKG. However, it has been shown that GAPDH expression changes in ER+ BC cells exposed to E2 and TAM, and RPL13A was found to be the best internal reference gene in these conditions 63,64.
We analyzed the fold change of GAPDH, 18S and RPL13A by RT-qPCR, in MCF-7 cells seeded in medium supplemented with 10%FBS, 0.1%FBS or 10% cs-FBS, and exposed to 1, 10 or 100nM E2 for 3-6h. We observed that both GAPDH and 18S had unstable expression levels, under E2 stimulus, independently of the culture medium.
Figure 2 Expression pattern of housekeeping genes (HKGs) under 17β-Estradiol (E2)
stimulus in the estrogen receptor positive (ER+) MCF-7 cell line. Cells were incubated in
complete medium with 10% FBS, 0,1% FBS or 10% cs-FBS, and treated with different concentrations of E2. Total RNA was extracted 3 or 6h post treatment. GAPDH, 18S and RPL13A fold changes were compared to untreated cells using comparative Ct method (2-ΔCt). Results representative of three independent experiments.
13 RPL13A expression was more stable, especially in 10% csFBS medium (Figure 2). Stability of these three reference genes was also confirmed using BestKeeper Gene software65
(Figure S1 and Table S1).
As a result, we were able to demonstrate that RPL13A is an adequate HKG to be used as an endogenous control in our experiments.
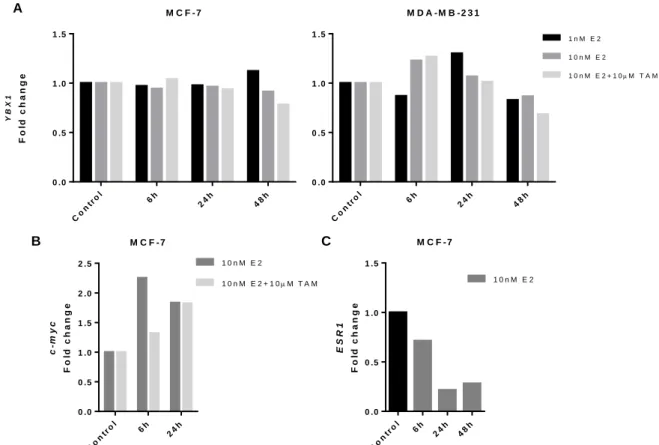
To test the effect of E2 on YBX1 expression, cells were cultured in medium supplemented with cs-FBS to ensure the absolute absence of steroids prior to stimulus. TAM was used to block ER and the effect of E2. MDA-MB-231 cells used to demonstrate the dependence of ER of a possible effect of E2 over YBX1 expression. However, our results show that addition of E2 to culture medium does not affect YBX1 expression in MCF-7 cells (Figure 3A). Results were consistent between three independent experiments, and similar at different alternative time points (Figure S2). Basal YBX1 expression in MCF-7 and MDA-MB-231 cells and in different human tissues (Figure S3) was also consistent with values reported at the EMBL-EBI Expression Atlas66,67 and GTEX Analysis Release V668, respectively (Figure S4).
Therefore, the selected YBX1 assay was not contributing to the lack of observed effect of E2 over YBX1 expression.
M C F - 7 Co ntr ol 6h 24h 48h 0 .0 0 .5 1 .0 1 .5 Y B X 1 F o ld c h a n g e M D A - M B - 2 3 1 Co ntr ol 6h 24h 48h 0 .0 0 .5 1 .0 1 .5 1 n M E 2 1 0 n M E 2 1 0 n M E 2 + 1 0M T A M M C F - 7 c -m y c F o ld c h a n g e Co ntr ol 6h 24 h 0 .0 0 .5 1 .0 1 .5 2 .0 2 .5 1 0 n M E 2 1 0 n M E 2 + 1 0M T A M
Figure 3 YBX1 expression under 17β-Estradiol (E2) in BC cell lines. Expression of YBX1 (A), c-myc (B) and
ESR1(C) was analyzed by RT-qPCR in MCF-7 or MDA-MB-231 BC cells, after incubation with different concentrations
of E2±Tamoxifen (TAM). Gene fold change was determined using the 2-ΔΔCt method and RPL13A was used as housekeeping gene. Results representative of three independent experiments.
A B C M C F - 7 E S R 1 F o ld c h a n g e Co ntr ol 6h 24 h 48 h 0 .0 0 .5 1 .0 1 .5 1 0 n M E 2
14 As confirmatory assays, next we assessed ER activation by E2 in our experimental conditions, by testing the expression of c-myc and ESR1. c-myc was previously shown to be up-regulated in similar conditions69, and ESR1 is known to be down-regulated by E2 in order
to control cells sensitivity to the ligand70–72. We also observed that E2 induced an up-regulation of c-myc at 6h, an effect inhibited by TAM (Figure 3B). Also, ESR1 expression was decreased as expected (Figure 3C).
A direct association between ER and YBX1 expression was only reported in vitro using antiestrogens to reduce YBX1 mRNA levels73. Using MCF-7 cells it was shown that treatment
with TAM for 120h reduced YBX1 expression by 20%. Moreover, overexpression of YBX1 resulted in down-regulation of ER. However, the effect of E2 was not addressed.
The lack of effect of ER pathway activation on YBX1 expression in vitro is not concordant with our previous in vivo data, where we observed an up-regulation in YBX1 expression in MCF-7 orthotopic xenografts growing in mice supplemented with E2. This indicates that additional factors and/or mechanisms, either cell-intrinsic or host-derived may control the regulation between ER and YBX1. Importantly, there are obvious differences in the microenvironment of cells grown in culture and in engrafted tumors, and E2 levels may also be different. Moreover, it is known that ER binding affinity not always correlate linearly with E2-induced transcriptional regulation74.
Among other factors, this can be due to cellular amounts and roles for other transcription factors and co-activators. Moreover, genes’ upregulation by E2-exposure is time dependent69 Importantly, the analysis of gene expression under E2 stimuli, comparing in vitro
cell cultures and mouse xenografts, is not totally concordant, although suggesting a low level of comparison74,75.
Therefore, to address the differences between in vivo and in vitro effect of E2 over 7 cells, we next analyzed the complete gene expression array, previously used with MCF-7 xenografts, using mRNA extracted from MCF-MCF-7 cells growing in vitro. In this case gene expression was normalized to B2M mRNA, which had the lowest standard deviation between samples in a panel of four HKGs (18S, GAPDH, βActin, B2M), and fold change was calculated relative to untreated cells. We confirmed that YBX1 expression was not affected by E2.
Moreover, we observed that only seven of the 124 genes were overexpressed and one gene was down-regulated upon stimulation with E2, an effect totally or partially abrogated by TAM, confirming its ER-dependence (Table 1). Four genes had higher relative mRNA levels under E2 and TAM, although at borderline up-regulation levels. Full data can be found in Figure S5. Importantly, we only found three genes to be overexpressed in vitro and in vivo (RRP12, ISG20 and CUEDC1), interestingly at very similar levels.
15
Table 1 Up and down-regulated ER related genes in MCF-7 cells treated with 17β-Estradiol (E2)±Tamoxifen (TAM). 10nM E2 10nM E2+10μM TAM XBP1 3,35 1,50 SFRS2 1,77 1,02 RRP12 1,72 1,02 KLRC3 1,64 0,58 ISG20 1,63 1,55 UCK2 1,59 1,09 CUEDC1 1,58 1,03 DHCR7 1,22 1,56 YBX1 1,06 0,91 NUDT4 0,95 1,61 RNF10 0,86 1,64 RND1 0,79 1,61 DUSP2 0,37 1,40
Notes: mRNA expression levels were measured by RT-qPCR and gene fold change was determined using the 2 -ΔΔCt method. B2M was used as a housekeeping gene, and fold difference was calculated relative to untreated cells.
Up-regulated genes are represented in red and down-regulated genes in green.
As described in the literature, the best concordance found between in vitro cultures and tumor xenografts was of approximately 40% in around 22,000 transcripts analyzed74. In
another study, comparison of in vivo E2-regulated genes with those regulated in identical cells in vitro after 6 and 24 h of E2 treatment demonstrate only 11% overlap75. In our study, we
found no concordance with these two reported gene sets, as only the most up-regulated gene, XBP1 was also reported to be up-regulated by E2, actually in vitro and in vivo74. The differences
found between gene sets and studies can be due to not only to the experimental conditions and E2 uptake but also with the number of transcripts analyzed. In our study, we only include 124 genes, which could contribute to the lack of concordance.
It is clear that the ER-YBX1 axis requires further studies to dissect the mechanism behind their co-regulation. In the scope of this work, we decided to address if despite we could not detect differences at the mRNA level, we could observe differences in YB-1 protein in MCF-7 cells exposed to E2.
4.1.2 E2 induces an increase in YB-1 phosphorylation
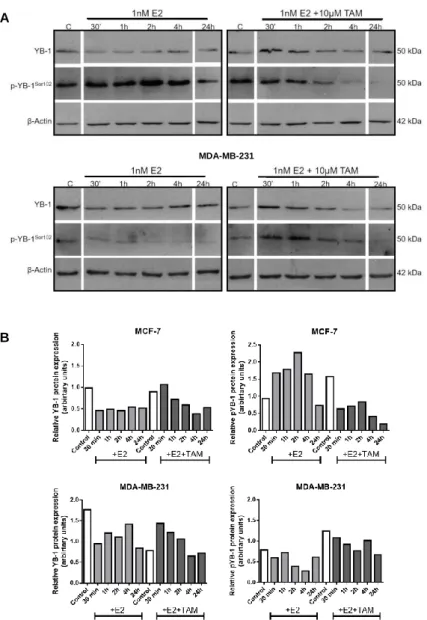
The effect of E2 in YB-1 protein expression and activation was assessed by Western blot and immunofluorescence, using specific antibodies against total YB-1 and YB-1 phosphorylated at residue Serine 102 (p-YB-1). For Western Blot, cell lysates were obtained from MCF-7 and MDA-MB-231 cells, cultured in 10% cs-FBS medium and treated with E2±TAM for different time points. We observed that YB-1 expression seems to remain unaltered after E2 stimulus in both cell lines (Figure 4). However, YB-1 phosphorylation increased with exposure to E2 in ER+ cells, with a maximum at 2h post stimulus. Twenty-four
16 hours after treatment, phosphorylated YB-1 returned to basal levels. The effect is ER-dependent, since the effect of E2 was abrogated by TAM and YB-1 phosphorylation was not observed in MDA-MB-231 cells exposed to E2.
YB-1 is phosphorylated at serine 102 (p-YB-1S102) by Akt and RSK, leading to protein
translocation from cytoplasm to the nucleus37,38. In fact, activated Akt has been found to be
positively correlated with the protein expression of YB-1 in primary BC by screening tumor tissue microarrays38. In this study it was found that Akt binds to and phosphorylates the YB-1
cold shock domain at Ser102, and in an Ala102 mutant nuclear translocation of YB-1 was inhibited. In another study, it was found by in vitro kinase assay that RSK1 and RSK2 directly phosphorylate YB-1, being more effective activators of YB-1 than Akt37. Therefore, it will be
Figure 4 Effect of 17β-Estradiol (E2) in YB-1 protein expression and phosphorylation. (A) YB-1 and
p-YB-1 protein levels were analyzed by Western Blot in MCF-7 and MDA-MB-231 BC cell lines exposed to 1nM E2±10µM Tamoxifen (TAM). β-Actin was used as loading control. (B) YB-1 protein levels were normalized by densitometry to β-Actin protein levels and p-YB-1 protein levels were normalized to total YB-1. Experiments were conducted in 10%csFBS medium.
A
B
MCF-7
17 assessed if future experiments if the E2 effect on p-YB-1 we observe is Akt and/or RSK dependent.
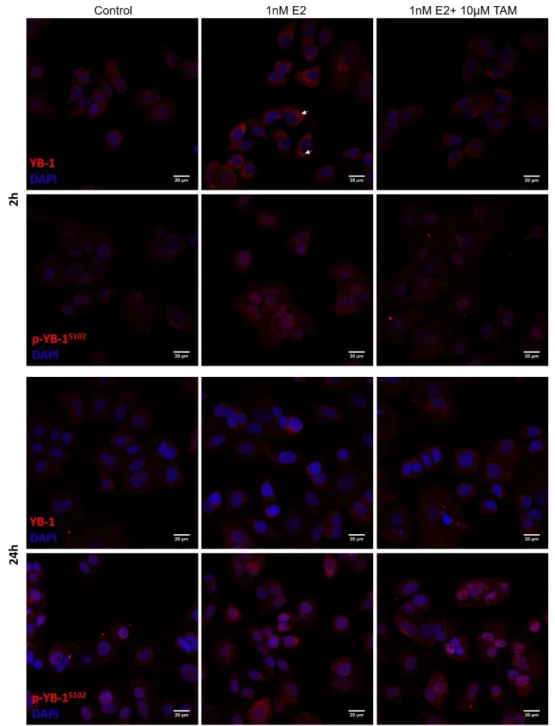
To determine if YB-1 phosphorylation was correlated with its translocation to the nucleus, we next assessed protein expression and localization by Immunofluorescence Confocal Microscopy76.Interestingly, we observed that when MCF-7 cells were exposed to E2
for 2h, YB-1 protein was mostly localized at the perinuclear region (white arrows), an effect abrogated by TAM and not visualized 24h post stimulus (Figure 5). E2 also increased p-YB-1, and induced its translocation to the nucleus.
Figure 5 Localization and expression of YB-1 total and phosphorylated form under E2 stimuli. Protein
expression and cellular localization were observed by immunofluorescence in MCF-7 cells exposed to 1nM E2±10µM Tamoxifen (TAM) for 2 and 24h. Nuclei were stained with DAPI. All experiments were performed in 10% cs-FBS medium.
18 Therefore, although we could not observe an effect of ER pathway activation by E2 on YBX1 mRNA levels, we could detect an increase in YB-1 phosphorylation, suggesting that in an in vitro model, YB-1 expression and activity can be modulated by ER pathway at post-translational level.
Further studies are necessary to confirm the effect of ER pathway on YB-1 basal levels. Our results require further confirmation by Western blot in cytoplasmatic and nuclear cell extracts, and including the ER- MDA-MB-231 cell line as a negative control. The antibodies specificity will also be confirmed in YB-1 KO cells.
4.2 Prognostic value of YB-1 and p-YB-1 expression in primary tumors and paired metastases from BC patients
YB-1 has been described as a marker of poor prognosis across different types of cancers, including BC. However, results are not always concordant between cohorts, and YB-1 role as a biomarker is still under study42,43.
Therefore, we proposed to assess the prognostic value of YB-1 in a cohort of patients with advanced BC, and to address a possible correlation with ER status. Moreover, based on the role of p-YB-1 in cellular processes37,38,51, and on our results described above, it is also of
great relevance to determine p-YB-1 role as a biomarker. As far as we know, there was no conducted study that assess p-YB-1 expression and its correlation with clinicopathological characteristics in human breast tumors. In this retrospective analysis we included a cohort of 60 patients with advanced BC, including 32 cases with paired samples of distant metastases.
First we optimized an immunostaining method based on the use of specific anti-YB-1 and anti-p-YB-1 antibodies, using the absence of primary antibody and treatment with phosphatase as the respective negative controls (Figure S6). Next, all slides were evaluated by a medical pathologist and staining intensities were graded from 0 to 3 (Figure S7). Representative images of IHC staining of YB-1 and p-YB-1 are shown in Figure 6. In both markers, staining was predominantly cytoplasmic, but could also be found in the nucleus. In most part of the cases, nuclear detection coincided with a strongest cytoplasmic staining. We observed the presence of both markers in normal breast tissue, although p-YB-1 staining was a rare event. This phenomena had been described in a previous study, where YB-1 staining was found in normal tissue adjacent to tumor cells41. The majority of tumor cells across all
slides had a cytoplasmic score equal or superior to 2 for YB-1 immunostaining, while this score for p-YB-1 was found in a lower number of cases (25/60).
19 Samples were scored according to the percentage of cells with different intensity staining and randomized to high or low YB-1 and p-YB-1 using different types of cut off values as described in Materials and Methods. We analyzed OS and distant metastasis-free survival (DMFS) and chose the value established using cut-off finder software to dichotomization of samples. This cut off value was selected for all subsequent analyses (Table 2 and Table S2). Values obtained only take into account the percentage of cells with cytoplasmic staining of intensity equal or superior to 2. Nuclear staining was excluded once it was not correlated with outcomes (Table S2). Translocation of YB-1 to the nucleus can occur by phosphorylation at residue Ser102, as described above, or by proteolytic cleavage of the CRS containing the CTD36–38. Since anti-YB-1 (D299) binds to a C-terminal epitope, this antibody would not detect nuclear YB-1 translocated upon proteolytic cleavage. In fact, in studies using D299 antibodies42,51,77, nuclear staining was rarely observed, whereas in studies using antibodies
against N-terminal epitopes, nuclear detection was between 13 and 33%31,41,78. Overall, only
cytoplasmatic YB-1 has been reported to have prognostic value across several studies41–
43,51,79.
Table 2 Cut-off values obtained for randomized samples between low and high YB-1 or p-YB-1 using cut-off finder software and overall survival (OS) as endpoint.
Regarding primary breast tumors, 44/60 samples had high YB-1 expression (73%), and 14/60 high p-YB-1 expression (23%) (Table 3). In this cohort YB-1 did not correlate with clinicopathological characteristics. Conversely, high p-YB-1 was associated with negative ER and PR tumors (P=0,006 and P=0,037, respectively). There was also a trend for association
YB1 p-YB1
Primary tumors Metastases Primary tumors Metastases
Cut off value 62,5 72,5 35 20
HR (95% CI) 1,49 (0,75-2,96) 2,38 (0,97-5,84) 1,85 (0,94-3,63) 3,01 (1,27-7,15)
P-value 0,25 0,052 0,069 0,009
Intratumoral heterogeneity Nucleus Mitosis Adjacent normal breast tissue
YB -1 p -YB -1 400x 400x 200x 400x 400x 400x 200x 200x
Figure 6 Histologic findings and expression of YB-1 and p-YB-1 in human breast cancer and adjacent normal tissue. Immunohistochemical staining with antibodies against YB-1 and p-YB-1 is heterogeneous
within the tumor; both markers are present in both nucleus (black arrows) and cytoplasm of BC cells; strong intensity staining was observed with both antibodies in the nucleus of mitotic cells (grey arrows). YB-1 and p-YB-1 staining is observed in normal breast tissue.