Analysis of textural properties in cheese incorporated with antioxidant
rich berries
Raquel P. F. Guiné;[email protected]
CI&DETS Research Centre/Dep. Food Industry-ESAV, Polytechnic Institute of Viseu, Portugal Soraia E. B. Leitão - [email protected]
CI&DETS Research Centre/Dep. Food Industry-ESAV, Polytechnic Institute of Viseu, Portugal. Fernando J. A. Gonçalves - [email protected]
CI&DETS Research Centre/Dep. Food Industry-ESAV, Polytechnic Institute of Viseu, Portugal. Paula M. R. Correia - [email protected]
CI&DETS Research Centre/Dep. Food Industry-ESAV, Polytechnic Institute of Viseu, Portugal.
Abstract
This work intended to evaluate the textural properties in fresh cheeses made with incorporation of red fruits (blueberry and raspberry) because of the importance that this type of properties carries for defining the organoleptic quality of the product and, consequently, determine consumer acceptance. The fresh cheeses were made following the usual processing steps but somewhere on the process, some fruits were added, whole or grinded in the middle of the cheese mass. To evaluate the textural characteristics, two types of tests were carried out using a Texture Analyser, a compression test and a puncture test. It was concluded that the addition of fruits into fresh cheese produces important changes in the textural properties, namely diminishing hardness and chewiness and at the same time increasing resilience. Also the external and internal firmness vary, increasing in both cases as compared to the control sample. Regarding adhesiveness, it was found not meaningful for the compression test but very significant for the puncture test, as a result of the type of contact between the probe and the chees in each case.
Keywords
Analysis of textural properties in cheese
incorporated with antioxidant rich berries
1. Introduction
Cheese production was developed primarily as a way of preserving the important nutrients of a highly perishable food product, which is milk. However, today either traditional cheeses or those that constitute a specialty are consumed essentially as alternative foods, more likely to arouse the sensory organs. Furthermore, it is also believed that they can probably contribute actively to enhance health. Because they are a good source of macro and micronutrients, cheeses contribute to a healthy diet, making them some of the most important types of foods in Western societies. The perception of the health of the "new" consumer leads to the development of new types of cheeses, such as low fat or low salt, among others [1].
The nutritional value of the cheese depends on the characteristics of the milk that was used as well as the conditions of manufacture employed, determining unique and distinct organoleptic and nutritional properties for each type of cheese. Although cheese has some nutritional properties that are understood to be negative for human health, such as an increased risk of cardiovascular disease, there does not appear to be any evidence that cheese intake has detrimental effects on cardiovascular health. On the contrary, cheese has been associated with several beneficial properties for health, such as antihypertensive and anticancer [2].
Cheese is a very dynamic product, changing texture as well as chemical and microbiological composition throughout processing [3]. Texture and taste are important quality parameters that determine the identity of a cheese, and greatly affect its preference and acceptance by the consumer. The development of sensory characteristics is greatly determined by milk composition, the processing, coagulation, milling, upward pressure, extension and maturation conditions [4].
In the last decades, there has been an increase in the supply, in variety and quality, of food products and the improvement of marketing strategies to promote functional foods. Along with this phenomenon emerges a more sedentary lifestyle, but also more pressured by the tension of everyday life. As a result of these and other circumstances, there is now widespread concern about a number of health problems linked to urban life, such as cardiovascular and weight problems. In response to this situation emerged a new area of research in the food and nutrition sciences: that of functional foods [5].
The importance of natural compounds with antioxidant capacity has been widely recognized in recent years. The use of natural antioxidants, such as food supplements to inactivate free radicals, has revealed important attention, not only for its curative properties, but also because they are products of natural origin, sometimes called nutraceuticals [6].
Small fruits are highly recommended in the human diet, since they are classified as products with high levels of phenolic compounds, such as phenolic acids and flavonoids, and Vitamin C. In addition, they appear to have a range of beneficial effects on health Such as the prevention of cancer and neurodegenerative diseases. Phenolic compounds have antioxidant, anticancer, anti-inflammatory and neuroprotective properties [7].
This work aimed at evaluating textural characteristics, as measured by different tests, in fresh cheeses made with red fruits (blueberry and raspberry) due to the importance of this type of properties for determining the organoleptic quality of the product and consumer acceptance.
2. Experimental Procedure 2.1. Cheese preparation
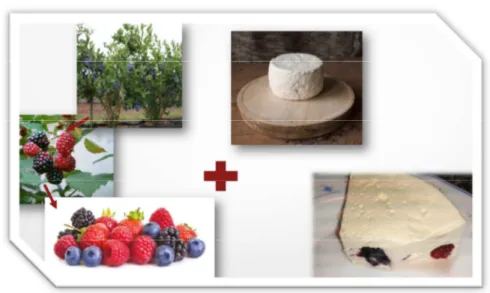
The fresh cheeses were made following the usual processing steps as described in Figure 1. Then, some fruits were added, whole or grinded in the middle of the cheese mass (Figure 2).
Figure 1. Flow diagram for cheese processing operations.
Figure 2. Production of cheese with red berries.
All types of cheese were produced in duplicates and a control cheese was obtained without addition of fruits.
2.2. Analysis of texture
To evaluate the textural characteristics, two types of tests were carried out using a Texture Analyser (model TA.XT.Plus, Stable Micro Systems): (a) compression test and (b) puncture test. Six measurements were done in the top and bottom faces of each of the samples, for both types of test.
a) Compression test
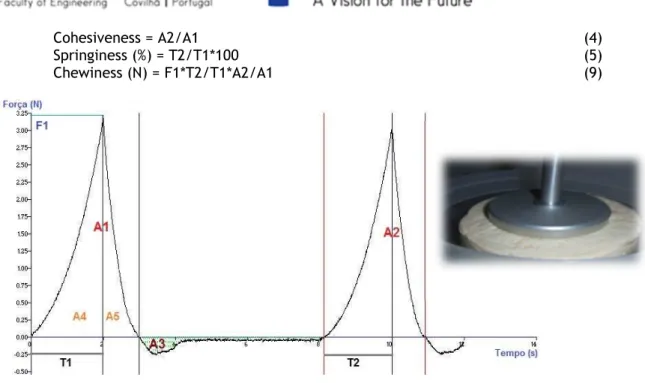
The compression by texture profile analysis (TPA) was performed by two compression cycles between parallel plates, with a 5 sec. interval, using a flat 75 mm diameter probe (P/75) and a 50 kg force load cell. The pre-test, test and post-test speed was 1.5 mm/s, in all cases. The textural properties: hardness, adhesiveness, springiness, resilience, cohesiveness, and chewiness were calculated after equations (1) to (5) (Figure 3) [8], [9]:
Hardness (N) = F1 (1)
Adhesiveness (N.s) = A3 (2)
Cohesiveness = A2/A1 (4)
Springiness (%) = T2/T1*100 (5)
Chewiness (N) = F1*T2/T1*A2/A1 (9)
Figure 3. Texture Profile Analysis (TPA) and calculations.
b) Puncture test
The test performed was measure force under puncture with a probe P/2 (2mm diameter). The operational parameters were: pre-test speed = 2.00 mm/s, test speed = 1.00 mm/s and post-test speed = 1.00 mm/s, distance = 10.0 mm, trigger force = 0.029 N, load cell = 50 kg. The curve force (N) versus time (s) (Figure 4) allows calculating the crust firmness, the inner firmness and adhesiveness, according to equations (6) to (8):
Crust firmness (N) = Fe (maximum force) (6) Inner firmness (N) = Fi (average force between 1 and 2) (7) Adhesiveness (N.s) = A (negative area) (8)
Figure 4. Texture puncture test and resulting curve.
3. Results and Discussion 3.1. Texture – compression test
Figure 5 shows the average values of hardness for all samples evaluated by the compression test, i.e., the texture profile analysis (TPA). Hardness corresponds to the force required to deform the product at a certain distance, i.e., the force to compress between the molars, to bite with the incisors or to compress between the tongue and the palate [10]. The hardness varies between 1.8 and 6.9 N. The higher the strength, the harder the cheese is and there is a great variability in the samples under study. Normal fresh cheese (control sample) has the highest hardness, while frozen blueberry cheese has the lowest hardness.
According to Tenreiro [11] the values of hardness in the crust obtained in the different Serra da Estrela Cheese samples vary between 1.56 N and 9.40 N. Those are higher than the values in this work, because the Serra da Estrela Cheese is a cured cheese while the present is fresh. Diamantino et al. [12] reported for fresh Minas Cheese a value of hardness of 10.7 N.
Figure 5. Hardness of the different samples determined by the compression test.
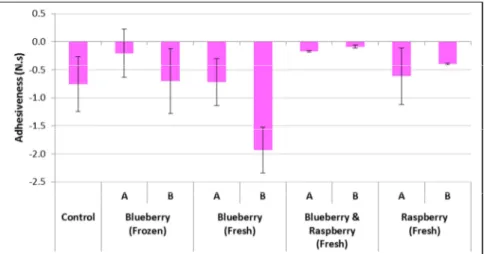
Figure 6 presents the results for adhesiveness, which is the force required to remove the material adhering to a specific surface (eg, lips, mouth, teeth) [10], being a measure of stiffness of the material. The values of adhesiveness are negative, because they correspond to a force in the contrary side of the movement, and vary between -1.9 and -0.1 N.s. Thus, it is possible to say that this type of product does not have meaningful adhesiveness, since the values are close to zero.
The values of adhesiveness according to Tenreiro [11] vary between -26.3 and -2.2 N.sec in the Serra da Estrela Cheese. The values for that type of cheese are considerably higher because it is a soft paste cheese.
Figure 7 shows the results for resilience. Resilience is how well a product struggles to regain its initial position, being an instant elasticity, since resilience is the measure of withdrawal from the first penetration, before the pause period is initiated [10]. The values range from 40.8 to 61.5%. The cheese that presents greater resilience is the cheese with fresh blueberry and raspberry B, and, on the contrary, the one that displays smaller resilience is the cheese with fresh raspberry A followed by the control cheese.
Figure 7. Resilience of the different samples determined by the compression test.
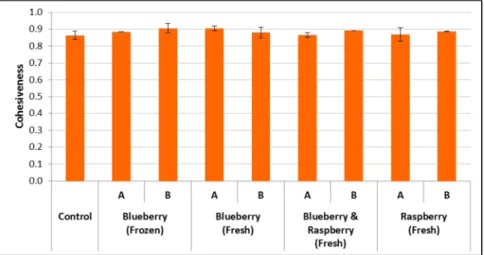
Figure 8 shows the results obtained for cohesiveness in the different samples evaluated. Cohesiveness is the degree to which the sample deforms before breaking, when biting with the molars [10]. The values range from 0.86 to 0.91. The values are very similar amoung the samples, with the most cohesive sample being the cheese with frozen blueberry and the less cohesive the normal fresh cheese (control) together with the cheese with fresh blueberries and raspberries. Diamantino et al. [12] reported for fresh Minas Cheese a value of cohesiveness equal to 0.82, which is very similar to those obtained in the present work.
Figure 8. Cohesiveness of the different samples determined by the compression test.
Figure 9 reveals the values obtained for elasticity, defined as the rate of resistance with which the sample returns to its original form after removal of the force that caused partial compression [10]. The values range from 90 to 96%. Fresh blueberry cheese has the lowest elasticity, while the cheese with fresh blueberry and raspberry has the highest elasticity. In
the work by Diamantino et al. [12] the values of elasticity measured in Minas Cheese was 89%, which is again very close to the values encountered for the cheeses in this work.
Figure 9. Springiness of the different samples determined by the compression test.
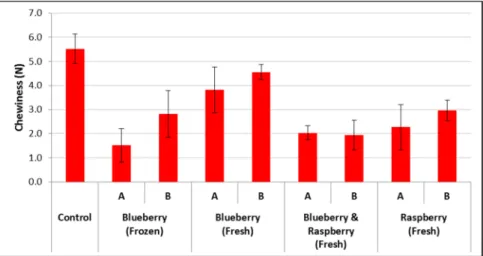
The graph in Figure 10 shows the values for chewiness, which corresponds to the effort required to chew the sample to a consistency that is appropriate to swallow it [10]. The values obtained range from 1.5 to 5.5 N. The cheese with frozen blueberry A presents the lowest chewiness, while normal fresh cheese (control) has the highest value. Diamantino et al. [12] referred for fresh Minas Cheese a value of chewiness equal to 8.05 N, which is very a little higher than those obtained in the present work.
Figure 10. Springiness of the different samples determined by the compression test.
3.2. Texture – puncture test
The results in Figures 11 and 12 correspond to the external and internal firmness, i.e. the firmness of the outer layer and the firmness of the inner mass, and have the same meaning as the hardness previously described when performing the compression test. The results show that the external firmness is always higher than that of the paste, as previously observed for other types of cheese by Guiné et al. [10], who reported that this difference is particularly pronounced in the case of cheeses that are more cured, and therefore harder. The external firmness varies from 0.4 to 5.7 N (Figure 11). The cheese that has the lowest external firmness is the control sample, while the cheese with fresh blueberry and raspberry B has the highest value.
Figure 11. External Firmness of the different samples determined by the puncture test.
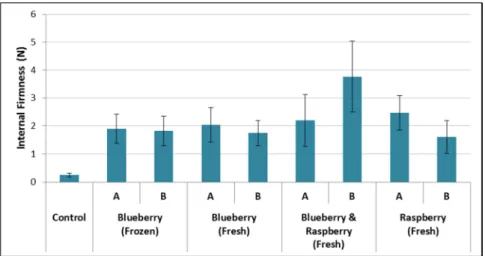
Regarding the internal firmness (Figure 12), the values vary from 0.3 to 3.8 N, with again the control sample presenting the lowest value and the cheese with fresh blueberry and raspberry B presents the highest internal firmness, following the exact same trend as seen for external firmness
Figure 12. Internal Firmness of the different samples determined by the puncture test.
Figure 13 shows the values of adhesiveness obtained with the test of perforation. The results indicate that, contrarily to what was verified in the outer layer (adhesiveness measured by the compression test), when the probe goes inside the cheese the inner mass produces a significant adhesiveness (with values ranging from -1.0 for control to -17.9 for the cheese with blueberry and raspberry B).
Figure 13. Adhesiveness of the different samples determined by the puncture test.
3.3. Correlations
The results of the compression and puncture tests for the same type of textural attribute were evaluated to verify if there was a direct correlation between both types of evaluations. In this way, linear regression was applied to the plots of one variable against the other, allowing to determine the equations and corresponding correlations coefficients (R). Hence, for each case the obtained regression was:
Hardness (Compression) versus External firmness (puncture):
Hc = -0.898 EFp + 6.226 (R2 = 0.713) (9)
Hardness (Compression) versus Internal firmness (puncture):
Hc = -1.287 IFp + 6.326 (R2 = 0.731) (10)
Adhesiveness (Compression) versus Adhesiveness (puncture):
Ac = -0.044 Ap + 0.880 (R2 = 0.739) (11)
The values of the correlation coefficients indicate that there is some correlation, although not very strong, between the results of the compression test and the puncture test used for evaluation of texture, even though the absolute values obtained with both tests differ.
4. Conclusions
This work allowed concluding that the introduction of fruits into fresh cheese produces important changes in the textural properties. Among those changes, the most significant refer to a decrease in hardness and in chewiness, a trend to increase resilience and alter springiness in variable ways depending on the combination used. Also the external and internal firmness vary, increasing in both cases as compared to the control sample. Regarding adhesiveness, it was found not meaningful for the compression test, that measures adherence of the outer surface, but very significant for the puncture test, in which the probe penetrates inside the cheese mass. Finally, and despite different results in terms of absolute values, it was found that relatively meaningful correlations exist between the textural parameters as determined by the two types of test essayed.
6. References
[1] J. M. Kongo e F. X. Malcata, «Cheese: Types of Cheeses -Soft», Elsevier, Reference
[2] E. Jerónimo e F. X. Malcata, «Cheese: Composition and Health Effects», Elsevier,
Reference Module in Food Science, vol. Encyclopedia of Food and Health, pp. 741–747,
2016.
[3] J. M. Kongo e F. X. Malcata, «Cheese: Chemistry and Microbiology», Elsevier, Reference
Module in Food Science, vol. Encyclopedia of Food and Health, pp. 753–740, 2016.
[4] J. M. Kongo e F. X. Malcata, «Cheese: Processing and Sensory Properties», Elsevier,
Reference Module in Food Science, vol. Encyclopedia of Food and Health, pp. 748–754,
2016.
[5] H. Oliveira, «O consumo de alimentos funcionais - atitudes e comportamentos», Universidade Fernando Pessoa, Porto, 2008.
[6] A. Ramos, «Extração e determinação da actividade antioxidante de produtos naturais», Universidade da Beira Interior, Covilhã, 2011.
[7] V. Sousa, «Caracterização de quatro espécies de amora de silva selvagens», Instituto Politécnico de Santarém, Escola Superior Agrária, 2013.
[8] R. P. F. Guiné e M. J. Barroca, «Effect of drying treatments on texture and color of vegetables (pumpkin and green pepper)», Food and Bioproducts Processing, vol. 90, n. 1, pp. 58–63, Jan. 2012.
[9] S. C. R. V. L. Santos, R. P. F. Guiné, e A. I. A. Barros, «Influence of Drying on the Properties of Pears of the Rocha Variety (Pyrus communis», International Journal of Food
Engineering, vol. 9, n. 2, Jan. 2013.
[10] R. Guiné, P. Correia, e A. Correia, «Avaliação comparativa de queijos portuguese de cabra e ovelha», vol. Millenium, n. 49, pp. 111–130, 2015.
[11] M. Tenreiro, «Estudo das propriedades físico-químicas do Queijo Serra da Estrela», Escola Superior Agrária de Viseu, 2014.
[12] V. R. Diamantino, F. A. Beraldo, T. N. Sunakozawa, e A. L. B. Penna, «Effect of octenyl succinylated waxy starch as a fat mimetic on texture, microstructure and physicochemical properties of Minas fresh cheese», LWT - Food Science and Technology, vol. 56, n. 2, pp. 356–362, Mai. 2014.