F
ACULDADE DEE
NGENHARIA DAU
NIVERSIDADE DOP
ORTODetection of juxta-pleural lung nodules
in computed tomography images
M.Sc. Dissertation
Guilherme Moreira Aresta
Mestrado Integrado em Bioengenharia
Supervisor: Aurélio Campilho, Full Professor, FEUP Co-supervisor: António Cunha, Assistant Professor, UTAD
Detection of juxta-pleural lung nodules in computed
tomography images
M.Sc. Dissertation
Guilherme Moreira Aresta
Mestrado Integrado em Bioengenharia
Resumo
O cancro é uma patologia caracterizada por uma divisão anormal das células e posterior metástase para outros tecidos. Esta doença é uma das principais causas de morte a nível mundial. Dos diferentes tipos de cancro, o do pulmão é o mais letal. Contudo, o diagnóstico precoce aumenta a taxa de sobrevivência dos pacientes. O diagnóstico pode ser feito através da detecção de nódulos em imagens de tomografia axial computorizada. No entanto, o cansaço, distração e limitações do sistema visual humano reduzem o sucesso da detecção e consequentemente do diagnóstico da patologia pelos especialistas. Por isso, o sucesso do diagnóstico pode ser melhorado através de sistemas de detecção assistida por computador. Sabe-se que sistemas dedicados a um determinado tipo de nódulo têm melhores resultados do que abordagens mais genéricas. Dos diferentes tipos de nódulos, os justapleurais são aqueles com piores resultados de detecção.
Nesta dissertação propõe-se um método dedicado à deteção de nódulos justapleurais. O nosso foco são nódulos com raio ≤ 5mm uma vez que estes são os mais difíceis de detectar. A abor-dagem proposta explora a diferença de intensidade entre os nódulos e o parênquima do pulmão, bem como a sua estrutura naturalmente arredondada. Os potenciais candidatos são pesquisados dentro de uma segmentação do volume do pulmão obtida através de uma técnica de crescimento de regiões com base em intensidade. De forma a incluir os nódulos justapleurais, os contornos são refinados usando operações morfológicas e contornos activos. Os nódulos sólidos são detectados através de uma saturação local da intensidade e da selecção de um limiar de segmetação apropri-ado. Os nódulos não-sólidos e sub-sólidos, por sua vez, são realçados através de uma filtragem muli-escala com Laplacianos-do-Gaussiano. Finalmente, os resultados das duas abordagens são combinados para produzir uma lista de candidatos. Os falsos positivos mais óbvios desta lista são eliminados através de regras fixas relacionadas com o diâmetro dos candidatos. De seguida, car-acterísticas associadas com a intensidade, redondeza, geometria e localização dos candidatos são usadas para treinar uma máquina de vectores de suporte e consequentemente reduzir o número de falsos positivos. O nosso método foi desenvolvido e avaliado na "Lung Image Database Consor-tium image collection". Como esta base de dados não caracteriza os nódulos de acordo com a sua posição, é também proposto um sub-conjunto apenas com nódulos justapleurais.
O sistema apresentado para detecção de nódulos justapleurais tem resultados equiparáveis ou melhores do que os métodos do estado da arte. A sensibilidade do nosso método é de 57% com 4 falsos positivos por exame, aumentando para 62% se apenas forem considerados nódulos sólidos.
Abstract
Cancer is characterized by an abnormal cell division and spread of cells to other tissues. This con-dition is a leading cause of death worldwide. From the different cancer types, lung cancer is the most lethal. Survival rate is known to increase if the diagnosis is performed early, which can be achieved by analyzing computed tomography scans. However, fatigue, distraction and limitations of the human visual system reduce the overall detection and diagnosis success. Computer-aided detection systems can improve nodule detection rate by providing a second opinion to the physi-cians. Computer-aided detection systems dedicated to specific kinds of nodules tend to outperform general approaches. Nodules can be classified according to their location as isolated, peri-fissural, juxta-vascular and juxta-pleural. From these types of nodules, computer-aided detection systems operate worse for juxta-pleural nodules.
A dedicated juxta-pleural lung nodule detection method is proposed. We focus on nodules with radius ≤ 5mm because they are more challenging to detect. The proposed approach exploits the intensity difference between the majority of the nodules and the parenchymal tissue, as well as the partial roundness of these structures. Lung nodule candidates are searched inside a region-growing based lung volume segmentation that is refined with morphological operations and active contours to include juxta-pleural nodules. First, solid nodules are detected with a local contrast saturation followed by the selection of an appropriate threshold over a sliding window. Sub-solid and non-solid nodules are enhanced using multi-scale Laplacian-of-Gaussian filtering. The results from the two approaches are then combined to produce a single candidate list. The number of false positives is reduced using fixed-rules related to the radius of the candidates. Then, intensity, blobness, geometric and location features are extracted and used to train a Support Vector Machine classifier with radial basis function to further reduce the number of false positive detections. The method is developed and tested using the Lung Image Database Consortium image collection. This dataset does not characterize nodules location-wise and thus a sub-dataset with the juxta-pleural lung nodules is also proposed.
The proposed framework achieves similar or better juxta-pleural lung nodule detection per-formance in comparison to state-of-the-art methods. The achieved sensitivity is 57% with 4 false positives per scan, increasing to 62% if only solid nodules are considered.
Acknowledgements
This work is financed by the ERDF – European Regional Development Fund through the Oper-ational Programme for Competitiveness and InternOper-ationalisation - COMPETE 2020 Programme, and by National Funds through the FCT – Fundação para a Ciência e a Tecnologia within project POCI-01-0145-FEDER-016673
Contents
Preamble 1
Motivation, objectives and contributions . . . 1
M.Sc. dissertation overview . . . 2
1 Introduction 3 1.1 Anatomical context . . . 3
1.2 Lung cancer and computed tomography . . . 4
1.3 Lung nodule computer-aided detection systems . . . 5
1.3.1 Types of lung nodules . . . 6
1.3.2 The LIDC/IDRI dataset . . . 7
1.4 Concluding remarks . . . 8
2 Methods for lung nodule detection in CT images 9 2.1 Lung nodule detection steps . . . 9
2.1.1 Candidate detection . . . 10
2.1.2 Candidate refinement . . . 12
2.1.3 False positive reduction . . . 13
2.2 Representative lung nodule detection algorithms . . . 15
2.2.1 Juxta-pleural nodules specific approaches . . . 16
2.3 Results review . . . 17
2.3.1 Detection per nodule type . . . 19
2.4 Concluding remarks . . . 21
3 Juxta-pleural lung nodule detection 23 3.1 Method overview . . . 23
3.2 Lung volume segmentation . . . 24
3.2.1 Initial lung volume segmentation . . . 24
3.2.2 Active contour refinement . . . 25
3.3 Dataset of juxta-pleural lung nodules . . . 26
3.4 Candidate detection . . . 27
3.4.1 Direct threshold . . . 27
3.4.2 Blob enhancement . . . 29
3.5 False positive reduction . . . 30
3.5.1 Fixed-rules based FP reduction . . . 30
3.5.2 Supervised learning FP reduction . . . 30
3.6 Performance evaluation . . . 33
3.7 Concluding remarks . . . 34 vii
4 Results and discussion 35
4.1 Dataset of juxta-pleural nodules . . . 35
4.2 Lung volume segmentation . . . 38
4.3 Candidate detection . . . 40
4.4 False positive reduction . . . 43
4.4.1 Fixed-rules based FP reduction . . . 43
4.4.2 Supervised learning FP reduction . . . 44
4.5 Comparison with existing methods . . . 45
4.6 Concluding remarks . . . 48
5 Conclusion and Future work 49
A Juxta-pleural lung nodules 51
List of Figures
1.1 Schematic representation of the anatomy of the lungs. Adapted from OpenStaxCollege-Anatomy&Physiology (2013). . . 3 1.2 Hounsfield unit values for different types of tissue and materials commonly present
in a CT scan. −1000 corresponds to black and +1000 to white. Image from Holmes et al.(2008). . . 4 1.3 Example of a slice from a CT scan. Relevant structures (blood vessels, bone,
fissures and lung parenchyma) are depicted. CT scan image from TheCancer-ImagingArchiveTeam. . . 5 1.4 Nodule types according to opacity. Images from TheCancerImagingArchiveTeam. 6 1.5 Nodule types according to relative location to lung structures. Images from
TheCan-cerImagingArchiveTeam. . . 7 2.1 Overall structure of a lung nodule detection algorithm. . . 10 2.2 Steps for juxta-pleural lung nodule detection using α-hulls. i) juxta-pleural lung
nodule; ii) pleural surface; iii) α-hull partially overlaying the pleural surface; iv) segmented nodule, resulting from the subtraction of the α-hull to the pleural surface. 12 2.3 Steps for juxta-pleural lung nodule detection using directional-gradient
concentra-tion. i) juxta-pleural lung nodule; ii) pleural surface; iii) normals to the surface; iv) detection of the nodule as the region with higher surface normals overlap. . . 12 2.4 Commonly used classifiers for false positive reduction of nodule candidates. . . . 15 2.5 Sensitivity (%) and respective number of false positives/scan for different
meth-ods. The minimum nodule diameter (mm), range of slice thickness (mm) and number of scans studied are also shown. Values retrieved from: 1) Alilou et al. (2014); 2) Brown et al. (2014); 3) Camarlinghi et al. (2012); 4) Cascio et al. (2012); 5) Choi and Choi (2013); 6) Choi and Choi (2014); 7) van Ginneken et al. (2015); 8) Golosio et al. (2009); 9) Guo and Li (2012); 10) Han et al. (2015); 11) Messay et al. (2010); 12) Opfer and Wiemker (2007); 13) Setio et al. (2015); 14) Han et al. (2015); 15) Setio et al. (2015); 16) Tan et al. (2011); Setio et al. (2015); 17) Tan et al. (2013); 18) Teramoto and Fujita (2013). . . 18 2.6 Average sensitivity values of several rates of false positives/scan (2−3, 2−2, ..., 23)
for different type of nodules and algorithms. Data retrieved from van Ginneken et al.(2010). . . 19 3.1 Schematic representation of the proposed method. . . 24 3.2 Relevant steps of the region growing-based algorithm for lung volume
segmen-tation. The initial segmentation (prior to refinement) does not include nodules. Nodules are included after the segmentation is refined with a morphological clos-ing. Blue scale bar corresponds to 5mm. . . 25
3.3 Details of the correction of the lung volume segmentation via the Chan-Vese active contour method. The inclusion of juxta-pleural nodules is improved (c and d). Blue scale bar corresponds to 5mm. . . 26 3.4 Examples of nodules considered as juxta-pleural. Each example is retrieved from
a scan and slice (LIDC-IDRI case#, slice#). Blue scale bar corresponds to 5mm. . 27 3.5 Steps for juxta-pleural nodule detection. (a)-(d): solid nodule; (f)-(i): sub-solid
nodule; (k)-(n): non-solid nodule. For the blob enhancement step, Laplacian-of-Gaussian filters with σ = {1, 1.5, 2} are used. Each example is retrieved from a scan and slice (LIDC-IDRI case#, slice#). Blue scale bar corresponds to 5mm. . . 28 3.6 Examples of Laplacian of Gaussian blob enhancement filters for different σ values. 29 4.1 Examples of nodules removed from the juxta-pleural dataset. Each example is
retrieved from a scan and slice (LIDC-IDRI case#, slice#). Blue scale bar corre-sponds to 5mm. . . 36 4.2 Statistics retrieved from the LIDC-IDRI, with special focus on juxta-pleural
nod-ules. Small juxta-pleural nodules have radius ≤ 5mm. . . 37 4.3 Examples of juxta-pleural lung nodules with radius ≤ 5mm (first row) and
non-nodule structures (second row). Each example is retrieved from a scan and slice (LIDC-IDRI case#, slice#). Blue scale bar corresponds to 5mm. . . 38 4.4 Examples of nodules not included in the lung volume segmentation due to their
location near the limits of the lungs. Each example is retrieved from a scan and slice (LIDC-IDRI case#, slice#). Blue scale bar corresponds to 5mm. . . 39 4.5 3D reconstruction of a juxta-pleural lung nodule candidate (orange) along with the
ground-truth (yellow). The correspond initial, middle and final slices are shown. Each example is retrieved from a different slice (LIDC-IDRI case#, slice#). Blue scale bar corresponds to 5mm. . . 41 4.6 Juxta-pleural lung nodules with radius ≤ 5mm (first row) and respective detection
(second row). Each example is retrieved from a scan and slice (LIDC-IDRI case#, slice#). Blue scale bar corresponds to 5mm. . . 42 4.7 Juxta-pleural lung nodule candidates marked with orange contour. The yellow
contour corresponds to the ground-truth. Each example is retrieved from a scan and slice (LIDC-IDRI case#, slice#). Blue scale bar corresponds to 5mm. . . 44 4.8 ROC curves of the proposed classifier for the detection of juxta-pleural nodules
with radius ≤ 5mm after the false positive reduction. The standard deviation is shown in yellow. Specialists’ agreement level is at least 1. . . 44 4.9 FROC curves of the proposed system for the detection of juxta-pleural nodules
with radius ≤ 5mm after the false positive reduction. Specialists’ agreement level is at least 1. . . 46
List of Tables
3.1 Features used for supervised learning. . . 31 4.1 Number of scans and juxta-pleural nodules in the studied 729 scans from the
LIDC-IDRI dataset. Small juxta-pleural nodules are those with radius ≤ 5mm. . . 36 4.2 Inclusion of juxta-pleural nodules and juxta-pleural nodules with radius ≤ 5mm
by the segmented lung volume. . . 39 4.3 Maximum achieved sensitivity values (%) for the proposed method, prior to the
false positive reduction step, per nodule texture and minimum agreement level between specialists. . . 40 4.4 Maximum sensitivity values (%) for juxta-pleural nodules reported by Retico et al.
(2008); De Nunzio et al. (2011); Han et al. (2015) . . . 40 4.5 Maximum achieved sensitivity values (%) for the proposed method, after the false
positive reduction step, per nodule texture and minimum agreement level between specialists. . . 43 4.6 Area under the ROC curve of the classifiers used to reduce the number of
juxta-pleural nodules reported by Retico et al. (2008); De Nunzio et al. (2011); Han et al.(2015). . . 45 4.7 Performance of the proposed juxta-pleural lung nodule detection method for
dif-ferent nodule textures. . . 45 4.8 Juxta-pleural lung nodule detection performance of different systems. r is the
nodule radius. A - Retico et al. (2008), B - De Nunzio et al. (2011), C - Han et al.(2015), D - Fujitalab, E - Region growing volume plateau, F - Channeler Ant model, G - Voxel-based neural approach, H - ISI-CAD, I - Philips Lung Nodule CAD (van Ginneken et al. (2010)). . . 46 A.1 Juxta-pleural lung nodules available in the LIDC-IDRI dataset (1 out of 6) . . . . 52 A.2 Juxta-pleural lung nodules available in the LIDC-IDRI dataset (2 out of 6) . . . . 53 A.3 Juxta-pleural lung nodules available in the LIDC-IDRI dataset (3 out of 6) . . . . 54 A.4 Juxta-pleural lung nodules available in the LIDC-IDRI dataset (4 out of 6) . . . . 55 A.5 Juxta-pleural lung nodules available in the LIDC-IDRI dataset (5 out of 6) . . . . 56 A.6 Juxta-pleural lung nodules available in the LIDC-IDRI dataset (6 out of 6) . . . . 57
Abbreviations and Symbols
2D Two-dimensional 3D Three-dimensional CADe Computer-aided detection CADx Computer-aided diagnosis CT Computed tomography FF Feed-forward neural networks FP False positive
FROC Free-response receiver operating characteristc HU Hounsfield unit
LIDC/IDRI The Lung Image Database Consortium image collection LoG Laplacian-of-Gaussian
SVM Support Vector Machine ROC Receiver operating characteristc TP True positive
Preamble
Motivation, objectives and contributions
Lung cancer is the most lethal type of cancer. CT is commonly used for detecting lung cancer. An early detection greatly increases the survival rate of the patients. However, fatigue and distraction errors, together with lack of experience and limitations of the visual system, cause physicians to fail during the nodule detection process. CADe systems are thus of interest, providing to the specialists a second opinion during their exam observation. The combination of CADe systems dedicated to a specific type of lung nodule is known to outperform more general approaches. The LIDC/IDRI is a lung CT public dataset used for training, testing and comparing the performance of CADe systems. Lung nodule CADe systems are usually composed by 3 steps: initial candidate detection, candidate refinement and FP reduction. Initial candidate detection is performed by using HU-based approaches, blob detectors or shape analysis. Candidates can be refined with region growing or active contours. The number of FPs can be reduced by using fixed rules followed by a binary classification with a trained classifier such as a SVM or a neural network.
Lung nodules can be classified according to their relative location to other lung anatomical structures as isolated, peri-fissural, juxta-vascular or juxta-pleural. Juxta-pleural nodules are lung lesions that occur near the pleura. These nodules have similar intensity to the pleural wall and their shape is more variable than other nodules. Considering these characteristics, the currently used approaches for automatic lung nodule detection in CT scans do not usually perform well for juxta-pleural nodule detection. In fact, these nodules tend to be the most difficult type of nodule to detect. Furthermore, there are few works addressing specifically the detection of juxta-pleural nodules in CT images. The following objective for the M.Sc. dissertation is thus proposed:
• development of a dedicated method for the detection of juxta-pleural nodules in lung CT images. The dedicated method overcomes several detection issues related to the character-istics of juxta-pleural nodules. The LIDC/IDRI dataset is used for the development of the algorithm. The proposed solution may be used for improving the performance of a multi-approach CADe system currently in development by the C-BER group.
The LIDC/IDRI dataset does not characterize lung nodules according to their location. Con-sequently, to validate our method, a sub-dataset with the juxta-pleural lung nodules existent in the LIDC/IDRI is also presented.
Several contributions to the state-of-the-art result from this research:
• creation of a juxta-pleural lung nodule sub-dataset from the LIDC/IDRI dataset; to our knowledge this sub-dataset is the first to consider the majority of the scans of the LIDC/IDRI dataset and to be manually revised;
• improvement of the lung volume segmentation algorithm of the C-BER group in terms of juxta-pleural lung nodule inclusion;
• proposal of a juxta-pleural lung nodule detection method, with focus on nodules with radius ≤ 5mm; the method shows up-to state-of-the-art results and unlike other works considers all non-solid, sub-solid and solid nodules.
M.Sc. dissertation overview
The M.Sc. dissertation is organized as follows. Chapter 1 presents the anatomical context of the problem in study, along with the fundamentals of CT imaging and lung cancer detection. The characterization of lung nodules in terms of texture and location is also referred. Chapter 2 describes the state-of-the-art methods for the detection of lung nodules in CT scans, with focus on approaches dedicated to juxta-pleural lung nodules. Then, the overall and location-specific lung nodule detection performance of different systems is presented and discussed.
Chapter 3 presents our juxta-pleural lung nodule detection method. The method exploits the intensity difference between parenchymal tissue and lung nodules as well as the roundness of these abnormalities. Then, in Chapter 4, the performance of our system is discussed and compared to the state-of-the-art. Chapter 5 summarizes the main conclusions of the performed research and suggests future work to further improve the method.
Chapter 1
Introduction
1.1
Anatomical context
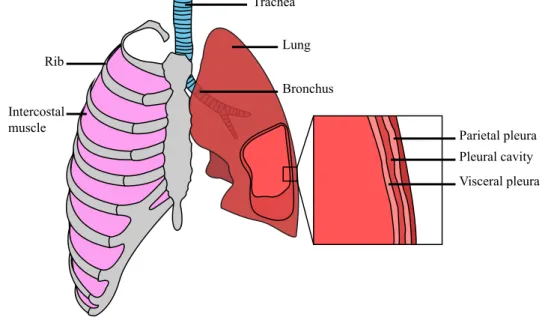
The lungs (Fig. 1.1) are a set organs located within the thorax and are the most important organs of respiration. Each lung has an apex and a base (superior and inferior portion, respectively), three borders and two surfaces (costal and mediastinal). The right lung has 3 lobes and the left 2 lobes. The lungs are invested by a serous membrane called pleura, composed by an internal (visceral) layer and an external (parietal) layer separated by the pleural cavity. The heart (and other mediastinum contents) are in the central portion of the thoracic cavity and separate the two lungs. Structures like the rib cage help to protect these organs from impacts. The intercostal muscles participate in the breathing process. The air reaches the lungs via the trachea, which branches into the main left and right bronchi. Each of these bronchi subdivide in progressively smaller structures, thus allowing gas exchange with the pulmonary capillaries (Gray et al. (1918)).
Trachea Lung Bronchus Rib
Intercostal
muscle Parietal pleura
Pleural cavity Visceral pleura
Figure 1.1: Schematic representation of the anatomy of the lungs. Adapted from OpenStaxCollege-Anatomy&Physiology (2013).
1.2
Lung cancer and computed tomography
Cancer is a group of diseases characterized by an abnormal cell division and spread of these cells to other tissues (NIH (2015)). According to WorldHealthOrganization (2015), “cancer is a leading cause of death worldwide, accounting for 8.2 million deaths in 2012”. Among all cancers, lung cancer is the most lethal, being responsible for 1.59 million deaths, i.e, approximately 20% of cancer related deaths. The 5-year survival rate of patients with lung cancer in developed countries is approximately 20%. This is partially due to the late diagnosis of the pathology. When diagnosed in early stages, the 5-year survival rate increases to over 50% (De Angelis et al. (2014); Siegel et al. (2015)). Lung cancer is usually a result of unhealthy lifestyles, which include active and passive smoking and exposure to dangerous chemicals (WorldHealthOrganization (2015)).
Lung cancer screening and preliminary diagnosis is performed using non-invasive imaging techniques, including chest X-ray, magnetic resonance and computed tomography (CT). From these, CT is the most widely used due to the simplicity of the procedure and good imaging results (Swensen et al. (2003); Bach et al. (2012)). A CT image is produced by radiating se-lected portions of the body with X-photons and measuring the resulting intensity after the tra-verse. The attenuation value, or tissue density, of a given portion of the body is then assigned to a voxel (Holmes et al. (2008)). It is possible to standardize the attenuation value attributed to each voxel by using Hounsfield units (HU). HU correspond to the comparison of the attenuation value of the tissue with the attenuation value of water. The resulting scale, centered in the HU value of water (zero) (Holmes et al. (2008)), is shown in Fig. 1.2.
0 Air –1000 Lung –500 Fat Water +1000 +500
Soft tissue Bone Bone Soft tissue Water Fat Lung Air +400 +1000 +40 +80 0 –60 –100 –400 –600 –1000
Figure 1.2: Hounsfield unit values for different types of tissue and materials commonly present in a CT scan. −1000 corresponds to black and +1000 to white. Image from Holmes et al. (2008).
In a standardized CT procedure the equipments are calibrated so that the Hounsfield scale remains true. By maintaining constant the HU, it is possible to easily segment different types of tissues. Note that HU levels may sometimes vary between equipments as result of different radiation energies and other properties. HU are of interest for diagnosis: by selecting an adequate range of HU values (i.e., a visualization window), the specialist can analyze different structures and details of interest for the detection of the pathology.
1.3 Lung nodule computer-aided detection systems 5
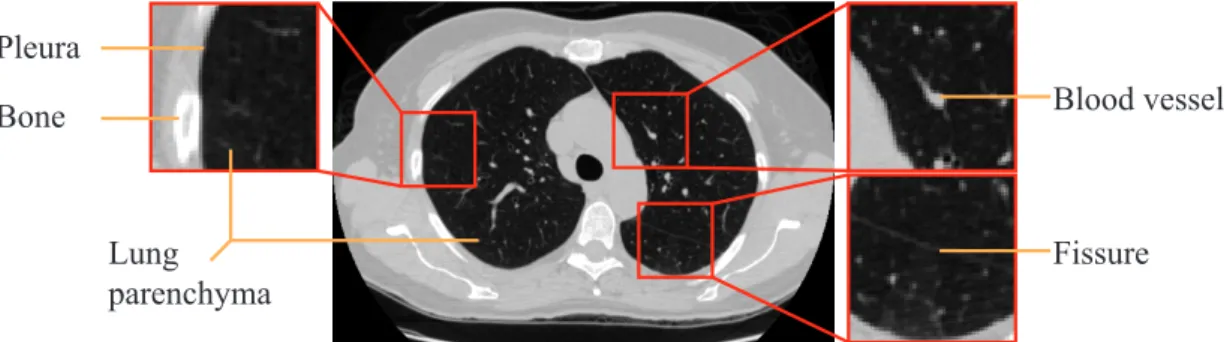
Multi-slice CT is the most common type of CT imaging. The popularity results from the fact that this technique allows, in relation to its predecessors, to scan large anatomic portions (such as lungs) with low slice thickness. Fig. 1.3 shows an example of a CT scan, as well as relevant anatomical structures. In these slices it is possible to distinguish blood vessels, a fissure (result of the interface between the lung nodules), the pleura and the lung parenchyma.
Blood vessel
Lung
parenchyma Fissure
Pleura Bone
Figure 1.3: Example of a slice from a CT scan. Relevant structures (blood vessels, bone, fissures and lung parenchyma) are depicted. CT scan image from TheCancerImagingArchiveTeam.
Thin slices are important because they allow high-quality 3D reconstructions and reduce the partial-volume effect (Goldman (2008)). The partial-volume effect is the reduction of sharpness of the image and alteration of the image intensity due to the imaging process (Soret et al. (2007)). In a 3D CT image, each voxel intensity is the result of the average attenuation of the respective portion of tissue. When slice thickness increases, the portion of tissue used for assessing the intensity of a given voxe also increases. Due to the averaging, structures become blurred and their overall intensity changes, which is most of the times undesirable for medical imaging analysis.
1.3
Lung nodule computer-aided detection systems
The detection of lung cancer cases in CT images is usually performed by trained physicians. In a routine examination, the specialists visually detect the nodules. Nodules are rounded abnor-mal structures that may indicate primary lung cancers, metastatic diseases or non-cancerous pro-cesses (Armato III et al. (2004)). During the procedure, the physicians annotate the nodule posi-tioning and dimension for further follow-up. However, fatigue and distraction errors, together with lack of experience and limitations of the visual system, reduce the detection rate and correct clas-sification of nodules (Valente et al. (2016)). As so, the development of automatic/semi-automatic tools that aid the physicians in nodule detection and diagnosis is of interest. These tools can be generically named as computer-aided detection (CADe) systems and computer-aided diagnosis (CADx) systems. The former has as objective to detect information of interest to the physician (such as the location of possible nodules in a CT scan); the latter is aimed to give a second opinion to the specialist regarding the final diagnosis (Castellino (2005)). This work will contribute to the development of a CADe system for lung cancer screening in CT images. CADe systems can be general or dedicated to a specific nodule type. The combination of dedicated CADe systems
has shown to improve results in comparison to separated systems (van Ginneken et al. (2010); De Nunzio et al. (2011)). For this purpose, it is important to consider these different types of nodules.
1.3.1 Types of lung nodules
Lung nodules can be classified in different ways. The most obvious is perhaps the binary classi-fication as benign or malign. This classiclassi-fication is of interest for CADx systems. Nevertheless, nodules can also be classified according to their texture and location. In CADe systems, the detec-tion process should be adjusted according to the intrinsic characteristics of each kind of nodule.
1.3.1.1 Nodule texture
In terms of texture, nodules can be classified as solid, sub-solid and non-solid (or ground-glass opacities) nodules. Solid nodules (Fig. 1.4a) are those that completely obscure the parenchyma. They are relatively easy to identify, even for less experienced observers, and their margins are usually well defined. Non-solid nodules (Fig. 1.4c) are diffused abnormalities in the parenchyma. The shape of non-solid nodules is highly irregular and difficult to characterize, showing in CT scans as cloudy areas. Sub-solid nodules (Fig. 1.4b) combine the features from solid and non-solid nodules, only partially obscuring the lung parenchyma.
(a) Solid (b) Sub-solid (c) Non-solid
Figure 1.4: Nodule types according to opacity. Images from TheCancerImagingArchiveTeam.
1.3.1.2 Nodule location
Nodules can be classified according to their location relatively to other structures in the lungs. According to van Ginneken et al. (2010), lung nodules can be classified as isolated, peri-fissural, juxta-vascular and juxta-pleural. Fig. 1.5 shows an example of each kind of these nodules.
Isolated nodules (Fig. 1.5a) are well-circumscribed rounded structures in the central region of the lung parenchyma. They show no connection to blood vessels, fissures or pleura. These nodules tend to be the simplest to detect using a CADe system, as no special attention to other structures has to be considered. Peri-fissural nodules (Fig. 1.5b) are triangular or oval shapped abnormalities that occur in the periphery of the lung fissures. These nodules are usually non-malignant; nevertheless, their follow-up is still recommended (Ahn et al. (2010)). Juxta-vascular nodules (Fig. 1.5c) are abnormalities that appear attached to vascular structures. In CADe systems, these nodules are challenging to detect as their intensity is similar to the intensity of blood vessels (Sun et al. (2014)).
1.3 Lung nodule computer-aided detection systems 7
(a) Isolated (b) Peri-fissural (c) Juxta-vascular (d) Juxta-pleural
Figure 1.5: Nodule types according to relative location to lung structures. Images from TheCan-cerImagingArchiveTeam.
Juxta-pleural nodules (Fig. 1.5d) are nodules attached to the pleura, the interface membrane between the lung parenchyma and the exterior muscular and fat tissues. Juxta-pleural nodules show different shapes: they can be rounded structures attached by a tail to the pleura (as in Fig. 1.5d) or they can be elongated with direct contact to the mentioned membrane. Shape va-riety and intensity similarity between juxta-pleural nodules and the adjacent tissues difficult the automatic detection of this kind of nodules. In fact, according to van Ginneken et al. (2010), juxta-pleural nodules tend to be the more challenging type of nodule to detect.
1.3.2 The LIDC/IDRI dataset
CADe systems must be validated prior to their use in the clinical environment. CADe validation should be performed considering a large range of possible scenarios, as robustness is essential. Large and representative datasets should thus be used for testing CADe performance. Furthermore, the usage of public datasets should be encouraged to ease the comparison between systems.
The Lung Image Database Consortium image collection (Armato et al. (2011); TheCancer-ImagingArchiveTeam) is one of the largest publicly available dataset aimed at the development of lung nodule detection and classification systems using CT scans. Each scan from the dataset was evaluated by four experienced thoracic radiologists from a universe of twelve specialists. Struc-tures of interest were divided in 3 categories: i) nodule with diameter < 3mm, ii) nodule with diameter ≥ 3mm and iii) non-nodule with diameter ≥ 3mm. Non-nodules are lung lesions that have no cancerous characteristics (an apical scar, for instance). CADe systems tend to detect these lesions and so their identification is important.
The main focus of the dataset is to promote the study of ≥ 3mm diameter nodules. The dataset contains segmentations (ground-truths) of these nodules. Nodules with ≥ 3mm diameter also have a subjective evaluation of several characteristics: i) subtlety (difficulty in detection), ii) internal structure/composition (soft tissue, fluid, fat, air), iii) calcification, iv) sphericity (overall round-ness of the nodule), v) margin (how well-circumscribed is the nodule), vi) spiculation, vii) tex-ture (solid, non-solid or sub-solid) and viii) malignancy (assuming a 60-year-old male smoker). These characteristics are not usually of interest for CADe systems. However, they can be used for evaluating the performance considering these subjective evaluations. For the smaller nodules
and non-nodules only the center-of-mass is indicated. Furthermore, regardless nodule size, no location-based classification (isolated, peri-fissural, juxta-vascular or juxta-pleural) is provided.
The ground-truth was established in two phases. In a first phase, each of the four specialists analyzed the scans without access to the work of the others. Segmentations were performed man-ually or using a semi-automatic software. In the second phase, the ground-truths were revised based on the work of the other radiologists. The radiologists were not forced to segment structures considered as nodules by other radiologists. Consequently, each nodule has assigned an Agree-ment level. If all radiologists agreed that a given abnormality was a nodule, then the AgreeAgree-ment levelis 4. Nodules with higher Agreement level should be easier to detect, as they tend to be more obvious. However, several other factors, namely location, should be taken into account.
The dataset contains 1 012 scans, with a total of 7 371 nodules. From these, 2 669 nodules have a diameter ≥ 3mm. Approximately 35% of these nodules have an Agreement level of 4 and 29% have an Agreement level of 1.
1.4
Concluding remarks
Lung cancer is the most lethal type of cancer. The survival rate increases to over 50% if the diagnosis is performed early. CT scanning is used for lung nodule detection. However, fatigue, distraction and limitations of the human visual system reduce the overall detection and diagnosis performances. CADe systems can help to improve nodule detection rate.
The combination of dedicated CADe systems usually outperforms general approaches. For the different nodule locations (isolated, peri-fissural, juxta-vascular and juxta-pleural), CADe systems tend to perform worse for juxta-pleural nodules. The LIDC/IDRI dataset can be used for the development and performance evaluation of lung nodule CADe systems. Although providing several important characteristics, no nodule location-based classification is given.
Chapter 2
Methods for lung nodule detection in
CT images
An automatic lung cancer diagnosis system usually comprises 3 major steps: i) candidate nodule detection, ii) candidate analysis (segmentation and feature extraction) and iii) candidate classifi-cation. Candidate detection consists in the determination of the 3D location of the nodules.
The main objective of the proposed work is the development of a lung nodule detection algo-rithm dedicated to juxta-pleural nodules. The resulting CADe system can either serve as a tool to guide physicians in the location of this type of nodules or integrate a more complex system as the first step indicated above. Ideally, CADe systems should guarantee the correct localization of all the nodules in the scan (true positives, TP) and reduce/eliminate erroneous detections (false pos-itives, FP). A review of works regarding lung nodule detection in CT images is presented in this chapter. Note that in our review it is assumed that the lung volume is already correctly segmented, which may prove to be challenging (Novo et al. (2014)).
The analyzed works were selected by using mainly the following criteria: i) the publishing year should be 2006 or higher (at most 10 years old); ii) validation should preferably be performed in the LIDC/IDRI dataset, simplifying direct comparison between works and iii) the main focus of the work should be nodule detection. The reviewed works were researched using GoogleScholar, Scopus and ScienceDirect search engines. The keywords used for searching general lung nodule detection approaches were lung, nodule detection, CT. For juxta-pleural nodules, the used key-words were pleural, juxtapleura, juxtapleural, juxta-pleura, juxta-pleural and nodule detection.
2.1
Lung nodule detection steps
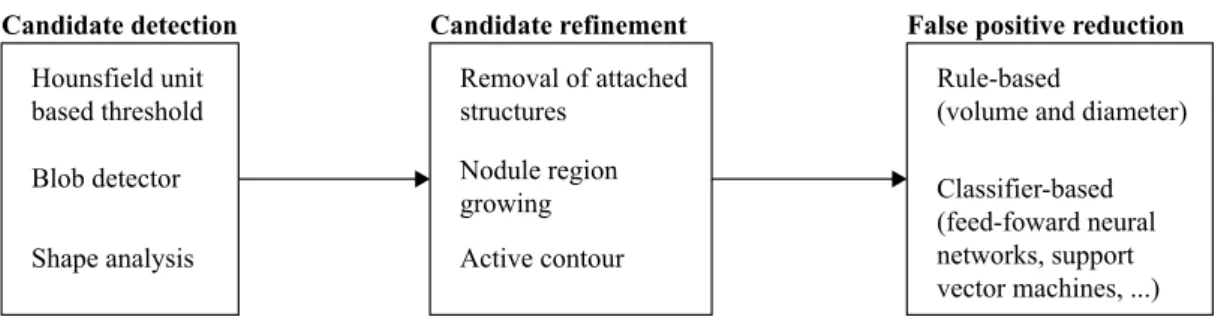
The overall structure of a lung nodule detection algorithm is depicted in Fig. 2.1.
A lung nodule detection algorithm is usually comprised by 3 parts: i) candidate detection (section 2.1.1), ii) candidate refinement (section 2.1.2) and iii) FP reduction (section 2.1.3). An explanation of each of these parts is given in the remaining of this section. Special attention should
Candidate detection Shape analysis Hounsfield unit based threshold Blob detector Candidate refinement Removal of attached structures Nodule region growing Active contour
False positive reduction Rule-based
(volume and diameter) Classifier-based (feed-foward neural networks, support vector machines, ...)
Figure 2.1: Overall structure of a lung nodule detection algorithm.
be given to shape analysis and active contour methods, for candidate detection and refinement, respectively, as they can be used for juxta-pleural nodule detection.
2.1.1 Candidate detection
The first step is the detection of nodules candidates. This procedure should ideally guarantee a 100% sensitivity, i.e., all the existing nodules should be detected. Usually, the resulting number of FP is very high as we are still in an initial detection stage. The initial candidate detection can be achieved by HU intensity-based thresholding, by using blob detectors or by using region growing of the parenchyma to detect the regions/structures of interest. The latter is of interest for the detection of juxta-pleural nodules, because juxta-pleural nodules with solid texture cause deformations in the limits of the lung mask.
HU intensity-based methods The standardization of CT imaging techniques allows the fast identification of anatomic structures via HU intensity-based threshold (Fig. 1.2). The simplicity and low computational costs make this method attractive for initial candidate location (Pu et al. (2008); Messay et al. (2010); Han et al. (2015); Jacobs et al. (2014); Setio et al. (2015)). These methods allow to obtain both location and a rough segmentation of the candidates. HU thresh-olding can be performed considering one or multiple threshold levels. For instance, Setio et al. (2015) used an intensity threshold of −300 HU to identify solid nodules. Alilou et al. (2014), on the other hand, combined the result of multiple threshold levels to identify lung nodules. Note that, by themselves, HU intensity-based threshold methods seem to not be viable for juxta-pleural nodule location due to the intensity similarity between nodules and fat tissue (Ta¸scı and U˘gur (2015)). They can, however, be of interest for preliminary detections if a proper lung segmenta-tion is available.
Region growing of the parenchyma, based on known HU values, can also be used for the initial detection of candidates. Seed points in the parenchyma are selected via analysis of the HU histogram. The intensity of the neighbor pixels of the seed points is studied. If the pixels respect a given threshold criteria, they are included in the region. The threshold is reestablished based on the new region. The process is performed iteratively until no more pixels are added (Ridler and
2.1 Lung nodule detection steps 11
Calvard (1978)). Once the region growing process is complete, the candidates can be obtained by subtracting the resulting mask to a lung mask (Cascio et al. (2012)).
Blob detectors Blob detection-based methods are used for enhancement or detection of rounded/ spherical structures. The rounded shape of the nodules makes blob detectors a viable method for initial candidate location. Furthermore, these methods, unlike simple thresholding, are more robust to the presence of adjacent structures, such as vessels. A common blob detector has the following stages: for all voxels, a 3×3 Hessian matrix is calculated by using the response of the second order derivative of a 3D-equivalent Gaussian curve. Then, the eigenvalues |λ3| ≤ |λ2| ≤ |λ1| are
retrieved. The eigenvalues allow to compute blobness metrics. Retico et al. (2008); Guo and Li (2012); Choi and Choi (2014) used the metric described in Li et al. (2003):
zdot(λ1, λ2, λ3) = |λ3|2/|λ1| if λ1< 0, λ2< 0, λ3< 0 0 if otherwise (2.1)
Murphy et al. (2009); Novo et al. (2015) consider the shape index (SI) and curvedness (CV):
SI= 2 πarctan ( λ1+ λ2 λ1− λ2 ) , CV = q λ12+ λ22 (2.2)
The obtained values are used for the detection of the candidates. For this purpose, a fixed threshold, average of local maximum or other thresholding techniques can be used. Blob detec-tors can consider one or multiple scales. For the latter, the maximum response for each scale is combined for the final output. Multiple scale approaches usually show better results as the filter responses for several nodule diameters can be analyzed.
Shape analysis methods Juxta-pleural nodules are attached to the boundaries of the lungs. Also, these nodules have a similar intensity to non-parenchymal tissue. As a consequence, lung segmen-tation masks usually include deformations/concavities caused by the presence of these nodules (De Nunzio et al. (2011)). Detection of juxta-pleural lung nodules can be performed by detecting con-cavities in the lung mask. Concon-cavities can be found by using α-hulls (De Nunzio et al. (2011); Ta¸scı and U˘gur (2015)). The α-hull is a generalization of the convex-hull concept. The shape of the α-hull depends on the parameter α: given a set of points S, “the α-hull of S is the intersec-tion of the closed components of all the circles of radius r=1/α, such that the intersecintersec-tion of these circles with S is empty” (De Nunzio et al. (2011)). A low α value means higher curvature radius of the hull; in the limit, if α=0, a convex-hull is obtained. By using different values of α and by subtracting the resulting hulls to the initial mask, it is possible to find the concavities. This method also allows to obtain a segmentation of the candidate. Fig. 2.2 illustrates the discussed process.
Juxta-pleura nodules can be detected by evaluating the directional-gradient concentration, as described in Retico et al. (2009). The directional-gradient concentration consists in the analysis of the number of intersections of the surfaces normals. The pleural surface can be discretized by a finite number of triangular elements. Each of these triangles has a vector normal to its surface.
Pleural surface α-hull
segmented nodule
i ii iii iv
Figure 2.2: Steps for juxta-pleural lung nodule detection using α-hulls. i) juxta-pleural lung nod-ule; ii) pleural surface; iii) α-hull partially overlaying the pleural surface; iv) segmented nodule, resulting from the subtraction of the α-hull to the pleural surface.
The voxels adjacent to the pleural surface are scored according to the number of intersections of normal directional lines that occur in it. Regions with high concentration of intersections indicate prominences in the pleura, which, by its turn, are indicative of the presence of lung nodules. The detection method using the directional-gradient concentration is illustrated in Fig. 2.3.
Pleural surface Surface normals High concentration region
i ii iii iv
Figure 2.3: Steps for juxta-pleural lung nodule detection using directional-gradient concentration. i) juxta-pleural lung nodule; ii) pleural surface; iii) normals to the surface; iv) detection of the nodule as the region with higher surface normals overlap.
2.1.2 Candidate refinement
The candidate detection step usually results either in a rough segmentation or in the approximate coordinates of the centroid of the nodule candidates. Also, the number of FP candidates is high. Prior to reducing the number of FP, it is necessary to remove possible attached structures (such as vessels or the pleural wall) and correct the segmentation of the nodule. The removal of con-nected structures is usually performed using morphological operations. Segmentation can either be performed by intensity-based region growing or by using active contours techniques.
Removal of attached structures Structures like vessels or the pleural wall have HU values sim-ilar to lung nodules. Lung nodules can appear near vessels and the pleural wall (juxta-vascular and juxta-pleural nodules, respectively). As a consequence, after candidate detection, these nod-ules may be attached to these structures. The removal of the attached structures can be performed using morphological operations (Okada et al. (2005); Messay et al. (2010); Badura and Pietka (2014)). A binary structuring element is shifted over the binary mask of the candidates. If the
2.1 Lung nodule detection steps 13
structuring element matches partially or completely the current portion of the mask, the respective pixel of interest is changed to 1 (dilation) or 0 (erosion). Opening, which is an erosion followed by a dilation using the same structuring element, is often used. Both 2D and 3D morphological operations can be used. 2D operations are less computationally complex, which may prove to be advantageous (Messay et al. (2010)).
Intensity-based region growing Nodule segmentation can be performed using intensity-based region growing. The seed points needed for region growing are obtained from the rough segmen-tation resulting from the initial candidate detection or by considering the candidates’ centroid. 3D region growing is a common candidate refinement technique (Murphy et al. (2009); Guo and Li (2012); Brown et al. (2014); Setio et al. (2015)). As stated in section 2.1.1, a region growing algorithm is an iterative process of inclusion of neighbor pixels with similar characteristics. In a 3D algorithm, the neighbors from the same slice and adjacent slices are analyzed. Region growing algorithms are effective for the segmentation of isolated nodules. However, using region growing in nodules near other anatomic structures may result in the inclusion of these structures in the candidate due to the similarity in intensity.
Active contour Active contours are a computer vision technique that allow to segment images by delineation of the structure of interest. Due to their complexity but good results, active con-tours are often used for nodule classification instead of nodule detection, as shape is an essential characteristic to classify a nodule (Armato et al. (2011)). Nevertheless, active contour techniques can also be used for candidate refinement in nodule detection algorithms (Cascio et al. (2012)). This technique may be of interest for juxta-pleural nodule detection as it is more robust to the in-clusion of adjacent structures than region growing. A standard shape is initialized in the candidate region. Then, the position of interrelated points is iteratively updated considering two types of energy, internal and external. The internal energy (Energyinternal) is inherent to the model itself.
It regulates how the model contracts and curves to adapt to the shape to segment. External en-ergy, on the other hand, regards the contribution of the image to the final shape. External energy (Externalenergy) is a function of the gradient of the image intensity. For segmentation of lung
nod-ules, higher gradient values and low intensity values imply lower external energy. The objective of the process is to minimize the overall model energy, resulting from the contribution of each model point p (Terzopoulos and Fleischer (1988); Cascio et al. (2012)):
Energytotal = min(
∑
p[Energyinternal(p) + Energyexternal(p)]) (2.3)
2.1.3 False positive reduction
The initial candidate detection produces a high number of FPs. The candidate refinement step allows to improve the segmentation of the candidates. The last step is the reduction of the number of FPs based on the characteristics of the candidates. Two procedures are used: first, a ruled-based
analysis is performed to eliminate candidates that obviously are not nodules; then, features are retrieved from the remaining candidates for classification in nodule or non-nodule.
Rule-based false positive reduction The majority of works addressing lung nodule detection focus on nodules with diameter ranging approximately between [3 30](mm). This happens be-cause nodules with higher radius are easy to detect and small nodules appear to not have much importance for immediate diagnosis (Setio et al. (2015); Valente et al. (2016)). Both diameter and volume (equivalent to a sphere of the same diameter) are commonly used for eliminating candi-dates that obviously are not lung nodules (Cascio et al. (2012); Alilou et al. (2014); Han et al. (2015); Setio et al. (2015)). It is important that no TP are removed during this process. Conse-quently, a more relaxed criteria should be used if the candidates tend to attach to other structures.
Classifier-based false positive reduction Rule-based restrictions allow to reduce the number of FPs. However, the number is still too high. A more refined candidate selection is performed using classifiers. Classification consists in the use of a set of features to give a category to a new observation (Smola and Vishwanathan (2014)). Prior to the classification, the classifier must be trained using features from known observations (such as the ground-truth). Classifier training can be supervised, if training labels (categories) are provided or unsupervised if that does not happen. Supervised learning is usually used for FP reduction by considering the labels nodule or non-nodule. The most common features are geometrical (volume, diameter, number of voxels), shape-related (using the Hessian matrix to assess blobness, for instance) and intensity-based (Murphy et al.(2009); Tan et al. (2013); Ta¸scı and U˘gur (2015)). Furthermore, Choi and Choi (2014) used the histogram of the surface normals and Setio et al. (2015) considered the location of the nodules as a feature for classification.
Several types of classifiers are used for lung nodule candidate FP reduction. Some of the most used classifiers are support-vector-machines (SVM) (de Carvalho Filho et al. (2014); Valente et al. (2016)), feed-forward neural (FF) networks (Retico et al. (2008); van Ginneken et al. (2010); Lopez Torres et al. (2015)) and the k-nearest neighbor algorithm (kNN) (van Ginneken et al. (2010); Valente et al. (2016)). According to Platt (1998), SVM is, in the linear form, a hyperplane that separates two sets of data while maximizing the minimum distance of the two sets from that plane (i.e., maximizing the margin). Generally, this hyperplane is the result of the mapping of the input space to a feature space using a nonlinear map (Hearst et al. (1998)). Fig. 2.4a depicts the principle of the SVM.
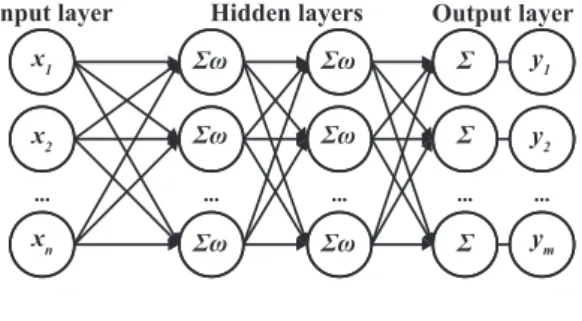
Feed forward neural networks are a kind of artificial neural networks where information travels in a single direction, from input to output. According to Davidian (1995), FF networks are usually composed by an input layer, where features are fed, hidden layers, where information is processed, and an output layer that gives the final classification. Each hidden layer is composed by a certain number of neurons placed in parallel. By its turn, each neuron weights a given combination of the inputs of the previous layer processed by an activation function (a sigmoid function, for instance).
2.2 Representative lung nodule detection algorithms 15
Maximize distance to nearest point
Input space Feature space
(a) Support vector machines can be considered as a hyperplane that maximizes the minimum distance from that plane. Image adapted from Platt (1998); Hearst et al. (1998).
Input layer Hidden layers Output layer
... ... x1 x2 xn ... ... y1 y2 ym ... ... Σω Σω Σω ... ... Σω Σω Σω ... ... Σ Σ Σ
(b) Standard architecture of a feed-forward neural network. x is the input, y the output and ω is an activation function. Image adapted from Wolfram-Mathematica. Feature n Feature m k = 1 k = 5 ?
(c) k-nearest neighbors algorithm considering different k values. The unknown observation (H) is labeled as l if k= 1 and asn if k = 5. Imaged adapted from Ajanki (2007).
Figure 2.4: Commonly used classifiers for false positive reduction of nodule candidates.
The training of the FF network is performed iteratively by feeding new data until the best result is achieved. A standard architecture of a FF network is shown in Fig. 2.4b.
The kNN algorithm (Wu et al. (2008)) classifies a new observation feature vector by evaluating the distance of each feature to the k nearest labeled observations (neighbors). The label of the new observation corresponds to the most common label among the neighbors. The Euclidean distance can be used for finding the nearest neighbors. The classification depends on the parameter k, as represented in Fig. 2.4c.
2.2
Representative lung nodule detection algorithms
Some of the most representative works for lung nodule detection in CT images, both in terms of performance and detection technique, are now detailed. Please refer to section 2.1 for a com-prehensive description of the methods used. The performance of the methods is shown using sensitivity per a given average number of FP/scan. The discussed works used the LIDC-IDRI dataset.
Cascio et al. (2012) used 3D mass-spring models for nodule detection. First, seed points are selected by subtracting a region growing of the parenchyma to a mask of the lung volume. A spherical mesh is initialized for each of the seeds. The position of each of the sphere’s vertexes
is updated in order to minimize the model’s energy (similar to an active contour model). Spline curves are then used for reconstructing the surface of the candidate. FPs are reduced by removing all candidates with diameter 6∈ [3 50] (mm). Geometrical and intensity distribution features are then retrieved. FP reduction is further performed using a trained three layer feed forward neural network. The algorithm achieved 88% sensitivity (2.5 FP/scan) and 97% (6.1 FP/scan).
Alilou et al. (2014) used a multiple threshold method to detect nodules candidates. Fixed HU threshold levels were determined by examination of the dataset. For each threshold level, resid-ual structures such as attached vessels are eliminated with a 2D morphological opening. Then, blobs with diameter 6∈ [4 30] (mm) are removed. The resulting binary masks of all levels are com-bined using logical "OR". A greedy forward method was used for selecting 3D geometrical, 3D intensity-based, 2D geometrical and 2D intensity-based features. A SVM classifier with a radial-based-function kernel labels the candidates as "nodule" or "non-nodule". The method achieved a 80% sensitivity with 3.9 FP/scan and a maximum sensitivity of 90%.
Choi and Choi (2014) developed a detection method based on a angular histogram of surface normals (AHSN) feature. First, candidate nodules are detected by using a multi-scale Gaussian blob detector technique. For each scale, the threshold considers the average of the local maxi-mum dot values (value based on the eigenvalues of the Hessian matrix). Using eigenvalues of the Hessian matrix, the histogram of the surfaceness of the candidate is obtained. Histogram peaks corresponding to walls are removed. This histogram is used in a trained SVM classifier to reduce the number of FPs. This method obtained a sensitivity of 97.5% with 6.76 PF/scan.
Han et al. (2015) proposed a vector quantization-based approach to detect nodules in CT scans. The histogram of the lungs is represented by 4 Gaussian curves, which correspond to low-frequency parenchyma, high-frequency parenchyma, blood vessels and nodule candidates. Nodule candidates are considered to belong to the class with the highest average intensity. Vessels and other structures are removed using morphological opening. The number of FP was reduced by experimentally determining the volume-equivalent diameter, 3D elongation and compactness. A SVM classifier with a radial-basis-function considering intensity, geometric and Hessian features further reduces the number of FPs. The algorithm showed a sensitivity of 82.7% (4.0 FP/scan) for all types of nodules and 89.2% (4.14 FP/scan) for juxta-pleural nodules.
Setio et al. (2015) studied large solid nodule (> 10 mm) detection. A fixed HU threshold is used. Then, a multiple stage morphological opening removes attached structures. Nodule can-didates with diameter 6∈ [8 40] (mm) are discarded. Region growing is used for segmenting the remaining candidates. The same size threshold is re-applied. A SVM classifier is used for reduc-ing the number of FPs by considerreduc-ing features as intensity, geometry, blobness (Hessian-based) and location (distance to lung structures). The method has a sensitivity of 98.3% (4.0 FP/scan).
2.2.1 Juxta-pleural nodules specific approaches
The detection of juxta-pleural nodules can be more challenging than other types of nodules. Juxta-pleural nodules are present near the boundaries of the lung. As so, a poor lung segmentation can eliminate these structures. Assuming that the lung segmentation is successful, other problems still
2.3 Results review 17
remain. Segmentation techniques, such as region-growing, are affected by the intensity of the surrounding tissue and the presence of other structures such as bone. Portions of the pleura are usually included during the segmentation process, affecting the performance of the system.
Most works study general approaches, attempting to detect several types of nodules using the same approach (Valente et al. (2016)). To the best of our knowledge there are few works addressing specifically juxta-pleural nodule detection. Three relevant works are described.
Retico et al. (2009) used a directional-gradient concentration analysis to determine the location of juxta-pleural nodules. The pleural surface is retrieved from the segmentation of the lungs using a HU-based threshold. A discrete 3D model, composed of triangular elements, is created by using a marching cube algorithm. The authors evaluate the pleural surface normals. Regions with high surface normals intersections, such as prominent nodules, are considered as candidates. The candidates are detached from the pleural wall by using morphological opening. Geometrical and textural features are used in a feed-forward neural network to reduce the number of FP. The method showed to be susceptible to irregularities of the pleural surface, achieving a sensitivity of 72% with 6 FP/scan. The evaluation was performed in a private dataset.
De Nunzio et al. (2011) proposed an α-hull based system. The lungs were segmented us-ing a region-growus-ing based approach followed by a refinement with morphological operations. The α-hull is a generalization of the convex-hull method. The authors used α-hull to search for concavities in the lung mask, which result from dense juxta-pleural nodules. The approach uses α values equivalent to the nodule radii to detect the candidates. After, geometrical and intensity-based features are extracted. The number of FP is reduced by using a feed-forward neural network. The maximum sensitivity was 92.3%. Ta¸scı and U˘gur (2015) proposed a similar approach. FP re-duction is done using geometrical and texture features with a generalized linear regression model. The obtained sensitivity is not stated.
2.3
Results review
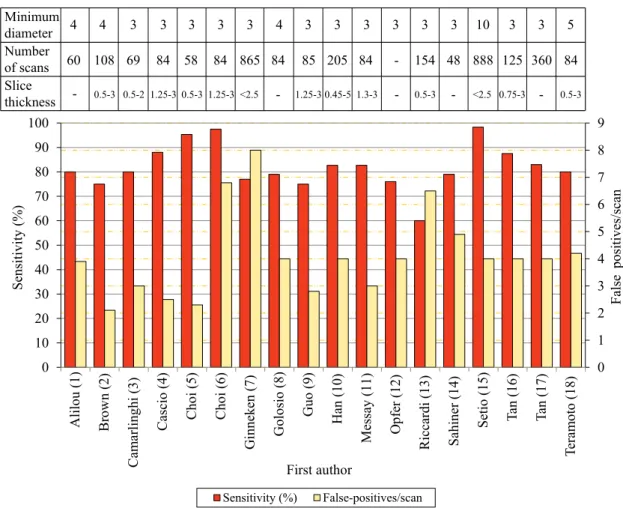
A summary of the sensitivity vs FP/scan results for different nodule detection algorithms (not exclusively dedicated to juxta-pleural) is shown in Fig. 2.5. All the analyzed methods were evalu-ated in the LIDC/IDRI dataset (Armato et al. (2011)). The number of scans used for obtaining the results differs between authors, ranging between 58 and 888. Almost all works studied nodules with a minimum diameter of 3mm. Slice thickness varies between 0.5 and 3mm. The average sensitivity of the analyzed state-of-the art methods is 82% at an average FP rate of 4.1 per scan.
The evaluation of the methods’ performance should consider both sensitivity and FP/scan. Higher sensitivity indicates an increase in the overall capacity of detecting TPs. The performance increases with the sensitivity and decreases with the number of FP/scan. Empirically, the ap-proaches proposed by Cascio et al. (2012), Choi and Choi (2013) and Setio et al. (2015) show the highest performance. However, this conclusion would only be truly valid if all the methods were tested in the same test set with the same conditions. Slice thickness, for instance, is known to affect the performance of algorithms due to the partial-volume effect. High thickness, or poor
0 1 2 3 4 5 6 7 8 9 0 10 20 30 40 50 60 70 80 90 100 False po sit ive s/sc an Sensiti vity (% ) First author Sensitivity (%) False-positives/scan Slice thickness Number of scans Minimum diameter 4 -60 4 108 0.5-3 3 3 3 3 3 4 3 3 3 3 3 3 10 3 3 5 69 84 58 84 865 84 85 205 84 - 154 48 888 125 360 84 0.5-2 1.25-3 0.5-3 1.25-3 <2.5 - 1.25-3 0.45-5 1.3-3 - 0.5-3 - <2.5 0.75-3 - 0.5-3 Alil ou (1) Br ow n (2) Ca m arlin ghi (3) Ca scio (4) Choi (5) Choi (6) G in ne ken (7) G ol osio (8) Guo (9) Han (10) M es sa y (11) O pf er (12) Riccardi (13) Sahiner (14) Setio (15) Tan (16) Ta n (17) Tera m oto (18)
Figure 2.5: Sensitivity (%) and respective number of false positives/scan for different methods. The minimum nodule diameter (mm), range of slice thickness (mm) and number of scans studied are also shown. Values retrieved from: 1) Alilou et al. (2014); 2) Brown et al. (2014); 3) Camar-linghi et al. (2012); 4) Cascio et al. (2012); 5) Choi and Choi (2013); 6) Choi and Choi (2014); 7) van Ginneken et al. (2015); 8) Golosio et al. (2009); 9) Guo and Li (2012); 10) Han et al. (2015); 11) Messay et al. (2010); 12) Opfer and Wiemker (2007); 13) Setio et al. (2015); 14) Han et al. (2015); 15) Setio et al. (2015); 16) Tan et al. (2011); Setio et al. (2015); 17) Tan et al. (2013); 18) Teramoto and Fujita (2013).
resolution in the direction normal to the anatomical axial plane, leads to discretization and nodule blurring, hindering results (van Ginneken et al. (2010); Brown et al. (2014)). The hit criterion should also be taken into consideration, as it defines if a final candidate should be classified as TP or FP. A common method is to evaluate the distance between the candidate and the ground truth. For instance, if the center of candidate lies in a sphere centered in the ground truth and with 1.5× the radius of the ground truth, then the candidate is a TP. Once hit, the respective ground truth should be removed from the analysis list to avoid false TPs. The hit criterion is commonly not stated by the authors, which affects the validation and evaluation of the results. Setio et al. (2015) have a high sensitivity value with a low FP/scan (98.4%;4 FP/scan). However, they only studied large nodules, which are more easy to detect, segment and classify. Furthermore, they did not consider as FP all the candidates that hit non-nodule structures. The method proposed by Choi
2.3 Results review 19
and Choi (2013) seems to be the one with the highest performance (95.3%;2.3 FP/scan). However, the number of scans studied is low when compared with other works. The small number of cases does not show if algorithm would be capable of maintaining the same performance with a second set of images. Also, the hit criterion presented by the authors is dubious as it does not clearly state if the ground truth of a given nodule is only considered once.
Based on the studied steps of the methods it is difficult to state which combination provides a better overall performance. Several detection methods are used but the most common tend to be HU-based threshold and blob detectors. In terms of candidate refinement, the revision of the works indicates that active contour-based methods show a good performance, followed by region growing. FP using rules seems to greatly enhance results and is commonly used. Both SVM and FF networks greatly reduce the number of FP. To conclude, a high sensitivity initial candidate detection with a low number of FP followed by a good FP reduction classifier step should be the goal of a lung nodule CADe detection system.
2.3.1 Detection per nodule type
0 10 20 30 40 50 60 70 80 90 100
Small Large Isolated Vascular Pleural Peri-fissural All
Av era ge sensi vity ( % ) Nodule type
Fujitalab Region growing volume plateau Channeler Ant model Voxel-based neural approach ISI-CAD Philips Lung Nodule CAD
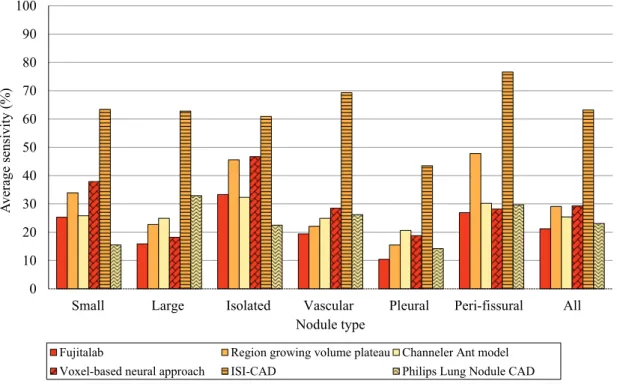
Figure 2.6: Average sensitivity values of several rates of false positives/scan (2−3, 2−2, ..., 23) for different type of nodules and algorithms. Data retrieved from van Ginneken et al. (2010).
Fig. 2.6, based on van Ginneken et al. (2010), shows the performance in terms of average sensitivity of different detection algorithms for various nodule types: i) small (diameter < 5mm), ii) large (diameter ≥ 5mm), iii) isolated, iv) juxta-vascular, v) juxta-pleural and vi) peri-fissural. The sensitivity was evaluated for different numbers of false positives/scan (2−3, 2−2, ..., 23) for each of the studied algorithms. The average sensitivity (per algorithm) was used for comparison
(Fig. 2.6). The performance of the algorithms was analyzed using the dataset from the ANODE09 (2009) challenge. This dataset contains mainly solid nodules, which are characterized per loca-tion. As the evaluation was not performed using the LIDC/IDRI dataset, direct comparison with the lung nodule candidate detection methods revised previously does not allow to draw defining conclusions. However, the average of the results of the different methods (ηnoduletype) allows to
assess the difficulty in detecting each kind of nodule.
The six nodule detection algorithms are: i) Fujitalab, ii) Region growing volume plateau, iii) Channeler Ant model, iv) Voxel-based neural approach, v) ISI-CAD and vi) Philips Lung Nodule CAD (commercial product). Fujitalab detecs nodules using a gradient concentration filter to enhance rounded structures followed by region growing to detect and segment candidates. FPs are first reduced with rules and after with a multi-regression analysis. Region growing volume plateau uses region growing of the parenchyma to detect seed points, followed by a second region growing for nodule segmentation. After rule-based FP reduction, a FF network is used. The Channeler Ant model uses a dynamic region growing process (homonymous to the work) to detect candidates. Classification is performed using a FF network. The Voxel-based neural approach uses blob detectors to detect nodules in the parenchyma and the directional-gradient concentration to detect juxta-pleural nodules. Features are extracted from the surrounding region and classified using a FF network. ISI-CAD computes the shape index and curvedness to detect candidates. Then, two k-kNN classifiers are used, sequentially with different features, to reduce the number of FPs. Please refer to van Ginneken et al. (2010) for a description of each of the methods studied.
Fig. 2.6 allows to draw several conclusions. First, isolated nodules (ηisolated= 40.2 ± 13.6)
show a tendency of higher sensitivity among all type of nodules, i.e., they appear to be the easiest to detect. The good intensity contrast between these nodules and the parenchyma contributes to the obtained sensitivity. Furthermore, the segmentation step is not affected by surrounding structures, such as vessels or the pleural. In fact, nodules that are not attached to large structures, such as isolated and peri-fissural (ηperi f issural= 39.9 ± 19.6) show higher η values than the juxta-vascular
(ηjuxtavascular= 31.7 ± 18.7) and the juxta-pleural (ηjuxtapleural= 20.5 ± 11.8) nodules.
Juxta-pleural nodules show tendency to have the lowest average sensitivity from the analyzed types of nodules. This is true even for the Voxel-based neural approach, which used a dedicated approach for this type of nodule. Overall, this can be justified by the lack of contrast between the nodule and the surrounding tissue and the existence of adjacent structures, which hinder both initial detection and segmentation. Considering the works showed in Fig. 2.6, blob detectors seem to outperform other methods in terms of juxta-pleural nodule detection. However, the performance of the blob detector method for juxta-pleural nodule detection is still lower when compared to other nodules types. Based on the discussed η values, there is need to develop algorithms specially dedicated to the detection of juxta-pleural nodules.
2.4 Concluding remarks 21
2.4
Concluding remarks
Nodule detection algorithms are often composed by an initial candidate detection step, followed by a candidate refinement and reduction of FPs. Initial candidate detection can be performed using methods based on the HU values, by analyzing shape-related characteristics or by using blob detectors. For candidate refinement, morphological operations are used for detaching non-nodule structures from the candidates. Then, region growing or active contours can be used for obtaining a better segmentation of the candidates. The number of FPs is reduced by using fixed rules and classifiers. Several works focused on lung nodule detection in CT images were studied. The detection algorithms show similarities between them, with the main differences occurring in the method used to find the initial candidates.
The detection of juxta-pleural nodules shows to be challenging due to their position near the pleural wall. However, to the best of our knowledge there are few works addressing specifically the detection of this kind of nodules. Initial candidate detection can be performed by using α-shapes to detect concavities, by analyzing the directional-gradient concentration or by using blob detectors. Direct thresholding techniques using HU values are avoidable due to the presence of the pleural wall, except when a proper lung volume segmentation is available. Candidate refinement should be performed by methods other than region-growing, as there is risk to attach a portion of the pleura and adjacent structures to the candidate. Morphological operations are important to detach candidates. Finally, FP reduction should have in consideration not only intensity-related features, but also the nodule geometry and location. SVM, FF networks and the k-NN algorithm are often used for FP reduction.
Based on the unique characteristics of the juxta-pleural nodules and the performance of the reviewed methods, the algorithms proposed by Retico et al. (2009); De Nunzio et al. (2011); Cascio et al. (2012); Choi and Choi (2013); Han et al. (2015); Ta¸scı and U˘gur (2015), as well as the features proposed in Setio et al. (2015), are of major interest to the development of a novel CADe algorithm dedicated to the detection of juxta-pleural nodules.
Chapter 3
Juxta-pleural lung nodule detection
3.1
Method overview
The proposed method to detect juxta-pleural nodules in CT scans is detailed in this chapter. Pre-vious works have achieved high detection performance for nodules with radius ≥ 5mm, including juxta-pleural (Setio et al. (2015)). Consequently, our work focuses on the detection of juxta-pleural nodules with radius ≤ 5mm. Our approach can be divided in:
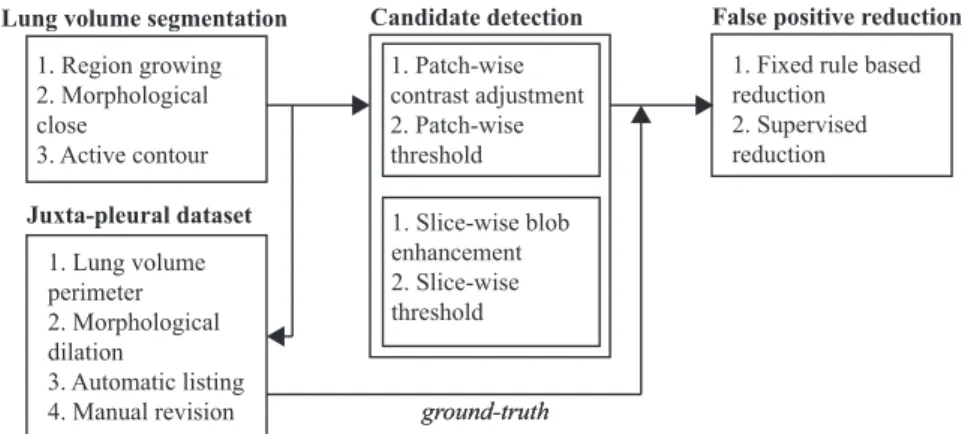
1. lung volume segmentation with inclusion of juxta-pleural nodules by using a region growing-based approach followed by an active contour refinement. Juxta-pleural lung nodules can-didates are only searched inside the segmented region. Please refer to Section 3.2;
2. detection of nodule candidates via threshold and blob enhancement techniques. Solid nod-ules, which have an intensity similar to non-parenchymal tissue, are segmented by selecting an appropriate threshold. Sub-solid and non-solid nodules are first enhanced by using multi-scale Laplacian-of Gaussian-filtering. Please refer to Section 3.4;
3. FP reduction via fixed rules and supervised learning. First, a reduction of FPs is performed by discarding candidates outside a given range of volume-equivalent radius. Then, a SVM classifier is trained to further reduce the number of FPs. Please refer to Section 3.5.
Our method is developed and evaluated using the LIDC-IDRI dataset, the largest publicly available lung nodule dataset. Despite an exhaustive nodule characterization, the ground-truth of the LIDC-IDRI does not classify lung nodules according to their location as juxta-vascular, fissural, isolated and juxta-pleural. Consequently, a method for the creation of a juxta-pleural lung nodule dataset from the LIDC-IDRI is also proposed in Section 3.3.
A schematic representation of the steps of the proposed method is shown in Fig. 3.1. Each of the steps will be detailed in the remaining of this chapter.