Reconstruction on Solid Pulmonary Nodule Volume
Quantification
Martin J. Willemink1*, Jaap Borstlap1, Richard A. P. Takx1, Arnold M. R. Schilham1, Tim Leiner1, Ricardo P. J. Budde1,2, Pim A. de Jong1
1Utrecht University Medical Center, Department of Radiology, Utrecht, The Netherlands,2Gelre Hospital, Department of Radiology, Apeldoorn, The Netherlands
Abstract
Background:The objectives of this study were to evaluate the influence of iterative reconstruction (IR) on pulmonary nodule volumetry with chest computed tomography (CT).
Methods:Twenty patients (12 women and 8 men, mean age 61.9, range 32–87) underwent evaluation of pulmonary nodules with a 64-slice CT-scanner. Data were reconstructed using filtered back projection (FBP) and IR (Philips Healthcare, iDose4-levels 2, 4 and 6) at similar radiation dose. Volumetric nodule measurements were performed with semi-automatic software on thin slice reconstructions. Only solid pulmonary nodules were measured, no additional selection criteria were used for the nature of nodules. For intra-observer and inter-observer variability, measurements were performed once by one observer and twice by another observer. Algorithms were compared using the concordance correlation-coefficient (pc) and
Friedman-test, and post-hoc analysis with the Wilcoxon-signed ranks-test with Bonferroni-correction (significance-level p,0.017).
Results:Seventy-eight nodules were present including 56 small nodules (volume,200 mm3, diameter,8 mm) and 22 large nodules (volume$200 mm3, diameter$8 mm). No significant differences in measured pulmonary nodule volumes between FBP, iDose4-levels 2, 4 and 6 were found in both small nodules and large nodules. FBP and iDose4-levels 2, 4 and 6 were correlated with pc-values of 0.98 or higher for both small and large nodules. Pc-values of intra-observer and inter-observer
variability were 0.98 or higher.
Conclusions: Measurements of solid pulmonary nodule volume measured with standard-FBP were comparable with IR, regardless of the IR-level and no significant differences between measured volumes of both small and large solid nodules were found.
Citation:Willemink MJ, Borstlap J, Takx RAP, Schilham AMR, Leiner T, et al. (2013) The Effects of Computed Tomography with Iterative Reconstruction on Solid Pulmonary Nodule Volume Quantification. PLoS ONE 8(2): e58053. doi:10.1371/journal.pone.0058053
Editor:Chin-Tu Chen, The University of Chicago, United States of America
ReceivedMay 9, 2012;AcceptedJanuary 30, 2013;PublishedFebruary 27, 2013
Copyright:ß2013 Willemink et al. This is an open-access article distributed under the terms of the Creative Commons Attribution License, which permits unrestricted use, distribution, and reproduction in any medium, provided the original author and source are credited.
Funding:The authors have no support or funding to report.
Competing Interests:The authors have declared that no competing interests exist.
* E-mail: [email protected]
Introduction
Since the widespread introduction of chest computed tomog-raphy (CT), pulmonary nodules have become a common incidental finding [1]. Despite the fact that the vast majority of pulmonary nodules are benign [2], they are important radio-graphic predictors for lung cancer and pulmonary metastases. Although some nodules show typical benign characteristics (e.g. calcifications, diameter smaller than 4 mm, peri-fissural location) [3–5], nodule size and growth rate remain the most important imaging predictors for malignancy [6]. Therefore, accurate measurements of nodule size at baseline and growth at follow-up CT are important to differentiate between benign and malignant nodules. Pulmonary nodule size can be calculated using diameter measurements or semi-automated nodule volumetry. Semi-auto-mated software is the preferred method since its repeatability and
ability to detect growth is superior to manual two-dimensional diameter measurements [7].
important for evaluation of additional pathological findings. Nevertheless, the in-vivo effects of IR on pulmonary nodule volume measurements have not been systematically investigated and it may be that IR introduces systematic differences in lung nodule volumetry compared to FBP. Therefore, the objective of this study was to compare solid pulmonary nodule volumes measured with semi-automatic software at standard FBP and multiple IR levels.
Materials and Methods
Subjects
Twenty patients (12 women, mean age 61.9612.0 (standard deviation) years) who underwent a CT of the chest between August 2011 and December 2012 were selected by one observer during clinical duty. These patients were retrospectively included in the study if pulmonary nodules were present. The study population is not a truly consecutive sample of all patients with nodules during the study period. The Utrecht Medical Research Ethics Committee approved this study and agreed to a waiver. Informed consent was waived as the study retrospectivelly used CT scans obtained in routine care in anonymous fashion and no additional CT scans were obtained for the purpose of this study. CT scans were reconstructed using FBP and different IR levels. Scan indications were suspected or known lung carcinoma (N = 11), lung metastases (N = 8) and neuroendocrine lung tumor (N = 1).
CT protocol
Image acquisition was performed on a 64-slice scanner (Brilliance 64, Philips Healthcare, Best, The Netherlands) with moderate edge enhancing reconstruction filter C. Patients underwent a contrast-enhanced chest CT. Image acquisition depended on indication and body weight; tube voltages were either 100 kVp (N = 10) or 120 kVp (N = 10), with a median tube
current-time product of 100 mAs (quartile range 77–115 mAs). Reconstructed slice thickness was 0.9 mm with 0.7 mm increment. Volume CT dose index (CTDIvol) and dose length-product (DLP)
were recorded for each CT exam. An estimate of the effective dose was calculated by multiplying the DLP with the effective dose estimate of 0.0145 mSv/(mGy6cm) for the chest [18].
Image reconstruction
Reconstruction of raw data was performed using standard FBP and three levels of a commercially available IR algorithm (iDose4, Philips Healthcare, Best, the Netherlands) [13;19–21]. IR algo-rithms are developed to allow reduction of CT radiation dose by reducing noise and artefacts. The iterative process comprises the optimization of measured raw data or image data based on the noise reducing IR model, and evaluation of the optimized data by comparison with the measured raw data or image data. With every iteration, the image is updated into an image with less noise, resulting in an optimized final image. Currently available IR techniques range from basic algorithms which only reduce noise of the image data to advanced algorithms that fully iterate with forward and backward reconstruction steps [14;22]. The version of iDose used in the current study, is the fourth generation of Philips’ IR algorithm and reduces noise of both the raw data and the image data. First a Poisson statistics based maximum likelihood denoising algorithm is used to identify and correct the noisiest raw CT data while preserving edges [21]. Subsequently, images are reconstructed from the denoised raw data. Uncorrelated noise in the images is decreased by iterative filtering. Noise reduction level can be adjusted by choosing one of seven levels. Higher levels lead to more noise reduction. We used iDose4levels 2, 4 and 6 in the present study. According to the manufacturer these levels result in 16, 29 and 45% noise reduction, respectively [23].
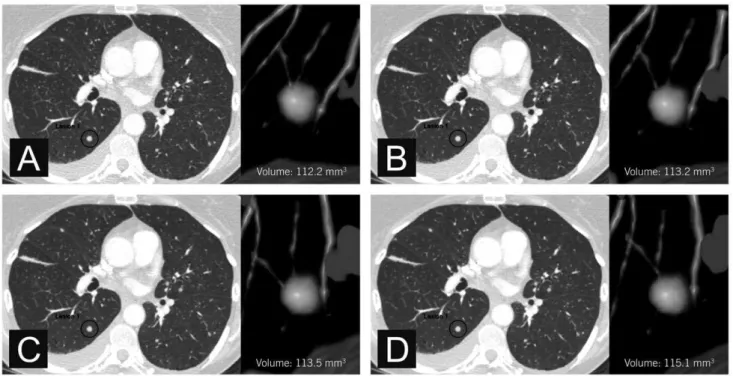
Figure 1. Axial CT images of a small pulmonary nodule. Measured volumes were 112.2 mm3 (A, FBP), 113.2 mm3(B, iDose4 level 2),
113.5 mm3(C, iDose4level 4), and 115.1 mm3(D, iDose4level 6).
Volumetry protocol
Volumetric measurements of pulmonary nodules were per-formed using commercially available semi-automatic software (IntelliSpace version 4.0.0.40259, Philips Healthcare, Best, the Netherlands) on a dedicated CT workstation. Only solid nodules were measured, no additional selection criteria were used for the nature or location of nodules. Criteria for solid nodules were in accordance with the Fleischner Society and included well or poorly defined rounded or irregular homogenous opacities with a diameter smaller than 3 cm (smaller than approximately 14,000 mm3) [24]. All measurements were done using the thinnest reconstructed slices (0.9 mm). The software automatically delin-eated the nodule and quantified its volume after placing the cursor within the nodule and clicking with the mouse. No manual adjustments were made, because automatic measurements were visually judged acceptable. For assessment of inter-observer and intra-observer variability, all measurements were performed once by two observers (MW and RT), and twice by one observer (MW) with a time interval of one week.
Data analysis
Volumetric measurements of pulmonary nodules with standard FBP and three IR levels were compared within each subject. Lin’s concordance correlation coefficient (pc) was used to assess the
agreement of measurements, because this method takes into account the correlation as well as the distance to the line of identity [25]. Poor agreement is defined as pc,0.90, whereas higher pc
-values represent moderate (0.90# pc ,0.95), good (0.95# pc #0.99), or excellent (pc .0.99) agreement [26]. Statistical
differences of variables within subjects were compared using the Friedman test and post-hoc tests were performed with the Wilcoxon signed ranks test. The statistical significance level of
the Friedman test was set at a p-value below 0.05 and for post-hoc tests at a p-value below below 0.017 based on the Bonferonni correction for three comparisons (FBP with level 2, level 4 and level 6, respectively). Measured volume differences of 25% or more were defined to be clinically relevant, based on the findings of De Hoop and colleagues [1]. Values are given as medians with quartile ranges, unless otherwise stated. Statistical analyses were performed by using SPSS version 20.0 (SPSS Inc, Chicago, Illinois, USA) and MedCalc statistical package version 12.2.0.0 (MedCalc Software, Mariakerke, Belgium).
Results
The mean age of the twenty included subjects (12 female, 60%) was 61.9 (range 32–87) years. The median CTDIvolwas 4.3 mGy
(3.5–7.1 mGy), the median DLP was 207.8 mGy*cm (156.7– 313.1 mGy*cm), and the median effective dose was 3.1 mSv (2.3– 4.5 mSv). Within these twenty subjects, 78 nodules were found including 56 small nodules (volume ,200 mm3, diameter
,8 mm) and 22 large nodules (volume $200 mm3, diameter
$8 mm). Numbers of nodules per patient ranged from 1 to 15 and therefore nodules are not fully independent. The measured pulmonary nodule volumes are listed in Table 1.
Small nodules
In small nodules (volume ,200 mm3, diameter,8 mm), the median pulmonary nodule volume at FBP, iDose4levels 2, 4 and 6 was 77.5, 74.5, 72.8 and 73.8 mm3, respectively. The Friedman
test showed that differences were not significant (p = 0.910). Two small nodules were measured with differences$25% compared with FBP (231% (nodule volume 193.0 mm3, iDose4level 6) and +44% (nodule volume 59.8 mm3, iDose4 level 6)). All IR levels showed substantial agreement with FBP measurements with a
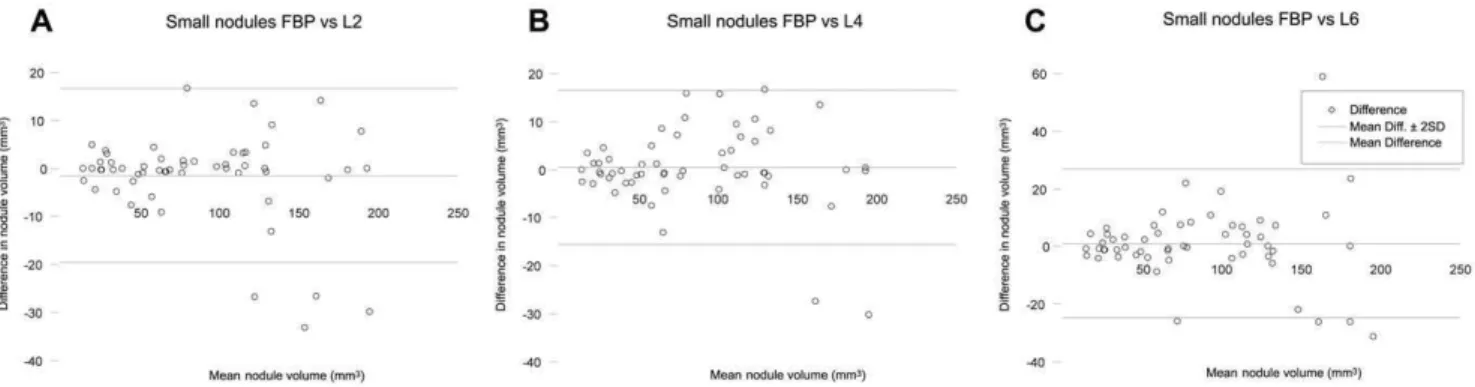
Figure 2. Agreement of small pulmonary nodule measurements. Bland-Altman plots of CT measured nodule volume at filtered back projection (FBP) and iterative reconstruction (iDose4level 2 (A), 4 (B) and 6 (C)) for small nodules. The horizontal axis shows the mean value of the measured nodule volume with FBP and iterative reconstruction. The vertical axis shows the difference between the measured nodule volume with FBP and iterative reconstruction.FBPFiltered back projection;L2Level 2;L4Level 4;L6Level 6.
doi:10.1371/journal.pone.0058053.g002
Table 1.Results of pulmonary nodule measurements.
FBP iDose4L2 p-value iDose4L4 p-value iDose4L6 p-value*
Small nodules(mm3) 77.5 (40.8–127.0) 74.5 (45.8–127.4) NS 72.8 (43.1–119.0) NS 73.8 (39.4–120.8) NS
Large nodules(mm3) 520.8 (346.2–881.4) 525.0 (363.8–912.7) NS 526.5 (347.1–870.8) NS 531.3 (318.0–864.3) NS
CT measured pulmonary nodule volumes using filtered back projection (FBP) and iterative reconstruction (iDose4level 2, 4 and 6). Values are presented as medians with interquartile range.
concordance correlation coefficient (pc) of 0.98 for iDose4level 2,
0.99 for iDose4level 4, and 0.97 for iDose4level 6. Figure 1 shows an example of a small pulmonary nodule. Results of the measured volumes for small nodules are demonstrated in Figure 2.
Large nodules
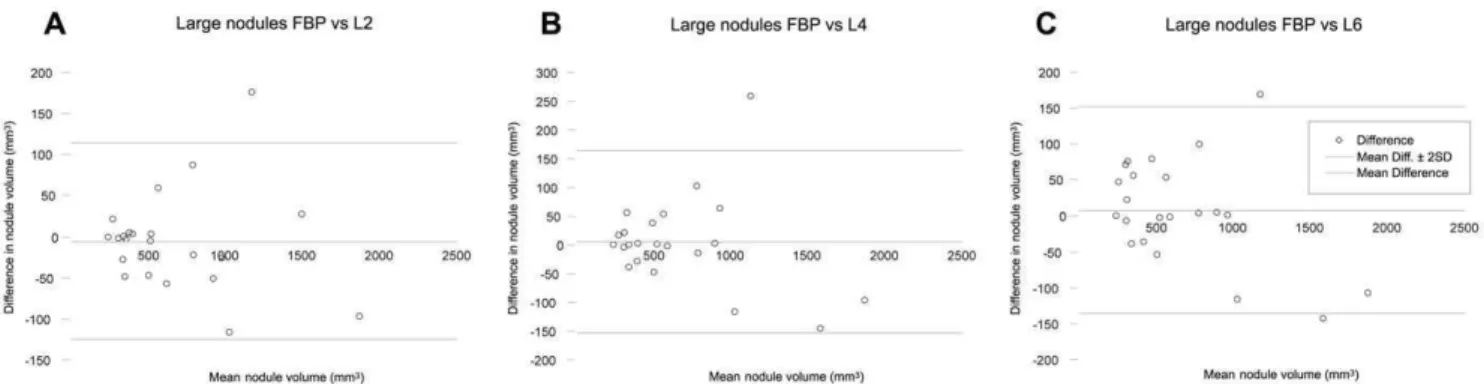
In large nodules (volume$200 mm3, diameter $8 mm), the median pulmonary nodule volume measured with iDose4levels 2, 4 and 6 was 525.0, 526.5 and 531.3 mm3, respectively, which was slightly larger compared to FBP (520.8 mm3). Again, no significant differences were found between measured nodule volumes at FBP, iDose4 level 2, 4 and 6 (p = 0.684). No large nodules were measured with differences $25% compared with FBP. Further-more, all IR levels showed substantial agreement with FBP measurements (pcwas 0.99 at iDose4levels 2 and 6, and 0.98 at
iDose4level 4). Results of the measured volumes for large nodules are demonstrated in Figure 3.
Intra-observer and inter-observer variability
The results of the intra-observer and inter-observer variability assessment are listed in Table 2. There were no significant differences between nodule volume measurements of the two observers (all p.0.05) for both small and large nodules. Intra-observer and inter-Intra-observer variability were good or excellent for small nodules as well as for large nodules (all pc$0.98).
Discussion
Iterative CT reconstruction is an interesting method for noise reduction and improving image quality that is now provided on the CT scanners of all major vendors. Previous studies have shown that nodule volumetry is possible on low-dose chest CT and that IR allows for radiation dose reduction of chest CT while image quality is maintained at low-dose CT [8;27;28]. Thus, it is to be expected that IR will soon be widely implemented for clinical use, but it is unknown whether nodule volumetry is affected by IR. We found that pulmonary nodule volumes measured with standard FBP were comparable with IR, regardless of the IR level and no significant differences between measured volumes of both small solid nodules and large solid nodules were found.
To our knowledge, no in-vivo study has been performed to analyze the effects of IR on pulmonary nodule volume measure-ments. One study researched the effect of IR on the performance of a pulmonary nodule computer-aided detection system in terms of sensitivity and specificity [29], however the effect on nodule volumetry was not analyzed. Another study evaluated the effect of IR in a phantom on in-vitro lung nodule volumetry, resulting in similar results as our current findings [30]. The finding of the current study that IR does not affect solid pulmonary nodule volume measurements is relevant, since it demonstrates that it is
Figure 3. Agreement of large pulmonary nodule measurements.Bland-Altman plots of CT measured nodule volume at filtered back projection (FBP) and iterative reconstruction (iDose4level 2 (A), 4 (B) and 6 (C)) for large nodules. The horizontal axis shows the mean value of the
measured nodule volume with FBP and iterative reconstruction. The vertical axis shows the difference between the measured nodule volume with FBP and iterative reconstruction.FBPFiltered back projection;L2Level 2;L4Level 4;L6Level 6.
doi:10.1371/journal.pone.0058053.g003
Table 2.Intra-observer and inter-observer variability.
Small nodules Large nodules
p-value pc-value p-value pc-value
FBP Observer 1–1 vs observer 1–2
0.068 0.98 0.317 0.99
Observer 1–1 vs observer 2
0.075 0.98 0.317 0.99
Observer 1–2 vs observer 2
0.854 1.00 0.317 1.00
iDose4
L2
Observer 1–1 vs observer 1–2
0.655 1.00 0.655 1.00
Observer 1–1 vs observer 2
0.465 1.00 0.317 1.00
Observer 1–2 vs observer 2
0.593 1.00 0.285 1.00
iDose4
L4
Observer 1–1 vs observer 1–2
0.080 0.99 1.000 1.00
Observer 1–1 vs observer 2
0.109 1.00 0.180 1.00
Observer 1–2 vs observer 2
0.285 1.00 0.180 1.00
iDose4
L6
Observer 1–1 vs observer 1–2
0.500 0.99 0.317 1.00
Observer 1–1 vs observer 2
0.463 0.99 0.317 1.00
Observer 1–2 vs observer 2
0.893 1.00 1.000 1.00
P-values and concordance correlation coefficients (pc-values) of measured pulmonary nodule volumes using filtered back projection (FBP) and iterative reconstruction (iDose4level 2, 4 and 6) by two observers.
safe to convert FBP protocols to IR for solid pulmonary nodule volumetry. This also accounts for patients who are already in a follow-up scheme. Since reducing the radiation dose affects the overall image quality of FBP reconstructed chest CTs, IR may be applied to reduce the radiation dose without compromising on overall image quality. This is important, because chest CTs are not only used for lung nodule volumetry but also for evaluation of other pathological findings. Our study suggests that IR has no clinically relevant effect on pulmonary nodule volume measure-ments. This is probably because IR algorithms do not only reduce noise but also preserve edges which prevents tissue borders from becoming blurry. Moreover, contrasts between air and pulmonary tissues are intrinsically large. These volume measurement effects might be different in other parts of the body that have less contrast on CT.
In our study we had some outliers. De Hoop et al. [1] found 16.4% to 22.3% variability in pulmonary nodule volumetry between different scans. A change in measured nodule volume of 25% is exceeding the normal variability of subsequent scans and can be regarded as nodule growth. As IR provides similar results compared to FBP it is expected that the 25% rule is maintained when using IR although we did not study interscan variation. Two small nodules were measured with clinically relevant differences of
$25% between FBP and IR. Re-measuring these nodules resulted in the same values. The large differences in these small nodules can possibly be explained because minor absolute differences result in large relative differences.
The intra-observer and inter-observer variability of our study was good to excellent. This is in accordance with previous studies who have shown that nodule volume measurements with
semi-automatic software have good reproducibility [31;32]. Note that the only manual observer interaction with the software was selection of the seed point.
The present study has limitations. CT scanners, IR technique and semi-automatic software package were used from a single vendor and we cannot comment on other vendors or software packages. Therefore, future research with hardware from other vendors is recommended. Furthermore, volumetry was performed on routine chest CTs and the effect of lowering radiation dose on nodule volumetry was not analyzed. Nevertheless, prior work has demonstrated that pulmonary nodule volumetry was not affected by dose [15;16]. But future research on the effects of even lower radiation doses with IR would be of great interest.
In conclusion, this study found that CT volumetry of solid pulmonary nodules did not result in clinically relevant differences with iterative reconstruction.
Acknowledgments
The authors would like to thank Robert Valkenburg, Anne Manders, Jamal Moumni and Karin Thijn for technical assistance and Paul Westers for statistical advice.
Author Contributions
Conceived and designed the experiments: MJW JB AMRS TL RPJB PAdJ. Performed the experiments: MJW JB RAPT. Analyzed the data: MJW TL RAPT RPJB PAdJ. Contributed reagents/materials/analysis tools: MJW JB AMRS TL RPJB PAdJ. Wrote the paper: MJW JB RAPT AMRS TL RPJB PAdJ.
References
1. de Hoop B, Gietema H, van Ginneken B, Zanen P, Groenewegen G, et al. (2009) A comparison of six software packages for evaluation of solid lung nodules using semi-automated volumetry: what is the minimum increase in size to detect growth in repeated CT examinations. Eur Radiol 19: 800–808.
2. Yankelevitz DF, Reeves AP, Kostis WJ, Zhao B, Henschke CI (2000) Small pulmonary nodules: volumetrically determined growth rates based on CT evaluation. Radiology 217: 251–256.
3. Ahn MI, Gleeson TG, Chan IH, McWilliams AM, Macdonald SL, et al. (2010) Perifissural nodules seen at CT screening for lung cancer. Radiology 254: 949– 956.
4. MacMahon H, Austin JH, Gamsu G, Herold CJ, Jett JR, et al. (2005) Guidelines for management of small pulmonary nodules detected on CT scans: a statement from the Fleischner Society. Radiology 237: 395–400.
5. Ost D, Fein AM, Feinsilver SH (2003) Clinical practice. The solitary pulmonary nodule. N Engl J Med 348: 2535–2542.
6. Xu DM, van der Zaag-Loonen HJ, Oudkerk M, Wang Y, Vliegenthart R, et al. (2009) Smooth or attached solid indeterminate nodules detected at baseline CT screening in the NELSON study: cancer risk during 1 year of follow-up. Radiology 250: 264–272.
7. Revel MP, Lefort C, Bissery A, Bienvenu M, Aycard L, et al. (2004) Pulmonary nodules: preliminary experience with three-dimensional evaluation. Radiology 231: 459–466.
8. Pontana F, Duhamel A, Pagniez J, Flohr T, Faivre JB, et al. (2011) Chest computed tomography using iterative reconstruction vs filtered back projection (Part 2): image quality of low-dose CT examinations in 80 patients. Eur Radiol 21: 636–643.
9. Prakash P, Kalra MK, Ackman JB, Digumarthy SR, Hsieh J, et al. (2010) Diffuse lung disease: CT of the chest with adaptive statistical iterative reconstruction technique. Radiology 256: 261–269.
10. Prakash P, Kalra MK, Digumarthy SR, Hsieh J, Pien H, et al. (2010) Radiation dose reduction with chest computed tomography using adaptive statistical iterative reconstruction technique: initial experience. J Comput Assist Tomogr 34: 40–45.
11. Yanagawa M, Honda O, Yoshida S, Kikuyama A, Inoue A, et al. (2010) Adaptive statistical iterative reconstruction technique for pulmonary CT: image quality of the cadaveric lung on standard- and reduced-dose CT. Acad Radiol 17: 1259–1266.
12. Gervaise A, Osemont B, Lecocq S, Noel A, Micard E, et al. (2012) CT image quality improvement using adaptive iterative dose reduction with wide-volume acquisition on 320-detector CT. Eur Radiol 22: 295–301.
13. Utsunomiya D, Weigold WG, Weissman G, Taylor AJ (2012) Effect of hybrid iterative reconstruction technique on quantitative and qualitative image analysis at 256-slice prospective gating cardiac CT. Eur Radiol 22: 1287–1294. 14. Willemink MJ, de Jong PA, Leiner T, de Heer LM, Nievelstein RAJ, et al. (2013)
Iterative reconstruction techniques for computed tomography Part 1: Technical principles. Eur Radiol DOI: 10.1007/s00330-012-2765-y. In press.
15. Hein PA, Romano VC, Rogalla P, Klessen C, Lembcke A, et al. (2009) Linear and volume measurements of pulmonary nodules at different CT dose levels – intrascan and interscan analysis. Rofo 181: 24–31.
16. Hein PA, Romano VC, Rogalla P, Klessen C, Lembcke A, et al. (2010) Variability of semiautomated lung nodule volumetry on ultralow-dose CT: comparison with nodule volumetry on standard-dose CT. J Digit Imaging 23: 8– 17.
17. Willemink MJ, Leiner T, de Jong PA, de Heer LM, Nievelstein RAJ, et al. (2013) Iterative reconstruction techniques for computed tomography Part 2: Initial results in dose reduction and image quality. Eur Radiol DOI: 10.1007/s00330-012-2764-z. In press.
18. Deak PD, Smal Y, Kalender WA (2010) Multisection CT protocols: sex- and age-specific conversion factors used to determine effective dose from dose-length product. Radiology 257: 158–166.
19. Funama Y, Taguchi K, Utsunomiya D, Oda S, Yanaga Y, et al. (2011) Combination of a low-tube-voltage technique with hybrid iterative reconstruc-tion (iDose) algorithm at coronary computed tomographic angiography. J Comput Assist Tomogr 35: 480–485.
20. Habets J, Symersky P, de Mol BA, Mali WP, Leiner T, et al. (2012) A novel iterative reconstruction algorithm allows reduced dose multidetector-row CT imaging of mechanical prosthetic heart valves. Int J Cardiovasc Imaging 28: 1567–1575.
21. Noel PB, Fingerle AA, Renger B, Munzel D, Rummeny EJ, et al. (2011) Initial performance characterization of a clinical noise-suppressing reconstruction algorithm for MDCT. AJR Am J Roentgenol 197: 1404–1409.
22. Beister M, Kolditz D, Kalender WA (2012) Iterative reconstruction methods in X-ray CT. Phys Med 28: 94–108.
23. Scibelli A (2011) iDose4
iterative reconstruction technique. Philips Healthcare Whitepaper. Available: https://www.healthcare.philips.com/pwc_hc/main/ shared/Assets/Documents/ct/idose_white_paper_452296267841.pdf. Accessed 2013 Feb 1.
25. Lin LI (1989) A concordance correlation coefficient to evaluate reproducibility. Biometrics 45: 255–268.
26. McBride GB (2005) A proposal for strength-of-agreement criteria for Lin’s Concordance Correlation Coefficient. NIWA Client Report: HAM2005-062. Available: http://www.medcalc.org/download/pdf/McBride2005.pdf. Ac-cessed 2013 Feb 1.
27. Hu XH, Ding XF, Wu RZ, Zhang MM (2011) Radiation dose of non-enhanced chest CT can be reduced 40% by using iterative reconstruction in image space. Clin Radiol 66: 1023–1029.
28. Singh S, Kalra MK, Gilman MD, Hsieh J, Pien HH, et al. (2011) Adaptive statistical iterative reconstruction technique for radiation dose reduction in chest CT: a pilot study. Radiology 259: 565–573.
29. Yanagawa M, Honda O, Kikuyama A, Gyobu T, Sumikawa H, et al. (2012) Pulmonary nodules: Effect of adaptive statistical iterative reconstruction (ASIR)
technique on performance of a computer-aided detection (CAD) system-Comparison of performance between different-dose CT scans. Eur J Radiol 81: 2877–2886.
30. Willemink MJ, Leiner T, Budde RP, de Kort FP, Vliegenthart R, et al. (2012) Systematic Error in Lung Nodule Volumetry: Effect of Iterative Reconstruction Versus Filtered Back Projection at Different CT Parameters. AJR Am J Roentgenol 199: 1241–1246.
31. Gietema HA, Wang Y, Xu D, van Klaveren RJ, de KH, et al. (2006) Pulmonary nodules detected at lung cancer screening: interobserver variability of semiautomated volume measurements. Radiology 241: 251–257.