Item Response Theory – A First Approach
Sandra Nunes
1,a), Teresa Oliveira
2, b)and Amílcar Oliveira
2, c)1College of Business Administration (ESCE) of Polytechnic Institute of Setúbal (IPS), Campus do IPS – Estefanilha,
Setúbal, Portugal
2Universidade Aberta, Palácio Ceia, Rua da Escola Politécnica, Lisboa, Portugal and
Center of Statistics and Applications, University of Lisbon,
a)Corresponding author: [email protected] b)[email protected]
c)Amí[email protected]
Abstract. The Item Response Theory (IRT) has become one of the most popular scoring frameworks for measurement
data, frequently used in computerized adaptive testing, cognitively diagnostic assessment and test equating. According to Andrade et al. (2000), IRT can be defined as a set of mathematical models (Item Response Models – IRM) constructed to represent the probability of an individual giving the right answer to an item of a particular test. The number of Item Responsible Models available to measurement analysis has increased considerably in the last fifteen years due to increasing computer power and due to a demand for accuracy and more meaningful inferences grounded in complex data. The developments in modeling with Item Response Theory were related with developments in estimation theory, most remarkably Bayesian estimation with Markov chain Monte Carlo algorithms (Patz & Junker, 1999). The popularity of Item Response Theory has also implied numerous overviews in books and journals, and many connections between IRT and other statistical estimation procedures, such as factor analysis and structural equation modeling, have been made repeatedly (Van der Lindem & Hambleton, 1997).As stated before the Item Response Theory covers a variety of measurement models, ranging from basic one-dimensional models for dichotomously and polytomously scored items and their multidimensional analogues to models that incorporate information about cognitive sub-processes which influence the overall item response process. The aim of this work is to introduce the main concepts associated with one-dimensional models of Item Response Theory, to specify the logistic models with one, two and three parameters, to discuss some properties of these models and to present the main estimation procedures.
INTRODUCTION
The educational evaluation has become one of the privileged educational policies. The Item Response Theory (IRT) is a powerful tool in quantitative educational assessment processes, used in producing evaluation tools, creating ability scales, building items (questions) data basis and also in the definition of the characteristics of the items. Besides attending the development of test items, this theory concerns with accurate test scoring.
The item response models are used in order to analyze data from responses to items that are tools for abilities assessment, questionnaires and others. This class of models has been of increasing importance because of showing to be capable of producing results not possible to attain under the classical theory of analysis.
Classical theory has a number of restrictions, namely, its dependency on the set of items comprising the measuring instrument evaluation. In other words, the analyses and interpretations are always associated with the instrument as a whole. So in these methods, it is not feasible the comparison between individuals who have not been submitted to the same tests. One of the main advantages of the IRT over the classical theory is that the items are the critical elements of analysis, therefore allowing comparisons between populations, as long as they have been subjected to assessment instruments which have some common items, or even, allowing a comparison between individuals of the same population who have been subjected to completely different tests.
The Item Response Theory establishes models - Item Response Models (IRM) - for the latent factors / abilities that are characteristics of the individual which cannot be observed directly. IRM express the relationship between the probability of an individual answer correctly to a certain item and the item characteristics, taking into account the individual latent factors. The first Item Response Models have emerged in the 50s where only one ability of a single population was considered, measured by a test where the items were corrected in a dichotomous way. These models were first developed using the normal distribution and then described using the logistic distribution. Lord (1952) was the first to develop the one-dimensional with two parameters model (difficulty and discrimination of the item) based on the normal distribution function. Subsequently, Lord introduced a third parameter to solve the problem of random reply, emerging the three parameters model. Later on, Birnbaum (1968) replaced the normal distribution for the logistic distribution, because this function is an explicit function of the item parameters and the latent factor, and does not involve integration. Regardless of Lord’s work, Rash (1960) proposed the one-dimensional model with only one single parameter, using the normal model and later Wright (1968) used the logistic model.
Samegima (1969) proposed the graded response model comprising more categories in the individual reply to the items beyond the right or wrong options. Bock (1972), Andrich (1978), Masters (1982) and Muraki (1992) also suggested models for more than two categories of replies, assuming different structures between these categories.
Bock & Zimonwski (1997) introduced the logistic models of one, two or three parameters for two or more populations. These models have brought new possibilities for comparisons between two or more population´s abilities subjected to different tests with common items. Hays et al.(2000) emphasize that this century is expected to be a very productive one attending IRT and health outcomes measurements. These authors present a number of potential advantages of IRT over the classical test theory in assessing self-reported health outcomes and they explore the respective methodological and practical issues. From the point of view of applications, the IRM increasingly became popular in many areas and seriously evident on those connected to Health Sciences, Medical and Clinical research. Some detailed examples can be found in a vast literature, such as Edelen and Reeve (2007), Reise and Waller (2009) and more recently on the book by Reise and Revicki (2015), where applications to typical performance assessment of IRT Modeling are presented and explored.
MODELS
The Item Response Theory is a set of mathematical models that aim to express the probability, of an individual to give a specific reply to an item, as a function of the item parameters and the respondent abilities. This relationship is always expressed in a way that the greater the ability, the higher is the probability of a correct answer to the item.
The several models proposed in the literature depend fundamentally on three factors: The nature of the item: dichotomic or polytomic.
The population size involved.
The number of latent factors: one-dimensional or multidimensional.
In this work we will approach the one-dimensional models considering dicothomic items.
ONE-DIMENSIONAL MODELS WITH DICTHOMIC ITEMS- Assumptions
It is assumed that there is only one dominant latent factor, the ability which is being measured
.
The respondent performance on a test item is a function of the latent factor.
The relationship between the respondent performance on a specific item and the latent factor could be des-cribed by a monotonous increasing function called the item characteristic curve (ICC), considering that, as the latent factor increases, the probability of a correct answer to the item also increases.
It is assumed that, for a given latent factor, the replies to the items are independent.
These models differ on the type of function used to define the ICC and also on the number of parameters specified in the model. Usually one or more parameters are considered to describe the item and only one parameter is used to describe the examinee. Note that the functions provide information about the items parameters through the ICCs. To characterize the item parameters the Logistic and the Normal distributions are the most used. This work focus on the Logistic distribution and Logistic Models comprising one, two and three parameters, where:
only the difficulty of the item is considered;
the difficulty and the discrimination of the item are considered;
besides the difficulty and the discrimination, also it is considered the probability of a student with a low latent factor answers correctly the item (probability of random reply).
One Parameter Logistic Model (LM1)
Rash in 1960 proposed the following model:
j i
i j b D b D j ij e e U P
1 1(1) Where i=1,…I is the number of items of evaluation test and j=1,…,Jis the number of individuals.
Uij is a dummy variable defined as
otherwise 0; answer correct a for 1; ij Uj is the latent factor of the individual j and bi represents the difficulty parameter of the item i. Please note that
this parameter is measured in the same scale as the ability. D is a scaling factor equal to 1.We use a the value of1,7 for D when is intended that the logistic function provides similar results to normal function. P[Uij=1|j] is the probability of the individual j with ability j answer correctly to item i. This is called the Item Response Function
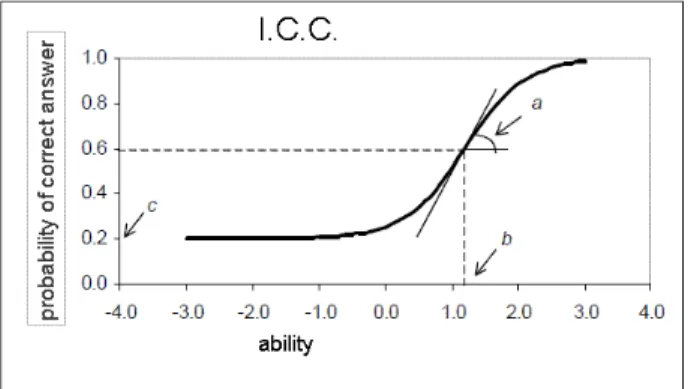
(IRF). Note that IRF can be seen as the proportion of correct answers to item i of all the individuals with ability qj. The relationship between this function and the model parameters can be viewed through the ICC in the Figure 1.
FIGURE 1. Source: U. S. Department of Education, Institute of Education Sciences, National Center for Education Statistics,
National Assessment of Educational Progress (NAEP) 2000 and 2001
Cite all the b-parameter is a localization parameter which indicates the place on the scale of the latent factor where individual are equally likely to get the item right or wrong (probability of a correct answer is 0,5). For this item (Fig. 1) b=1,0. To a large value of b corresponds a high level of the latent factor required for the individual to have a probability of 0,5 to give a correct answer to the item. Thus, difficult items correspond to high values of b and are located on the right hand side of the scale of the latent factor and easy items correspond to lower values and are located on the left hand side. Generally, difficult items correspond to values of b higher than 0,75; values between -0,75 and 0,75 correspond to medium difficulty items and values less than -0,75 are considered easy items.
Two Parameter Logistic Model (LM2)
The two-parameter logistic model (LM2) depends on difficulty and discrimination parameters. This model is
defined by the following equation:
j i
i i j i b Da b Da j ij e e U P
1 1(2) Where ai is the discrimination parameter of item i. This parameter has a proportional value to the curve slope at
point bi. Thus, items with this parameter negative in this model do not make sense, since that would indicate that the
probability of responding correctly to item decreased with increasing ability. Low values for the this parameter indicate that the item has little power of discrimination (individuals with very different abilities have, approximately, the same probability of responding correctly to the item) and very high values indicate items with very “steep” ICC, which discriminate individuals into two groups: those who have abilities below the value of the b-parameter and those who have abilities above this value. The other parameters assume the same meaning as is the previous model.
Three Parameter Logistic Model (LM3)
The three parameter one-dimensional logistic model is the most widely used and is defined by the following
equation:
i j i b Da i j ij e U Pc
1 1 1 1-
c
i(3)
Here the new parameter, ci, represents the probability that individuals with low ability to answer correctly to item i.
The model is based on the fact that individuals with higher abilities are more likely to give a correct answer to the item and that this relationship is not linear. We can observe this assumption by looking at Figure 2, verifying that the ICC has the shape of "S" with slope and displacement in the abilities scale defined by the item parameters.
FIGURE 2. Source: Teoria de Resposta ao Item: Conceitos e Aplicações. Andrade, Tavares & Valle – SINAPE 2000, pg. 11
A measure often used together with the ICC is the Item Information Function (IIF). This measure allows us to analyze how much information an item contains for measuring the abilities, and is given by:
/
2 i i Q P p d d Ii i
(4)I θ is the information given by the item i at the abilities level θ; P θ P X 1|θ andQ θ 1 P θ . This equation shows the importance that the three parameters have on the amount of information contained in the item. The information is greater when b is closer to θ; when a is higher and the parameter c approaches zero.
Another important function is the test information function which is the sum of the information provided by each item which constitutes the test:
I i
Ii
I (5)
In these models it is crucial to define the scale of abilities. In IRT, ability can theoretically assume any real value between ∞and ∞. It is necessary to establish an origin and a unit of measure for defining this scale. These values are chosen to represent respectively the mean value and standard deviation of the individual’s abilities.
FUTURE WORK
Two key steps in Item Response Theory are the parameter estimation and the equalization. The Item Response Models have an estimation problem involving two types of parameters, the item parameters and the abilities of individuals. Generally, the estimation is made using the maximum likelihood method through some iterative process.
Equalizing means equivalent, become comparable, in the case of Item Response Theory means setting the parameters from items of different tests, or individual abilities from different groups, in the same metric. There are two distinct types of equalization: equalization through population groups and equalization through common items. Both of these issues will be the subject of study in future work. We also intent to make a practical application of this theory using as sample a data base with assessment information on students enrolled in several disciplines of Mathematical graduation courses. For computational issues we will follow the information available at https://cran.r-project.org/web/views/Psychometrics.html and try to improve features attending to some expected new challenges.
ACKNOWLEDGMENTS
Research partially supported by National Funds through FCT – Fundação para a Ciência e Tecnologia, projects UID/MAT/00006/2013 (CEAUL) and UID/MAT/00297/2013 (CMA/NOVA.ID.FCT).
REFERENCES
1. Andrade, D.F., Tavares, H.R., & Valle, R.C. Teoria da resposta ao Item: Conceitos e Aplicações. SINAPE. Associação Brasileira de Estatística, 2000.
2. Andrich, D. A rating formulation for ordered response categories. Psychometrika,43, pp. 561-573,1978. 3. Baker, F.B. The Basics of Item Response Theory (2nd edition). ERIC Clearinghouse on Assessment and
Evaluation, USA, 2001.
4. Birnbaum, A. Some Latent Trait Models and Their Use in Inferring an Examinee’s Ability. In F.M. Lord & M.R. Novick. Statistical Theories of Mental Test Scores. Reading, MA: Addison-Wesley, 1968.
5. Bock, R. D. Estimating item parameters and latent ability when responses are scored in two or more nominal categories. Psychometrika, 37, pp. 29-51, 1972.
6. Bock, R. D.&Zimowski, M. F. Multiple group IRT. In Van der Linden, W.J. & Hambleton, R.K. (Eds.)Handbook of Modern Item Response Theory. New-York: Springer-Verlag, pp. 433-488,1997. 7. Edelen, M.O. & Reeve, B.B. Applying item response theory (IRT) modeling to questionnaire development,
evaluation, and refinementQual Life Res 16: 5, 2007.
8. Hambleton, R.K., Swaminathan, H., & Rogers, H.J. Fundamentals of Item Response Theory. Sage Publications Inc, 1991.
9. Hays, R.D., Morales, L.S., Reise, S.P.. Response Theory and Health Outcomes Measurement in the 21st Century.Med Care. Sep; 38(9 Suppl): II28–II42, 2000.
10. Lord, F. M. A theory of test scores (No. 7). Psychometric Monograph, 1952.
11. Masters, G. N. A Rasch model for partial credit scoring. Psychometrika, 47, pp. 149-174, 1982.
12. Muraki, E. A generalized partial credit model: Application of EM algorithm. Applied Psychological Measurement, 16, pp. 159-176, 1992.
13. Patz, R.J. &Jumker, B.W. A straightforward approach to Markov chain Monte Carlo methods for item response models. Journal of Educational and Behavioral Statistics, 24, pp. 146-178, 1999.
14. Rasch, G. Probabilistic Models for Some Intelligence and Attainment Tests. Copenhagen: Danish Institute for Educational Research, 1960.
15. Reise, SP and Revicki, D.A. Handbook of Item Response Theory Modeling. Applications to Typical Performance Assessment. Taylor & Francis, 2015.
16. Reise SP and Waller NG. Item response theory and clinical measurement. Annu Rev Clin Psychol. 5:27-48,2009 .
17. Rupp, A.A. Item Response Modelling with BILOG_MG and MULTILOG for Windows. International Journal of Testing, 3(4), pp. 365-384,2003.
18. Samejima, F. A. Estimation of latent ability using a response pattern of graded scores. Psychometric Monograph, 17, 1969.
19. Van der Linden, W.J. & Hambleton, R.K. Handbook of Modern Item Response Theory. New-York: Springer-Verlag, 1997.
20. Wright, B. D. Sample-free test calibration and person measurement. Proceedings of the 1967 Invitational Conference on Testing Problems. Princeton, N. J.: Educational Testing Service, 1968.
21. Zimowski, M. F., Muraki, E., Mislevy, R. J. & Bock, R.D. BILOG-MG: Multiple-Group IRT Analysis and Test Maintenance for BinaryItems. Chicago: Scientific Software, Inc., 1996.