Malvina Thaís Pacheco RodriguesI Thereza Maria Magalhães MoreiraII
Alexandre Meira de VasconcelosIII Dalton Francisco de AndradeIII Daniele Braz da SilvaII Pedro Alberto BarbettaIII
I Colégio Técnico de Teresina. Universidade Federal do Piauí. Teresina, PI, Brasil II Programa de Pós-Graduação em Saúde
Coletiva. Universidade Estadual do Ceará. Fortaleza, CE, Brasil
III Programa de Pós-Graduação em Engenharia de Produção. Universidade Federal de Santa Catarina. Florianópolis, SC, Brasil
Correspondence:
Malvina Thaís Pacheco Rodrigues Colégio Técnico de Teresina Universidade Federal do Piauí
Campus Universitário Ministro Petrônio Portela Bairro: Ininga
64049-550 Teresina, PI, Brasil E-mail: [email protected] Received: 6/22//2012 Approved: 12/9//2012
Article available from: www.scielo.br/rsp
Instrument to measure
adherence in hypertensive
patients: contribution of Item
Response Theory
ABSTRACT
OBJECTIVE:To analyze, by means of Item Response Theory, an instrument to measure adherence to t treatment for hypertension.
METHODS: Analytical study with 406 hypertensive patients with associated complications seen in primary care in Fortaleza, CE, Northeastern Brazil, 2011 using “Item Response Theory”. The stages were: dimensionality test, calibrating the items, processing data and creating a scale, analyzed using the gradual response model. A study of the dimensionality of the instrument was conducted by analyzing the polychoric correlation matrix and factor analysis of complete information. Multilog software was used to calibrate items and estimate the scores.
RESULTS: Items relating to drug therapy are the most directly related to adherence while those relating to drug-free therapy need to be reworked because they have less psychometric information and low discrimination. The independence of items, the small number of levels in the scale and low explained variance in the adjustment of the models show the main weaknesses of the instrument analyzed. The “Item Response Theory” proved to be a relevant analysis technique because it evaluated respondents for adherence to treatment for hypertension, the level of diffi culty of the items and their ability to discriminate between individuals with different levels of adherence, which generates a greater amount of information.
CONCLUSIONS: The instrument analyzed is limited in measuring adherence to hypertension treatment, by analyzing the “Item Response Theory” of the item, and needs adjustment. The proper formulation of the items is important in order to accurately measure the desired latent trait.
Measuring adherence to high blood pressure (HBP) treat-ment is a complex task. Studies have been conducted to understand factors affecting this public health problem, as well as creating instruments which enable the degree of adherence to be measured in a reliable way.2,3,5,9,14
The most common method is to use interviews and questionnaires due to their accessibility and low cost.12
A recent and suitable methodology for evaluating instruments which measure adherence to high blood pressure treatment is provided in the form of Item Response Theory (IRT). This theory includes a set of models for latent variables which propose to represent the relationship between the probability of a respondent giving a particular response to an item, their latent trait and the characteristics (parameters) of the item. Latent traits refer to characteristics of the individual which cannot be directly observed and are measured through secondary variables related to them (items of the instrument).1
Few studies have evaluated measuring instruments in the sphere of public health using IRT6,7,17 and none of
them involve applying IRT to adherence to HBP treat-ment, leaving the fi eld open to research. Thus, the aim of this study was to analyze an instrument for measuring adherence to HBP treatment using IRT.
METHODS
Analytical study which investigated the applicability of an instrument for measuring adherence to HBP treatment, developed by Moreira,a using IRT. This instrument has
been used in studies carried out in the Brazilian capital, using a Likert style scale and measuring the medical rather than pharmacological aspect of adherence. It contains ten items: salt intake, fat intake, not smoking, not drinking alcohol, doing physical activities, dealing with stress, appropriate use of medications, attending appointments and clinical data (Body Mass Index – BMI and blood pressure – BP). Each item has fi ve possible responses which range from 0.0 to 1.0 points. The total possible score for the questionnaire is 10 and the author standardized the values considering the score obtained for: ideal patient (9 to 10 points); slight lack of adherence (from 7 to < 9); moderate lack of adherence (from 5 to < 7); serious lack of adherence (from 3 to < 5; and very serious lack of adherence (from 1 to < 3).
The study universe was composed of the medical records of hypertensive patients registered in the HIPERDIA (Registering and Monitoring System for Hypertensive and Diabetic Patients), Fortaleza, CE, Northeastern Brazil, 2011, totaling 14,200 records.
INTRODUCTION
Of these, 1,315 had the associated complications and constituted the population studied. In order to calculate the sample, an estimated prevalence of adherence of 40%, according to the mean of prevalence in studies on adherence,4 a confi dence interval of 95%, error of
4% and an added 10% to cover losses and refusals were adopted, making a total of 440 hypertensive patients. There were 34 subjects excluded (deaths, not at home, cognitive defi ciency) and 406 people inserted in the fi nal study. These hypertensive patients came from the 15 family primary health care units (FPHC) with the highest number of cases, distributed throughout the entire municipal area. The stages of analyzing the instrument were the following: dimensionality test, calibrating the items, processing the data and cons-tructing the scale. The Samejima Graded Response model,15 created with the objective of obtaining other
information from the individual’s responses than just the simple correct or incorrect response to the items, was used to analyze the data. This model is represented by the following equation, in which Pi+
,k (ɵj) represents the probability of an individual responding to item i for a category equal to or greater than k.1
Pi+ ,k(ɵj) =
1 1+e -ai(ɵj-bi,k)
The parameter ai is equal in all of the categories of the scale of item i and the parameters bi,k represent the diffi culty of the kth category of item i.
Multilogb software was used to calibrate the items
and, later, to estimate the scores. Calibrating the items involved estimating the parameters ai and bi,k and veri-fying which of them was estimated satisfactorily to be used for calculating the scores of the latent traits and constructing the scale.
The anchor items were defi ned during the stage of constructing the scale. Andrade et al1 state that an item is an anchor for level A if it simultaneously fulfi lls the three conditions, for Y < Z:
a) P (U = 1 | ɵ = Z) > 0.65;
b) P (U = 1 | ɵ = Y) < 0.50;
c) P (U = 1 | ɵ = Z) - P (U = 1 | ɵ = Y) > 0.30.
As it is diffi cult to fulfi ll all of these conditions, items which met two of the three conditions, so-called quasi anchors, were considered.
A study of the dimensionality of the instrument was
conducted using the matrix of polychoric correlationc
and the principal components analyzed, using parallel
analysis which enables the dimensionality of the
instrument to be assessed.10 This study was carried
out using the complete instrument: ten items with all response categories, even considering the lower levels of adherence with few responses.
The dimensionality analysis was complemented by factorial analysis of all the data, based on Multidimensional Item Response Theory (MIRT) models.18 This analysis enabled the correlation of the
items with possible latent traits (or subjacent factors) to be assessed and verifi ed whether all of the items belonged to a single dimensional model or whether there were sub-conjuncts of items which justifi ed more dimensions. The parallel analysis with the polychoric correlation matrix was carried out using the psycho-metric “psych”d package and the factorial analysis of
the complete data using the “mirt” package,8 both free
software R.e Hayton et al10 stated that, even if little used,
parallel analysis is an accurate method of estimating the number of factors.
Linear transformation was carried out to provide changes of the scale in order to relate the IRT score (estimates of adherence to HBP treatment, according to the graded response model, with a mean of zero and standard deviation of one) with the total score, for which classifi cations of the individuals exist regarding the intensity of adherence to HPB treatment.
This study was approved by the Research Ethics
Committee of the Universidade Estadual do Ceará
Process nº 10725637-1, cover sheet (CS) 401985.
RESULTS
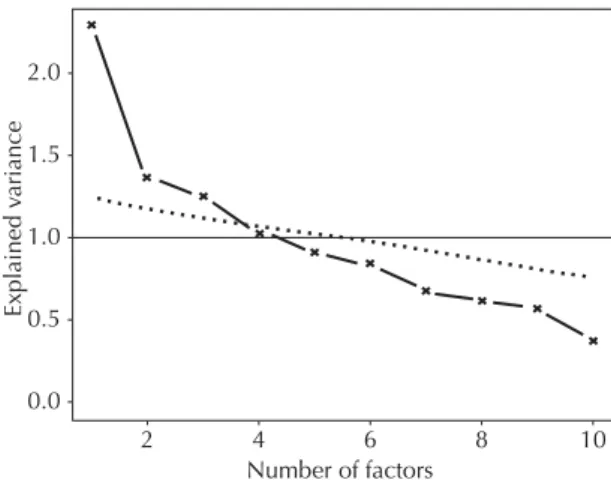
The results of the analysis of the principal compo-nents and the corresponding parallel analysis, both in terms of the polychoric correlation matrix, indicated a stronger dimension, but one which represented little more than 20% of the variance of the items, in addi-tion to two others, each with a participaaddi-tion of less than 15% of explained variance (Figure 1). The other main components had explicative power below the dotted line, i.e., they were not signifi cant and were, therefore, rejected.
The majority of coeffi cients in the polychoric correla-tion matrix had positive, albeit low, values, indicating low correlation between the items of the instrument and it was therefore not possible to summarize the responses by one or two subjacent factors.
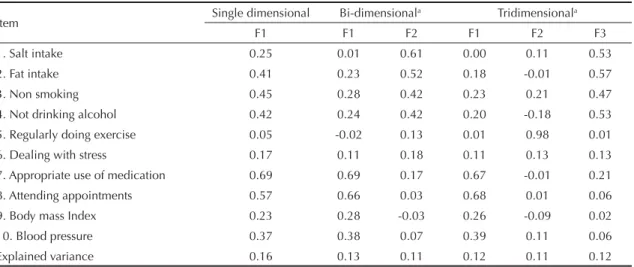
To understand the latent traits (or subjacent factors) linked to the patterns of the instrument’s responses, factorial analysis of the complete data based on MIRT models was carried out.18 Table 1 shows the factorial
loads of the single, bi and tridimensional models, as well as the estimates of variance explained by each factor.
The factorial loads may be interpreted as correla-tions between the items and the subjacent factors. These correlations were low in the instrument, espe-cially with item 5 (being sedentary). The fi t of the bi-dimensional model showed separation between items 1 to 4 (F2) with items 7 and 8 (F1). Dimension F1 was linked to adherence to treatment with medica-tion and dimension F2 to non-medicamedica-tion treatment. Analysis of the tridimensional model reinforced he interpretation of two sets of items (1 to 4 and 7 to 10), with being sedentary (item 5) as an exclusive factor. This item had a different dimension to the others and should be excluded by IRT in the construction of a single dimensional analysis.
In spite of the three models being adjusted, explained variance was low. It was decided to use the single dimensional IRT Graded Response Model to study the possible dominant dimension.
During the calibration of the items, the response cate-gories were grouped so that the parameters could be appropriately estimated. The items referring to salt intake; fat intake; not smoking; not drinking; doing physical activity and dealing with stress ended up with two response categories. The other items (appropriate use of medication, attending appointments and data on BMI and BP) had three response categories which
c Uebersax JS. Introduction to the Tetrachoric and Polychoric Correlation Coeffi cients. Statistical Methods for Rater Agreement web site. Paso Robles; 2006.
d Revelle W. Psych: procedures for psychological, psychometric, and personality research. Evanston: North western University; 2010 [cited 2012 May 24]. Available from: http://personality-project.org/r/psych.manual.pdf
e R Development Core Team. R: A language and environment for statistical computing. Version 2.13.2. Vienna: R Foundation for Statistical Computing; 2011.
Number of factors
2 4 6 8 10
1.5 2.0
0.0 0.5 1.0
Explained v
ariance
kept the same order in the fi nal result (Table 2). The item referring to regularly doing physical activity was excluded from the analysis.
The majority of items had two parameters, as their estimates did not converge on a scale of three points and it was necessary to dichotomize them. These factors contributed positively or negatively to adherence to HBP treatment, without graded responses.
The items with the highest parameters, or which best discriminated hypertensive patients who did and did not adhere to HPB treatment, were the references for the appropriate use of medication and attending appointments/period in which they are marked in the FPHC. The items referring to effectively dealing with stress and BMI were the most diffi cult to respond to satisfactorily. This lead to their high parameter b values, in which the most positive responses for adherence to treatment were given only by hypertensive patients
who had high adherence to their HBP treatment. The b
parameter indicates the position on the scale at which the item had the most data (Table 2).
The items referring to appropriate fat intake,
effecti-vely dealing with stress and BMI had b2 parameters
located above the mean on the scale (0.1) and therefore tended to be more representative of individuals with
greater adherence to treatment, although the, low, a
parameters meant the items could not be classifi ed as anchors. In spite of the items referring to appropriate use of medication, attending appointments and blood
pressure having reasonable parameter a estimates for
discriminating patients adhering to treatment from those who were not, it was observed that the b2 and b3 values were close to the mean zero, i.e., the patient did not necessarily have to adhering strictly to the treat-ment in order to respond to these items satisfactorily.
A parameters were low for the majority of the items.
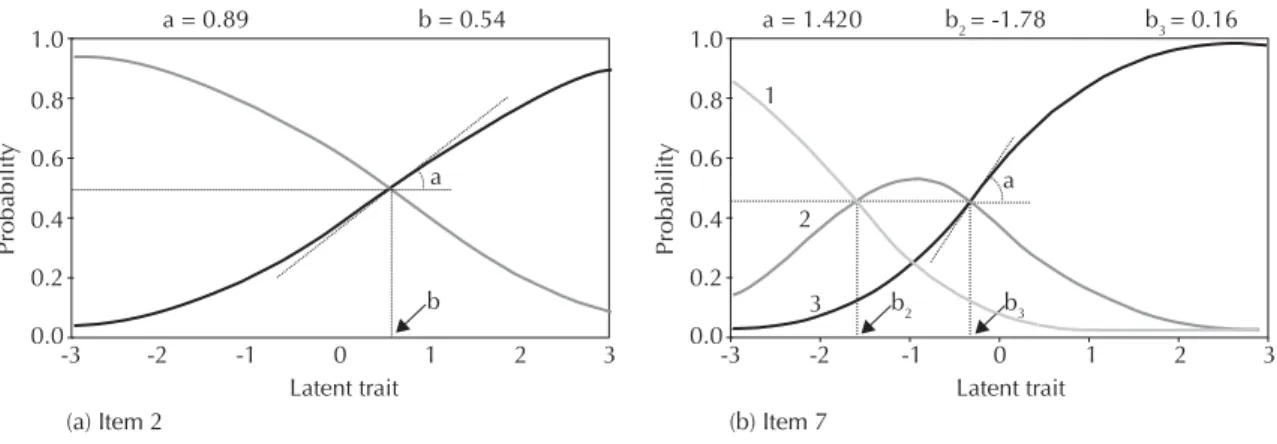
Figure 2 shows the curves characteristic of the items with two or three response categories (fat intake and medication use, respectively).
The fi rst curve (dichotomized item) shows the
loca-tion of parameter b between 0 and 1. This parameter
indicates that individuals with a score of 0.536 had a 50% probability of responding to this item satisfacto-rily, or that 50% of individuals with a 0.536 degree of
adherence had low fat intake. The a parameter at the
value of 0.894 determines the slope of the curve when probability is 50%. The curve (b) represented the item with three response categories with two parameters of diffi culty. The fi rst of these (b2 = -1.78) was at the intersection of curves 1 and 2, and the second parameter (b3 = -0.16) at the intersection of curves 2 and 3. The sum of the probabilities of the three curves for the same score was 1 (100%), according to the condition
Table 2. Estimate of the items’ parameters. Fortaleza, CE, Northeastern Brazil, 2011.
Item a b2 b3
1. Appropriate salt intake 0.43 -0.51 – 2. Appropriate fat intake 0.89 0.54 –
3. Non smoking 0.84 -2.89 –
4. Not drinking alcohol 0.79 -2.18 – 5. Regularly doing exercise – – – 6. Dealing with stress 0.62 3.70 – 7. Appropriate use of medication 1.42 -1.78 -0.16 8. Attending appointments/in the
period in which they are made in the Family Primary Health Care Unit
1.18 -1.79 -0.89
9. Body mass Index 0.39 2.85 –
10. Blood pressure 0.78 -3.24 0.27 Table 1. Factorial loads in single, bi and tridimensional models. Fortaleza, CE, Northeastern Brazil, 2011.
Item Single dimensional Bi-dimensional
a Tridimensionala
F1 F1 F2 F1 F2 F3
1. Salt intake 0.25 0.01 0.61 0.00 0.11 0.53
2. Fat intake 0.41 0.23 0.52 0.18 -0.01 0.57
3. Non smoking 0.45 0.28 0.42 0.23 0.21 0.47
4. Not drinking alcohol 0.42 0.24 0.42 0.20 -0.18 0.53
5. Regularly doing exercise 0.05 -0.02 0.13 0.01 0.98 0.01
6. Dealing with stress 0.17 0.11 0.18 0.11 0.13 0.13
7. Appropriate use of medication 0.69 0.69 0.17 0.67 -0.01 0.21
8. Attending appointments 0.57 0.66 0.03 0.68 0.01 0.06
9. Body mass Index 0.23 0.28 -0.03 0.26 -0.09 0.02
10. Blood pressure 0.37 0.38 0.07 0.39 0.11 0.06
Explained variance 0.16 0.13 0.11 0.12 0.11 0.12
established in the Samejima model,15 in which the a
parameter is equal for all of the curves.
The value of a must be > 0.1 for the item to be an anchor or quasi anchor; thus, only items 07 and 08 cold be consi-dered for constructing the scale. The items used were those referring to appropriate medication use (anchor for category 1) and attending appointments (anchor for category 1 and quasi anchor for category 2). The other items, although enshrined in the literature as related to HBP treatment adherence, were not included as they had low a parameters, i.e. they did not discriminate hyper-tensive patients adhering to treatment from those who were not, and were therefore not included in the scale.
Linear transformation was carried out on the estimates of the index of adherence to HBP treatment with a mean and standard deviation of 0.1 and 30.5, respectively, in order to better understand the results. The items were analyzed and placed on a scale with three levels (Table 3). Those being treated for HBP with a score < 25 were at the level of very serious non-adherence. At the next level, the patients had the same attitude with regards taking medication, but had improved appointment attendance. The patients were at the same level of adherence after level 35 of the scale, although with different scores.
The scale had few levels and little information in each of them, as it was based on only two items from the instrument.
DISCUSSION
Although questionnaires are very frequently used to assess adhesion to HBP treatment, this method has its limitations. Márquez Contreras et al11 warned that
questionnaires have low negative predictive value, confi rmed by the fact that 43% of users with uncon-trolled high blood pressure reported that they were correctly following their treatment. Another
impor-tant factor is reported by Santa Helena et al,16 and
refers to the conditions in which the questionnaire is carried out, dealing with undesirable behavior, which may intimidate the interviewees. In such cases, the method of completing the questionnaire may lead to adherence being overestimated, especially when it is completed by an interviewer, as patients tend to optimize their adherence in their responses, seeking the interviewers approval.
It is important that the items in the instrument be assessed, so that they provide the greatest amount of information possible. IRT provides additional data, as it enables the identifi cation of which dimension has more and less weight by evaluating latent traits. Moreover, it considers these dimensions in calculating latent traits for each respondent, in which the items are evaluated with different weightings. This differs from classical analysis in which all the items have
the same weight.1
Figure 2. Curves characteristic of the items fat intake and medication use.
Latent trait
(a) Item 2 (b) Item 7
Probability
Latent trait a = 0.89
1.0
0.8
0.6
0.4
0.2
0.0
Probability
1.0
0.8
0.6
0.4
0.2
0.0
-3 -2 -1 0 1 2 3 -3 -2 -1 0 1 2 3
b = 0.54
a
b b2 b3
a 2
3 1
a = 1.420 b2 = -1.78 b3 = 0.16
Table 3. Scale of adherence to high blood pressure treatment. Fortaleza, CE, Northeastern Brazil, 2011.
Level on the scale Description
25 Does not take medication, or does not place much importance on taking it. Only takes it when blood pressure rises or has diffi culties in taking the medication due to the side effects. Does not attend appointments or only attends when feeling poorly or blood pressure rises. Wants to alter behavior but has not managed to.
30 Does not take medication, or does not place much importance on taking it. Only takes it when blood pressure rises or has diffi culties in taking the medication due to the side effects. Rarely misses appointments.
The parameters of each item do not depend on the other items in the test. The score of the test, or subject’s latent trait, is found depending on their responses. In addition, it enables us to know which items can be considered easier and or more diffi cult to respond to satisfactorily, as one of the advantages of using IRT is that, in addition to providing a score for the latent trait, it positions the items on the same scale. This characteristic means that the exact signifi cance of the score can be understood and it is not just an indicator or the degree, or lack of it, of adherence, as shown in classical analysis. Although individuals may have the same total score, they are not considered to be in the same case as they do not have the same profi le of responses.
Another property of this model is that it enables a plan of objectives to be created for each user, according to their individual score. A patient in, for example, level 25 of the scale knows exactly that they have to be more assiduous in attending appointments in order to climb to level 30 of the scale, as at this level the hypertensive patient rarely misses appointments. This facilitates patients’ understan-ding and improves health care professionals’ degree of control and decision making. The health care team can use different strategies to present the results to the patient, as well as positively reinforcing their improvements on the scale for improving their adherence. The patient and the health care professional both perceive improvements in adherence to treatment with greater clarity.
The items referring to appropriate use of medication and attending appointments performed well, as they had the greatest power of discriminating between individuals who are adhering to their HBP treatment and those who are not. The items referring to treatment with medica-tion are more or less directly related to adherence in the majority of hypertensive patients.
Items related to non-medication treatment need to be reformulated, as they possess less psychometric infor-mation and poor discrimination. This reveals that the items are poorly formulated and need to be adjusted or belong to another dimension, as they are not successful in discriminating between individuals with greater and lesser latent traits.
The item referring to doing regular physical activity was excluded, as its presence meant that the algorithm estimation did not converge. This lack of convergence may be due to the following factors: the item being poorly drawn up, low number of respondents, the item not discriminating between individuals adhering to treatment from those who are not, the item being incompatible with this dimension of analysis or a combination of these factors.
An alternative for this result is the reformulation of the items so as to be more discriminatory. The item on smoking, for example, did not take into account whether
the individuals responded satisfactorily to the item were non-smokers before treatment or whether, to adhere to the treatment, they cut down or stopped smoking when they started HBP treatment.
The item referring to dealing with stress effectively was considered the most diffi cult to respond to satisfactorily, as it had the highest b value. This parameter discrimi-nates patients with better adherence to treatment from those with poor adherence, if their value is above 0.70. Experiencing stressful situations may be inevitable. For patients with HBP, this is an aggravation, as they are living with a disease which requires continuous treatment, and this is generally a source of stress as it calls for lifestyle changes.
The independence of the items (maintaining the latent trait constant, the individuals’ responses to any of the items are statistically independent), the small number of levels of the scale and the low explained variance in the fi t of the models show the main weaknesses of the instrument analyzed. It provides little information and therefore the items need to be altered or modifi ed so that it is possible to identify levels of adherence to treatment with greater clarity and propose interventions according to the scale.
A weakness of this study is the analysis of an instru-ment with low amounts of psychometric data, produ-cing a scale which included two items evaluating adherence to HBP treatment. It is possible that there are other gradations with more associated information, as the items of the instrument analyzed are not suffi -cient to create and explain other levels of adherence. Such a result denotes the need to reformulate the set of items in such a way as to enable a broader scale to be constructed.
Constructing instruments requires attention when designing the items, clarity of approach and focus on the latent trait to strengthen the discriminatory power, i.e., to produce items with high a parameters. Professionals and researchers who propose using questionnaires for evaluation are guided by enshrined theories in drawing up the items and in the analysis of their results,13 at the
risk of arriving at vague and unhelpful conclusions.
more accurate, it enables a contextualized view of the behavior of each response category in each item.
The instrument is limited as it measures adherence to HBP treatment using IRT analysis and needs some adjustments. The appropriate formulation of the items is important to measure the desired latent trait accurately.
It is suggested that an instrument to measure adherence to HBP treatment be constructed, with items suitable for IRT analysis, preferably of a single dimensional nature, with higher levels of validity and reliability and that they be used with patients with different levels of adhe-rence, with the aim of reducing errors in measurement.
1. Andrade DF, Tavares HR, Valle RC. Teoria da Resposta ao Item: conceitos e aplicações. São Paulo: Associação Brasileira de Estatística; 2000.
2. Araújo GBS, Garcia TR. Adesã o ao tratamento anti-hipertensivo: uma análise conceitual. Rev Eletr Enf. 2009;8(2):259-72.
3. Bloch KV, Melo NA, Nogueira AR. Prevalência da adesão ao tratamento anti-hipertensivo em hipertensos resistentes e validação de três métodos indiretos de avaliação da adesão. Cad Saude Publica. 2008;24(12):2979-84. DOI:
http://dx.doi.org/10.1590/S0102-311X2008001200030 4. Borges JWP, Moreira TMM, Rodrigues MTP,
Oliveira CJ. Utilização de questionários validados para mensurar a adesão ao tratamento da hipertensão arterial: uma revisão integrativa. Rev Esc Enferm USP. 2012;46(2):487-94. DOI: http://dx.doi.org/10.1590/S0080-62342012000200030 5. Castro M, Fuchs FD. Abordagens para aumentar a
adesão ao tratamento em pacientes com hipertensão arterial de difícil controle. Rev Bras Hipertens. 2008;15(1):25-7.
6. Castro SMJ, Trentini C, Riboldi J. Teoria da Resposta ao Item aplicada ao Inventário de Depressão Beck. Rev Bras Epidemiol. 2010;13(3):487-501. DOI: http://dx.doi.org/10.1590/S1415-790X2010000300012 7. Ceccato MGB, Acurcio FA, César CC, Bonolo PF,
Guimarães MDC. Compreensão da terapia anti-retroviral: uma aplicação de modelo de traço latente. Cad Saude Publica. 2008;24(7):1689-98. DOI: http://dx.doi.org/10.1590/S0102-311X2008000700023 8. Chalmers RP. Mirt: a multidimensional item response
theory package for the R environment. J Stat Software. 2012;48(6):1-29.
9. Gusmão JL, Ginani GF, Silva GV, Ortega KC, Mion Jr D. Adesão ao tratamento em hipertensão arterial sistólica isolada. Rev Bras Hipertens. 2009;16(1):38-43. 10. Hayton JC, Allen DG, Scarpello V. Factor retention
decisions in exploratory factor analysis: a tutorial on
parallel analysis. Organ Res Meth. 2004;7(2):191-205. DOI: http://dx.doi.org/10.1177/1094428104263675 11. Márquez Contreras E, Gil Guillén V, Casado
Martínez JJ, Martel Claros N, De La Figuera Von Wichmann M, Martín de Pablos JL, et al. Análisis de los estudios publicados sobre el incumplimiento terapéutico en el tratamiento de la hipertensión arterial en Espana entre los anos 1984 y 2005. Aten Primaria. 2006;38(6):325-32. DOI: http://dx.doi.org/10.1157/13093369 12. Martín Alfonso L, Bayarre Vea HD, Grau Ábalo
JA. Validación del cuestionario MBG (Martín-Bayarre-Grau) para evaluar la adherencia terapéutica en hipertensión arterial. Rev Cub Salud Publica. 2008;34(1). DOI:
http://dx.doi.org/10.1590/S0864-34662008000100012 13. Pasquali L. Psicometria: Teoria dos testes na Psicologia
e na Educação. São Paulo: Vozes; 2009.
14. Moraes CS, Tamaki EM. Adesão às medidas de controle da hipertensão arterial sistêmica: o comportamento do hipertenso. Cogitare Enferm. 2007;12(2):157-63. 15. Samejima FA. Estimation of latent ability using a response pattern of graded scores. Psychometrika. 1969;34:100-14.
16. Santa Helena ET, Nemes MIB, Eluf-Neto J. Desenvolvimento e validação de questionário multidimensional para medir não-adesão ao tratamento com medicamentos. Rev Saude Publica. 2008;42(4):764-7. DOI:
http://dx.doi.org/10.1590/S0034-89102008000400025 17. Silva GM, Gomes IB, Machado EL, Rocha FH,
Andrade EIG, Acurcio FA, et al. Uma avaliação da satisfação de pacientes em hemodiálise crônica com o tratamento em serviços de diálise no Brasil. Physis. 2011;21(2):581-600. DOI:
http://dx.doi.org/10.1590/S0103-73312011000200013 18. Wirth RJ, Edwards MC. Item factor analysis:
Current approaches and future directions. Psychol Methods. 2007;12(1):58-79.
DOI:http://dx.doi.org/10.1037/1082-989X.12.1.58 REFERENCES
Study based on the master dissertation of Daniele Braz da Silva, entitled: Hipertensão arterial e complicações associadas: análise do risco cardiovascular e da adesão ao tratamento em usuários do Sistema Único de Saúde presented to the Universidade Estadual de Fortaleza, Ceará, in 2011.