Dissertation submitted in partial fulfillment of requirements for the degree of MSc in Business Administration, at the Universidade Católica Portuguesa – September 2014
Rita Maria Martins Namorado Rosa
Student Number: 152112076
Dissertation Advisor: Prof. José Carlos Tudela Martins
1 | P a g e
Abstract
Title: Novabase – Equity Research
Author: Rita Maria Martins Namorado Rosa
The objective of this project is to obtain the Novabase’s price per share at 31st of December 2013. Our main challenge during this dissertation was to define the most suitable valuation model, taking in consideration the specificities of each model and the assumptions inherent in the decision of the model chosen. We decide to explore the Discounted Cash Flow valuation, through Free Cash Flow to the Firm approach and Relative valuation, due to the perspective of growth and characteristics of the industry in which Novabase operates.
Despite the fact that similar prices were achieved, we find more appropriate to select the Discounted Cash-Flow valuation, reaching a target price of 3,55€. Once, the price per share of Novabase, at 31st of December 2013 was 2,51€, we recognize an upside of 41% and consequently our recommendation is to Buy.
2 | P a g e
Acknowledgements
For the unconditional help, I would like to thank Prof. José Tudela Martins, for the contributions and technical support. I am thankful to Maria Gil Marin (Novabase Investor Relation) for the information provided and availability.
Finally I would like to thank you Sebastião, my family and friends, for the great support, helpful advices and unconditional understanding in every stage of this project.
3 | P a g e
Table of Contents
Abstract ... 1
Introduction ... 5
1. Literature Review ... 7
1.1 Discounted Cash-flow Valuation ... 9
1.1.1 Free Cash-Flow to the Firm Approach ... 11
1.1.2 Free Cash-Flow to the Equity Approach ... 16
1.1.3 Adjusted Present Value Approach ... 21
1.2 Option Pricing Model ... 25
1.2.1 Real Options Analysis ... 25
1.3 Economic Income Models ... 28
1.3.1 Economic Value Added (EVA) ... 28
1.3.2 Economic Profit (EP) ... 29
1.4 Relative Method ... 30
1.4.1 Price Multiples ... 31
1.4.2 Enterprise Multiples ... 34
1.5 Valuation Methods Conclusion ... 36
2. Company Presentation ... 39
2.1 Novabase presentation ... 39
2.1.1 Beginning and First steps ... 39
2.1.2 Operational Business Structure ... 42
2.1.3 International Expansion ... 45
2.1.4 Customers Activity Sector ... 47
2.1.5 Comparable Firms ... 49
2.1.6 Financial Performance ... 51
2.1.7 Stock Performance ... 55
3. Company Valuation ... 57
3.1 Free Cash-Flow to the Firm Valuation ... 57
3.1.1 Novabase Assumptions ... 58
3.1.2 Cost of Capital Assumptions ... 78
4 | P a g e
3.1.4 Novabase Equity Value ... 84
3.1.5 Novabase Target Price ... 85
3.1.6 Sensitivity Analysis ... 86
3.2 Relative Valuation ... 88
3.3 Investment Bank Research Note Comparison ... 91
Conclusion ... 93 Appendix ... 94 1. Appendix 1 ... 94 2. Appendix 2 ... 95 3. Appendix 3 ... 96 Bibliography ... 97
5 | P a g e
Introduction
Valuation of a company has been acquiring an extreme importance in our society not only in investment decisions by investors and shareholders, but also in every decision we make in the financial world. It plays a crucial role in the decision process in portfolio management, merger and acquisition analysis and in corporate finance strategic decisions.
Our main goal is to achieve the value of Novabase’s price per share, at 31st of December 2013. Consequently, the value of the stock price achieved will be compared to the Caixa BI Equity Daily, from 7th of February 2014.
Why Novabase? The company operates in a sector where I have a personal interest: IT. On the other hand Novabase has been conquering a relevant international exposure increasing the challenge the company has in the future.
After the decision in terms of the company I had to decide how to compare the result achieved with similar analysis done by specialized companies. Reputation, credibility and availability of the information were the main criteria to consider Caixa BI valuation.
The project was structured through the 3 following sections:
Section 1: Literature Review
Description of the possible valuation models, and its advantages and disadvantages;
Focus on understanding the suitability of each model, in order to justify our choice to value Novabase stock price, according to its industry sector and main characteristics.
Section 2: Company Presentation
Novabase’s description in terms of history and business model;
Business segments, operational sectors, financial performance and stock performance;
The objective of this section is to make it easier to understand the subsequent assumptions that will be presented in Section 3.
6 | P a g e Section 3: Company Valuation
Design of the different assumptions, based on the valuation models already chosen and the target prices achieved;
Sensitivity analysis for the different assumptions considered;
7 | P a g e
1. Literature Review
“What is the ‘fair’ price to pay for an asset that has a set of uncertain future cash-flows?” Valuation for Mergers and Acquisitions, 2013 by Pearson Educational Inc. Valuation has been acquiring a countless importance in our society not only in investment decisions for investors and shareholders, but in every decision we need to make in the financial world. It plays a crucial role in our business daily routine, once it allows us to perform a better result in terms of decisions related to portfolio management, merger and acquisition analysis and in corporate finance strategic decisions.
According to Damodaran, “knowing the value of an asset and what determines that value is the prerequisite for intelligent decision making”. Meaning that, more than knowing the value of a certain asset, we need to be able to understand its components as well as the characteristics and value of each component alone, in order to reach the most precise value of the asset.
On the other hand, it must be taken into consideration that valuation depends on several assumptions that apparently reflect the future expectations but can be immediately outdated due to the volatility of stock markets. The assumptions considered to calculate the value of an asset are just a sort of beliefs, in a cert period of time, that depend from investor to investor.
Keeping this in mind, the value of the company combines two important drivers: firstly the value of the company in the present and secondly the assumptions to achieve the value of the future cash-flows.
There are several valuation models. Their suitability depends on the industry, characteristics, life-cycle period of each company as well as the analysts’ preferences and expertise. In line with Damodaran (1994), the value of a firm can be obtained through three different approaches:
Discounted Cash-flow Valuation
Relative Valuation
8 | P a g e
The Economic Income Model stated by Barbara Petitt and Kenneth Ferris in Valuation for Merger and Acquisitions (2013) will also be considered. The authors describe that valuation models can be divided according to two key categories: 1) Whether the valuation method is absolute or relative; 2) Whether valuation methods rely on cash-flows or on other variables.
Through the table below1, it can be easily exhibited this subdivision of valuation methods, achieving the four presented subgroups:
Absolute Valuation Models Relative Valuation Models
Valuation methods that rely on Cash-Flows
Discounted Cash flow Models Price Multiples
- Free Cash-Flow to the Firm Model - Price-to-cash-flow ratio - Free Cash-Flow to the Equity Model
- Adjusted Present Value Model
Option Pricing Model
- Real Option Analysis
Valuation Methods that rely in other variable than Cash-Flows
Economic Income Models Price Multiples
- Economic Value Analysis - Price-to-Earnings ratios (P/E ratio; P/EBIT ratio; P/EBITDA ratio) - Price-to-Sales ratio - Price-to-Book ratio Enterprise Multiples - EV/EBITDA multiple - EV/Sales multiple
1 Valuation for Mergers and Acquisitions (2013) by Pearson Educational Inc.
9 | P a g e
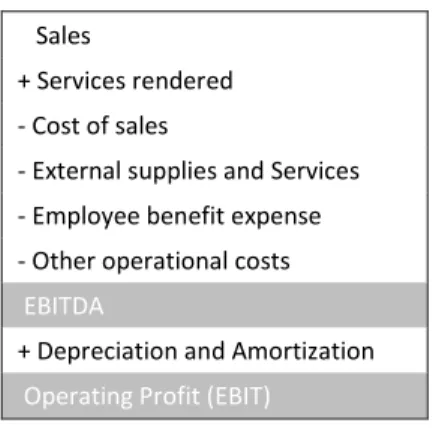
1.1 Discounted Cash-flow Valuation
The Discounted Cash-Flow Valuation provide us the value of a company today, being “equal to the present value of the future (but uncertain) cash-flows to generated by the company’s operations, discounted at a rate that reflects the riskiness (or uncertainty) of those cash-flows”.2
According to Pablo Fernandez (2013), “Cash-flow discounting models are based on the detail, careful forecasts for each period, of each of financial items related with the generation of cash-flows corresponding to the company’s operations”.3
In accordance with Damodaran, the formula to achieve the present value is:
∑
Where [r] represents the discount rate, [n] is expected number of years of the life of the asset and [Expected CF t] is the Cash-flow which the firm is expected to generate in the period t.
This method involves an extreme level of uncertainty due to the assumptions that might be considered while computing expected cash-flows and discount rate.
When using this approach, we are able to achieve the value of a firm through two different methods: Free Cash-Flow to the Firm and Free Cash-flow to the Equity.
In the first method, the value of the entire firm is achieved by discounting the cash-flows of the firm as whole to the Weighted Average Cost of Capital (WACC). Applying the second method, the Equity value can be reached by discounting the cash flows related to Equity only at the required rate of return for investors to consider an investment in the firm, which is the cost of Equity (KE).
2
Valuation for Mergers and Acquisitions (2013) by Pearson Educational Inc.
10 | P a g e
Before choosing one of the two methods, several aspects should be clearly clarified: 4
Understand the consistency of real and nominal interest rates and cash-flows;
Predict the consistency of the use of assumptions while computing future earnings and cash flows;
The different conditions and characteristics of each firm allied to the inherent risk of the undertaken assumptions.
Discounted Cash-flow Valuation should be used to value the firms that present positive cash-flows and that are expected to maintain positive cash flows in the future. Companies that present negative cash flows, cyclical companies and firms characterized by having unutilized assets, represent a threat to the accuracy of the value obtained through this model. The firm value achieved over one of these conditions might be misleading due to the high probability of bankruptcy costs and overvaluation of assets.
Upon this statement, discount cash-flow approach is suitable when considering companies with growth perspectives as well as companies with several units of operation and/or different currencies within the same service line.
Advantages and Drawbacks of Discounting Valuation Model
This valuation model provides the intrinsic value of the company. Compared to the existing valuation methods, this one returns the closest approximation to the real value of the firm.
Despite of being “less exposed to market moods and perceptions”5 once it is based on assets fundamentals, it requires higher complexity due to the prerequisite of higher number of inputs and assumptions. Moreover, it can be easily manipulated inducing in over or under-estimation of the stock price.
4
Damodaran Presentation: http://people.stern.nyu.edu/adamodar/pdfiles/basics.pdf
11 | P a g e
1.1.1 Free Cash-Flow to the Firm Approach
As previously mentioned, the Free Cash-Flow to the Firm provides us the value of the entire firm through the estimation of future cash-flows and discounting them to the Weighted Average Cost of Capital (WACC).
∑
Where [CF to Firm t ] is the expected cash-flow in period t and [WACC] is the Weighted Average Cost of Capital - required rate of return to the firm.
To ensure the understandability of this model, these two components will be carefully detailed:
1.1.1.1 Expected Cash-Flows to the Firm:
The amount of free cash flow is the operating cash flow of the firm. It is the “cash generated by operations without taking into account the borrowings (financial debt), after tax. It is the cash for the shareholders if the company has no debt.”6
In order to achieve the value of future cash flows, assumptions on growth rate of sales and associated costs should be done. The greater the knowledge of the firm and its sector, the more precise assumptions we will have.
In accordance with Damodaran (1994), there are two different ways to achieve the value of Free Cash-Flow to the Firm: “One way is to cumulate the cash-flows to the different claimholders (i.e.: Equity investors, debt holders and preferred stockholders) in the firm. The other approach (…) uses the earnings before interest and taxes”7.
Taking into account the complexity and uncertainty of the first approach, we will merely consider the second approach. Thus, the formula regarding the chosen approach is:
6
Pablo Fernandez (2013)
12 | P a g e
Where [EBIT] represents the Earnings Before Interest Taxes, [t] is the tax rate assumed, [D&A] is the amount of Depreciation and Amortizations of the assets, [CAPEX] traduces the amount of capital expenditure and [ WC] is the change in Working Capital of the firm.
Under this approach, the most important components used to compute the cash-flow value are: the amount of Depreciation and Amortization, the total of Capital Expenditures and Change in Working Capital.
I. Depreciation and Amortization (D&A):
The first component “provides a benefit by reducing the taxable income of the firm and creates savings in taxes that is a function of the tax rate of the firm”8, so there will be an incentive for the stakeholders to increase the value of this driver.
II. Capital Expenditures (CAPEX):
The value of Capital Expenditures should always be consistent with the growth rate of the company. This component represents the investment that the company does either in fixed assets or to improve the existing assets. According to Damodaran (1994), several analysts consider that “depreciation is equal to capital spending for firms in a stable-growth phase”9.
III. Change in Working Capital ( WC):
The Change in Working Capital value results from the difference between current assets and current liabilities. Additionally, the change in working capital is computed through the difference between of the value of WCN of one year with the previous one. Thus, an increase in the level of WCN will negatively influence the level of cash-flows due to the cash outflow and the other way around.
Having these parameters computed, the value of cash-flows of the firm will be easily calculated.
8
Damodaran (1994)
13 | P a g e
An additional way to compute the FFCF, is to “add up the cash-flows to the claim holders, which would include cash-flow to equity (defined either as Free Cash-Flows to Equity - FCFE or dividends), cash-flows to lenders (which would include principals payments, interest expenses and new debt issues) and the cash-flows to preferred stockholders (usually preferred dividends).”10 This alternative approach requires higher complexity, however, is it useful when the value of the FCFE is primarily achieved.
The value of FCFF would be reached through the following procedure:
How to compute the terminal value - in order to guarantee the perpetuity of the value of the cash-flows?
Once the values of cash-flows cannot be estimated for each year and forever, the terminal value needs to be added, to reflect the value of the cash-flows computed in perpetuity. “It assumes that the cash flows of the firm will grow at a constant rate forever in a stable growth rate. With stable growth, the terminal value can be estimated using a perpetual growth model”.11
Under this statement, the value of the firm will be computed as followed:
∑
Where Terminal Value is:
In which, [FCFF t+1] is the Free Cash Flow to the Firm next year, [WACC] will be subsequently explained and [g] is the growth rate in perpetuity.
10
Damodaran: http://pages.stern.nyu.edu/~adamodar/pdfiles/valn2ed/ch15.pdf
14 | P a g e
Throughout this model, there is no need to distinguish between unleveraged and leveraged firm (as it happens in the Free Cash Flow to the Equity model), since the Free Cash Flow to the Firm is computed before debt payments. However, a change in the level of the debt will have an impact on the debt-to-equity ratio and consequently on the value of the discount rate of this model - WACC.
1.1.1.2 Weighted Average Cost of Capital (WACC):
The Weighted Average Cost of Capital is the cost of capital and instinctively the required rate of return of the firm. It comprises “the cost of different components of financing including debt, equity and hybrid securities used by the firm to fund its financial requirements”12.
It can be achieved through the following formula:
Where [ ] is the cost of Equity, [t] is the tax rate assumed, [ ] represents the cost of debt and [MV] is the abbreviation of Market Value for Equity and Debt (depending which of them will be considered). Finally, Enterprise Value represents the sum of MV of Debt and MV of Equity.
The cost of debt assumed to compute the cost of capital is the “current cost to the firm of borrowing funds to finance projects"13. It is an extremely important driver, once it is influenced by interest rates volatility, default risk of the company and tax benefits associated with debt.
Additionally, another important component is the Market Value of Debt. It is “usually more difficult to obtain directly, since very few firms have all their debt in the form of bonds outstanding trading in the market; many firms have non-traded debt”14.
12 Damodaran (1994) 13
Damodaran (1994)
15 | P a g e
Finally, the notion of WACC implies intrinsic risk. Consequently, the lower the level of WACC, the higher the investment opportunities the company will be able to achieve.
This valuation method is “more straightforward to use when there is significant leverage or when leverage changes over time,” once the cash flow to the firm valuation is a cash prior to the debt payments. However, the cost of capital used to discount the free cash flow to the firm will need to be adjusted for changes in leverage.
16 | P a g e
1.1.2 Free Cash-Flow to the Equity Approach
The Free Cash-Flow to the Equity approach allows us to value the Equity value of a firm, by discounting the expected cash-flows to the cost of equity (Ke).
The following formula should be considered to achieve the equity value:
∑
Where [CF to Equityt] represents the expected cash flow that the company predicts to generate in the period t and [ ] is the required rate of return or cost of equity.
In order to pursue our study, it is important to clarify the meaning of these two components:
1.1.2.1 Expected Cash-Flows to the Equity:
The expected cash flows to the Equity is “the remaining cash-flows after operating expenses, interest and principal payments and any capital expenditure needed to maintain the growth rate in projected cash-flows”15.
In accordance to Damodaran (1994), we should have different valuations when considering the cash-flows’ estimation for unleveraged and leverage firms.
I. Unleveraged Firm:
The unleveraged firms are characterized by the inexistence of debt, meaning that the only source of financing of the company is the Equity.
Under this scenario, the formula to achieve the future cash-flows is:
17 | P a g e
Where [EBIT] is the Earnings Before Interest Taxes, [D&A] is the amount of Depreciation and Amortization, [CAPEX] is the Capital Expenditures and [ WC] is the change in Working Capital (compared to the homologous period).
II. Leveraged Firm:
In the case of leveraged firms, the company presents a positive Debt Ratio, involving the payment of interests and principal repayments.
A leveraged firm finances its capital expenditures and working capital needs with debt (principal payments and interest associated). Consequently, the firm reduces the percentage that is financed by Equity.
The desired capital structure for a firm is achieved through the mix financing of debt and financing, of the capital expenditures and working capital needs.
In order to compute the cash-flows, the subsequent formula might be considered:
Where, the deduction of Interest Expenses, preferred dividends and principal payments, and the addition of proceeds from new debt issue represent the difference between an unleveraged and leveraged firm.
18 | P a g e
1.1.2.2 Cost of Equity (Ke):
The cost of Equity is the required return by investors to invest in a firm in a firm.
There are several aspects that might be taken into consideration while computing the required rate of return to the investors of the firm, such as:
The cost of equity can assume different values when considering companies with different service lines;
The cost of equity will be different for companies that operate in different countries due to the related risk - interest rates and/or risk premium.
Moreover, there are two alternative approaches to estimate the cost of equity:
I. Risk-and-return Model
I.I The Capital Asset Pricing Model:
The Capital Asset Pricing Model (CAPM) combines the expected return with risk measures.
It can be achieved through the following formula:
Where [Rf] is the Risk-free Rate and [E(Rm)] is the expected market risk or expected return on the market index.
The risk free rate is the return of a certain asset considering that there is no risk associated with the investment. Whereas the market risk premium, represented by , is given by the difference between market risk premium and the risk free rate.
An additional component that should be considered is the Country Risk Premium. It represents the risk of the specific conditions for each country, including political, economic, geographical, etc. It will be directly influencing the investors’ decisions as well as the inherent cost of Equity.
19 | P a g e
Under this statement, the cost of Equity will be achieved through the following formula:
[ ]
There are several assumptions when using this model. It assumes perfect market conditions whereas the investors have similar expectations about expected returns; the financial assets are traded at a risk-free rate; the inexistence of transaction costs, among others.
Under these assumptions, the “nondiversifiable risk for any asset can be measured by the covariance of its returns with the return of market index, which is defined to be the asset’s beta”16 expressed in the formula above.
The beta of the company is achieved through the combination of three variables, namely: the type of business, the level of operating leverage and the financial leverage. The value of beta will be higher in cases where the company is more sensitive to market changes and conditions; additionally the value of the beta will be higher if the company has higher operating leverage and higher level of financial leverage, representing an increase in the level of fixed costs and in the level of debt, respectively.
Furthermore, to guarantee the accuracy of the value computed through CAPM Model, historical data should be used where market risk-premium is determined as the “difference between average returns on the stocks and the average returns on risk-free securities over the measurement period”17.
I.II. The Arbitrage Pricing Model:
This model relies on the same rationale as CAPM, where “investors get rewarded for taking on non-diversifiable risk (…) The APM relates the expected returns to economic factors, with a beta specific to each factor”18.
16 Damodaran (1994) 17
Damodaran (1994)
20 | P a g e
The presented model implies a deep knowledge of the factors that drive the company and the associated betas. Taking into account the complexity and the high number of the factors that influence the risk of the company, this model will not be applied throughout this Novabase Valuation.
II. Dividend-growth Model
The Dividend-growth model assumes a stable constant growth rate of the firm, meaning that the growth rate of the firm cannot vary significantly from nominal growth rate of the economy (or country).
If the company satisfies the above condition, the formula to be applied should be the following:
Where [P0] is the price of the stock today, [DPS1] is the expected dividends per share one year from now, and [g] is the growth rate of dividends (considering a steady state scenario).
The particularity of this model is the consideration of the value of the stock as an input. Consequently, since the stock price is the goal of this Novabase Equity Valuation, instead of an input, this model should not be considered, due to the intrinsic circularity.
21 | P a g e
1.1.3 Adjusted Present Value Approach
The Adjusted Present Value (APV) model is an additional way of valuing a firm, firstly studied by Modigliani and Miller and afterwards applied by Stewart Myers.
After many years of research, formulations and thoughts, Modigliani and Miller19 presented the APV model as the sum of the value of the unleveraged firm and the present value of the interest tax shields, whereas it would be represented as a function of the interest tax shields discounted by the risk-free rate. In accordance to their opinion, the following formula would be used to achieve the value of the leveraged firm:
Where ] is the abbreviation for the unleveraged value of the firm and [ ] is the present value of the interest tax shields, given by the following way of calculation:
Where [ ] is the risk-free rate, [ ] is the amount of money that the company owe.
On the other side, Myers believed that the interest expense should not be computed with the risk-free rate, due to the fact that the access to the cost of debt is different for each investor. Thus, the interest rates would be different and the author presented the Present value of interest tax shields as a function of cost of debt, instead of risk free rate, as it presented below:
Complementing our analysis of APV Model with most recent theories, Fernandez states that this model is applied to value the impact of tax shields, which determines “the increase in the company’s value as the result of the tax savings by the payment of interest.” 20
19
Modigliani and Miller (1963) 20
22 | P a g e
Nevertheless, from Damodaran point of view, the APV Model is given by “adding the marginal impact of debt on the value of the unleveraged firm value”21.
In order to better understand the decomposition of this method, the necessary steps to reach the value of the firm will be shown, as according to Damodaran: “we begin by estimating the value of the firm with no leverage. We then consider the present value of the interest tax savings generated by borrowing a given amount of money. Finally, we evaluate the effect of borrowing the amount on the probability that the firm go bankruptcy, and the expected cost of bankruptcy.”22
Thus, the value of the leverage firm will be achieved according to the following formulation:
Rephrasing the APV model, according to Damodaran, the main steps are:
I. The company should be valued as if it was all-equity financed, assuming a null debt ratio. In these terms, the objective is to reach the value of the unleveraged firm, considering the value of current after-tax operating cash flow to the firm and
discounting it to the unleveraged cost of equity (Ku). Under this statement, one of the following assumptions may be chosen:
a. The cash-flows of the firm will grow at a constant rate in perpetuity or;
b. Different growth rates are assumed for each year until it reaches stable growth scenario.
Following the first assumption we will have the following way of calculation:
21 Damodaran http://pages.stern.nyu.edu/~adamodar/pdfiles/valn2ed/ch15.pdf 22 Damodaran http://pages.stern.nyu.edu/~adamodar/pdfiles/valn2ed/ch15.pdf
23 | P a g e
In order to get the value of the unleveraged cost of equity or required rate to assets, the following formula should be used - if the current value of the beta of the firm is known:
Where the current equity beta of the firm, t is is the tax rate of the firm and ⁄ is the current debt to equity ratio.
Applying the CAPM approach, previously explained in Topic 1.1.2.2. – Cost of Equity, the value of the unleveraged cost of equity (Ku) will be computed, in order to reach the value of the unleveraged firm.
[ ]
One important aspect that should be bear in mind, is that, if in fact the company does not have debt and the only source of financing is equity, then the cost of equity will be equal to the unleveraged cost of equity, and consequently equal to the weighted average cost of capital ( = WACC)
II. The objective of the second step of APV Valuation is to estimate the present value of interest tax shields which are the expected tax benefits, considering a certain level of debt. In other words, through this step, the effect of debt level will be studied to value its impact on the value of the firm.
24 | P a g e
The present value of the interest tax shields would be obtained as a “function of the tax rate of the firm and is discounted at the cost of debt to reflect the riskiness of this cash-flow. If the tax savings are viewed in perpetuity.”23 Thus, the present value of interest tax shields can be reached through the following formula:
Where Kd is the cost of debt, D is the amount of debt of the firm and t is the firm marginal tax rate (that is assumed to maintain constant over time).
III. Finally, within the third step, the effect on the given debt level of the default risk is valued, as well as, the impact on the expected bankruptcy costs.
In order to achieve these values, Damodaran presents the following formula:
Advantages and Drawbacks of Adjusted Present Value Model
The presented model is useful and detailed, once it “separates the effects of debt into different components and allows the analyst to use different discount rates for each component”24. Therefore, it provides an extensive view, due to the fact that debt level will not be considered unchangeable over the years.
On the other hand, the value of the firm when using this model implies a high level of uncertainty regarding the estimation of the probability of default and bankruptcy costs. It represents an extreme threat for our valuation and, consequently, it will not be applied.
23
Fernandez (2013) http://www.iese.edu/research/pdfs/di-0715-e.pdf
25 | P a g e
1.2 Option Pricing Model
1.2.1 Real Options Analysis
The Option Pricing Theory derives from the valuation of derivative securities. The subsequent value will be reached through the appraisal of an underlying asset.
In order to better understand this model, we will start by explaining the meaning of its main components and drivers.
An option gives its holder “the right to buy or sell a specific quantity of an underlying asset at a fixed price (called the strike price or exercise price) at or before the expiration date of the option.“25 Due to the nature of the option, the holder will be able to choose between exercising the option or not to exercise depending on its expectation of the value of the asset, before the maturity date. According to Damodaran (1994), within the Option Pricing Model, we can find two types of options: (I) Call Options and (II) Put Options.
I. Call Options
A call option allows the buyer to have the right (not the obligation) to buy the underlying asset at a fixed price at any time prior to the maturity date.
In the case of buying a call option, the buyer will pay the call price, and in exchange, he will receive the right to exercise the option any time he wants. At the maturity date, if the asset value (S) is greater than strike price (K), the holder has an incentive to exercise the option. Thus, the Net Profit is equal to S – K – Call Price
Conversely, if the holder is in the position of seller, by selling a call option, he will “receive the call price and agrees to deliver the asset at the exercise price if the buyer demands it any time before expiration”26. Through this scenario, if the asset price is lower than strike price, the buyer will not have incentive to exercise the option. This way, the Net Profit will be equal to the Call price.
25
Damodaran (1994)
26 | P a g e
II. Put options
Having a Put Option, the holder has the right to sell the underlying asset at a strike price at any time prior to the maturity date.
If the holder assumes a position of buyer, as verified in call option case, the buyer receives the right to exercise the option in exchange of the option price. At the maturity date, if the strike price is higher than asset price, the investor will receive the net profit which equals the difference between the strike price and the asset price.
On the other hand, if the trader is selling a put option, he will receive the put price and assumes to buy the asset, in the case where the buyer exercises the option. However, there is no incentive to exercise the put if the asset value is higher than strike price.
Furthermore, there are two approaches to value the options: Binomial option-pricing and Black Scholes. The first method points the combination of the risk-free of borrow or lend and the value of the underlying asset to generate cash flows. It is “based upon a simple formulation for the asset price process in which the asset, in any time period, can move to one of the possible prices”27. On the other side, the Black Scholes Model is “one limiting case of the binomial, but it reduces the information requirements substantially.”28
Using the Option Pricing Model on valuation, the value of the Equity will be operated as a call option of the firm whereas “exercising the option requires that the firm be liquidated and the face value of the debt (which corresponds to the exercise price) paid off”.29
There are some limitations of the value of the firm achieved through this approach, such as: the inherent conflict between bondholders and stockholders, as well as, the overestimation of the equity value when considering troubled companies.
27 Damodaran (1994) 28
Damodaran (1994)
27 | P a g e
However, this model is suitable for firms with natural-resources investments, such as: mines, oil reserves, etc. and companies with products patents. This category of firms has “investment opportunities that are option-like features; these features are usually difficult, if not impossible, to capture using DCF valuation.”30 These companies’ valuation requires additional variables that consider the level of uncertainty of the projects or investments, while estimating the value of the firm. The level of uncertainty is given by the inherent risk remained in the natural, environmental, geographic and economic conditions.
28 | P a g e
1.3 Economic Income Models
Economic Income Models, Value creation Approaches or Residual Income Models, contrary to DCF Valuation, rely on the value of earnings to estimate the value of the company.
The main principle of the economic income models is that ”the company that produces positive economic income creates shareholder value. Consequently it should be rewarded with a higher share price”.31
Fernandez (2013)32 presents four possible ways of valuating the firm through Value creation approach: [1] Economic Value Added, [2] Economic Profit, [3] Cash Value Added [4] CRFROI.
Our goal is to present the first two methods, according to the suitability for Novabase Valuation.
1.3.1 Economic Value Added (EVA)
The Economic Value Added (EVA) approach returns the value of the enterprise, through the weighted average cost of capital.
Fernandez (2013)33 refers that EVA results from the amount of NOPLAT (Net operating profit after tax) subtracted by company book value and multiplied by the weighted average cost of capital.
Over this statement the EVA value would be achieved through the following formula:
Where [ ] is the Net operating profit after tax, [ ] is the book value of the company and WACC is the required rate of return.
31 Barbara Petitt and Kenneth Ferris in Valuation for Mergers and Acquisitions (2013) by Pearson Educational Inc. 32
Pablo Fernandez (2013)
29 | P a g e
Damodaran mentions that EVA is “a measure of surplus value created on an investment “34, having the following way to calculate its value:
Moreover, Damodaran still points as an advantage of this method the fact that “it avoids the problems associated with approaches that focus on percentage spreads - between ROE and Cost of Equity; ROC and Cost of Capital”35 and also the influence that the value of the firm will have in investment and dividend decisions.
1.3.2 Economic Profit (EP)
The Economic Profit Model (EP) returns the value of the equity using the required rate of return or cost of equity ( ).
Fernandez (2013)36 points that Economic Profit is “the book profit less the equity’s book value multiplied by the required return to equity” and additionally presenting its way of computation as follows:
Where [ ] is the accounting net income or profit after tax, [ ] is the equity’s book value and [Ke] is the required rate return to equity.
34 Damodaran Presentation: http://pages.stern.nyu.edu/~adamodar/New_Home_Page/lectures/eva.html 35
Damodaran (1994)
30 | P a g e
1.4 Relative Method
Relative Method is based on the use of multiples, whereas a multiple is a ratio of two financial variables. Through the Relative Method, the stock price of a company is computed by applying the estimation of similar assets. In accordance to this valuation method “the value of the equity in the firm is based upon the pricing of comparable firms relative to the earnings, cash-flows, book value or sales”.37
This valuation method can be divided in two different types of multiples: [1] Price Multiples and [2] Enterprise Multiples. The first group of multiples is computed with reference to the earnings and intuitively to the value of Equity; whereas the second set of multiples comprises the enterprise value.
Rather than choosing what multiple is the most appropriate to use, it is important to define the group of comparable firms – peer group. This group of comparable firms should be share similar characteristics, such as: growth rate, sector of activity, nature of the business, level of revenues, debt to equity ratio, among others.
The ideal peer group would have between 4 to 6 companies within the same industry and similar features. The objective is to get the multiples value for each company and, then, through the average, reach the enterprise value.
Therefore, the choice of the peer group could represent a threat to our analysis and equity research, once it is extremely subjective. To overcome the presented threat, a careful analysis of the industry and the possible companies that will be composing the peer group will be performed, in order to eliminate over/underestimations and to reach the most precise estimation of Novabase enterprise value.
Advantages and Disadvantages of Relative Model
The relative model is simpler and easier to apply compared to the other methods. In accordance with Barbara Petitt and Kenneth Ferris, it is a “quick and dirty way to estimate the value of the
31 | P a g e
company.”38 Simultaneously, Damodaran points that the relative model is “more likely to reflect market perceptions and moods than discounted cash flows valuation.”39 It will be extremely important in cases where it is necessary that the price reflects these perceptions. Finally, this approach requires less information, becoming easier and faster to apply.
On the other hand, as already mentioned, this method is particularly subjective.
1.4.1 Price Multiples
There are three different ways of valuing the firm through Price Multiples: [1] Price to Earnings Ratios, [2] Price to Sales Ratios and [3] Price to Book value Ratios.
I. Price to Earnings Ratios
The price to Earnings ratios are the most widely used in valuation, not only because of its simplicity and information availability, but also because it is a “proxy for a number of other characteristics of the firm, including risk and growth.”40 Therefore, in contrast to the DCF valuation, the Multiples approach eliminates an important phase regarding assumptions estimations, including: level of risk, growth rate, payout ratios, etc.
As it is understandable by the denomination, the price to earnings ratios relates the price per share of the company to its earnings per share.
Relating to the Price to Earnings Ratios, the composition and applicability of four of the several multiples will be explained: [1] P/E Ratio, [2] P/EBIT Ratio, [3] P/EBITDA Ratio and [4] PEG ratio – that according to Damodaran is a particular ratio that should be used in IT companies whose main driver is the expected growth rate.
These ratios require positive accounting earnings. However, not all companies are profitable. In such cases, investors need to find alternative approaches, namely multiples that refer to the sales value instead of earnings.
38 According to: Valuation for Mergers and Acquisitions (2013) by Pearson Educational Inc. 39
Damodaran (1994)
32 | P a g e
I.I Price to Earnings Ratio (PER)
This ratio relates directly the price per share of the company to its earnings per share.
The formula to be used is as follows:
Over this valuation approach, considering that the all other factors remain equal, higher growth firms will have higher PER, as well as companies that comprise a higher level of risk.
I.II Price to EBIT Ratio
In this case, in order to achieve the value of the multiple, the stock price of the firm will be divided by EBIT per share, as shown in the formula below:
I.III Price to EBITDA Ratio
This multiple refers the relation between the Equity value of the firm and EBITDA – earnings before interest taxes and depreciation and amortization.
I.IV Price Earnings to the Expected Growth rate
This multiple is a particularly used in IT service firms, as Novabase, once it relates the price earnings to the expected growth in earnings per share.
33 | P a g e
However, it has some limitations, mainly the fact that the companies that have extremely low or high risk rates will tend to have higher PEG ratios compared to firms with “normal” growth rates possibly leading to biased results.
II. Price to Sales Ratios
The Price to Sales Ratio comprises the relation between the stock price per share and the value of sales, as can be observed in the formula below:
The choice of the analysts to use Price to Sales Ratios is allied with the fact that it can be useful for troubled companies, due to fact that in Price Earnings ratio the value “can become negative and not meaningful.”41 Additionally, this ratio is not easily influenced to the accounting changes and decisions (such as: depreciation and inventory), once the level of sales or revenues is extremely difficult to manipulate. Finally, according to Damodaran (1994), this is the less volatile ratio and consequently it tends to be “more reliable for use in valuation”.
Conversely, one of the disadvantages of this relative is the fact that revenues could not be showing the most precise scenario of the firm. Meaning that the level of revenues could remain constant, but still the level of earnings and/or price per may be falling/rising imprudently.
III. Price to Book Value Ratios
The price to book value ratio presents “the relative premium that investors are willing to pay over the book value of their equity investment in a company”.42 It is achieved through the following way: 41 Damodaran (1994)
34 | P a g e
Analysts considered that it is “highly sensitive to accounting standards and management’s accounting decisions”. Consequently its usage is extremely selective and most frequent for insurance companies and financial institutions that are distinctive for highly liquidity of assets and liabilities.
Damodaran (1994) refers as an advantage of this model the fact that it “provides a relatively stable, intuitive measure of value that can be compared to the market price”43 and also the fact that it can be applied to companies with negative profits.
Notwithstanding, the main drawbacks presented are the fact that this multiple is drastically affected by accounting results and its inutility for service companies.
1.4.2 Enterprise Multiples
The enterprise multiples are reached using the enterprise value of the peer group as reference. Opposing to the other multiples, it analyzes the market value of the operating assets of the firm.
These multiples are suitable to value the equity value per share, for example in the context of M&A.
The most two widely used ratios are: [1] EV/EBITDA and [2] EV/Sales.
I.I EV to EBITDA Ratio
This multiple is achieved by ”netting cash out against debt to arrive at enterprise value and dividing by EBITDA.”44
It can be obtained through the following formula:
43
Damodaran (1994)
35 | P a g e
I.II EV to Sales Ratio
The EV to Sales Ratio refers to the relation between the market value of the firm and the total amount of revenues, as presented:
According Damodaran45 one of the cons presented to this multiple is the adjacent inutility for service companies or brand names.
36 | P a g e
1.5 Valuation Methods Conclusion
In this chapter, the several possible ways of valuing a firm were presented, with the main goal of achieving the set of most suitable models to use when valuing Novabase price per share.
Each model has specific characteristics and should be applied to certain type of firms, according to the business nature, intensity of the cash-flows, etc. According to Damodaran, “the model used in valuation should be tailored to match the characteristics of the asset being valued”46.
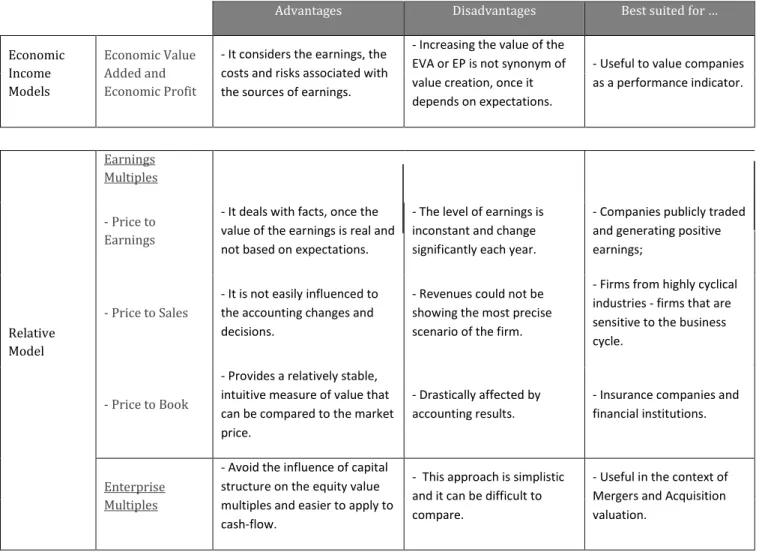
In Table 2, the advantages and drawbacks of each valuation model are presented, as well as the type of companies for which each model is most suitable, in order to summarize and better understand the choice of the Valuation Models for Novabase:
Advantages Disadvantages Best suited for …
Discounted Cash-flow Valuation
Free Cash Flow to the Firm
- Returns the closest
approximation to the real value
of the firm;
- Higher complexity and uncertainty related to the prerequisite of high number of inputs.
- Companies that do not pay dividends or whose dividend payment pattern is irregular;
- Less exposed to market moods and perceptions.
- Firms with shifting leverage.
Free Cash Flow to the Equity
- Returns the closest
approximation to the real value of the firm.
- Inherent difficulty on defining the projection of cash-flows and structure of financial sources.
-Firms in stable leverage and growing at the same or higher rate than the economy.
Adjusted Present Value
- Separates the effects of debt into different components allowing the usage of different discount rates.
- Uncertainty regarding the estimation of the probability of default and bankruptcy costs.
- Value projects that have different risk and
components within a firm.
Option Pricing Model
Binomial and Black Scholes
- It allows to value assets that otherwise would not be able to value and provides fresh insights into drivers of value.
- Difficulty in obtaining the inputs for the option pricing model and the inherent conflict between bondholders and stockholders.
- Firms with natural-resources investments, such as: mines, oil reserves etc. and companies with product patents.
37 | P a g e Advantages Disadvantages Best suited for …
Economic Income Models Economic Value Added and Economic Profit
- It considers the earnings, the costs and risks associated with the sources of earnings.
- Increasing the value of the EVA or EP is not synonym of value creation, once it depends on expectations.
- Useful to value companies as a performance indicator. Relative Model Earnings Multiples - Price to Earnings
- It deals with facts, once the value of the earnings is real and not based on expectations.
- The level of earnings is inconstant and change significantly each year.
- Companies publicly traded and generating positive earnings;
- Price to Sales
- It is not easily influenced to the accounting changes and decisions.
- Revenues could not be showing the most precise scenario of the firm.
- Firms from highly cyclical industries - firms that are sensitive to the business cycle.
- Price to Book
- Provides a relatively stable, intuitive measure of value that can be compared to the market price.
- Drastically affected by accounting results.
- Insurance companies and financial institutions.
Enterprise Multiples
- Avoid the influence of capital structure on the equity value multiples and easier to apply to cash-flow.
- This approach is simplistic and it can be difficult to compare.
- Useful in the context of Mergers and Acquisition valuation.
By synthetizing the major characteristics of each valuation model, it becomes easier to choose the most suitable models for Novabase Equity valuation. Primarily, we exclude both the option pricing model and the Economic Income Models.
Novabase was founded as a “software-house” whose main goal was to develop business solutions through the use of Information Technology (IT). In less than 20 years, Novabase had positioned itself as the largest Portuguese technology company.
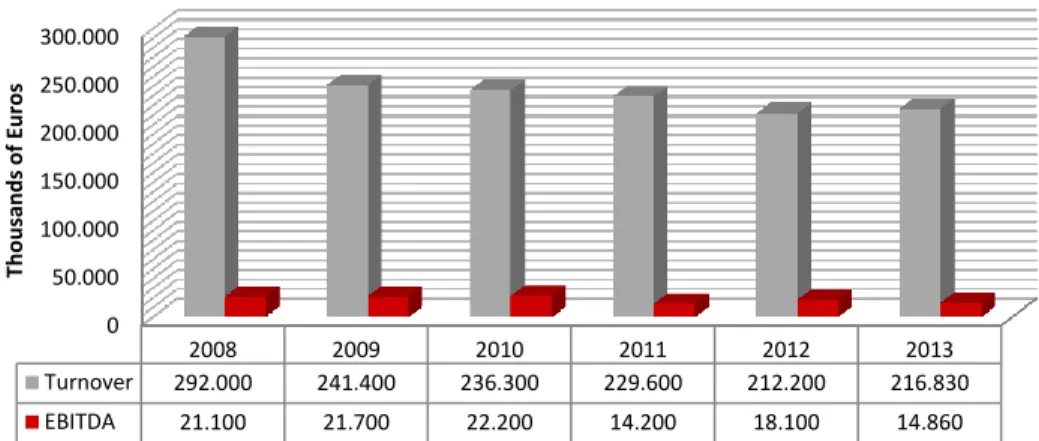
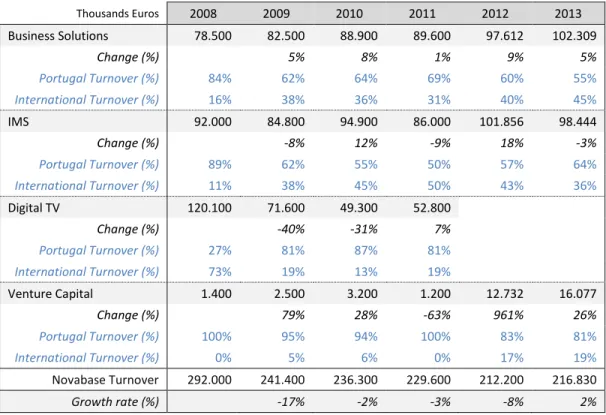
The aim of expansion of its business into international markets is already being achieved with remarkable results. On the 31st December 2013, Novabase presented revenues around 216 million euros and net profit of 7,5 million euros.
38 | P a g e 50.000 100.000 150.000 200.000 250.000 300.000 2008 2009 2010 2011 2012 2013 Th o u san d s o f E u ro s
Its historical turnover shows that Novabase had been presenting constant revenues, representing a steady growth scenario, as figured in the picture that follows:
Consequently, analyzing the pros and cons of each model and looking at the most suitable companies for each model, according to the obtainable characteristics for Novabase, the source of growth, stability of leverage and its industry sector, the most appropriate model is the Discounted Cash-flow Valuation, more specifically the Free Cash-Flow to the Firm approach. Furthermore, in order to complement our analysis, the Relative Valuation model will be performed. In this last valuation model we exclude the Price to Book Values and Price to Sales Values, due to the non-compatibility to Novabase main characteristics.
39 | P a g e
2. Company Presentation
In this Section, we present the most important characteristics and features of Novabase. In order to have a better contextualization, we start by presenting Novabase history and its first steps in the IT services industry. Furthermore, we provide an overall view of Novabase business segments, operational sectors, financial performance and stock performance, allowing for it to be easier to understand the subsequent assumptions, presented in Section 3.
2.1 Novabase presentation
The company was founded in 1989 as a “software-house” and an Information Technology (IT) solution provider. Its main goal was to develop the business solutions through the use of IT and communication. The key differentiation of the Novabase business solutions was the specialization, whereas each customer and/or company would be able to receive a customized and unique solution.
Novabase provides process efficiency and integration solutions, allowing the computerization, mechanization, and integration of business-critical processes.
2.1.1 Beginning and First steps
During the second half of 1990, Novabase positioned itself as an integrator system company, increasing the extensiveness of its offers and building a network of specific and specialized companies.
In 1994, Novabase became the first company in the software development market in Portugal that obtains the certification of their production process by IPQ (Instituto Português de Qualidade), according to NP EN ISO 900147.
In 24 years, Novabase became the Portuguese leader in the IT sector and managed solutions, listed on Euronext Lisbon since 2000.
47
NP EN ISO 9001:2008 – “Sistemas de gestão da qualidade – Requisitos”. (IPQ) Information according to the Novabase Website: www.novabase.pt
40 | P a g e
By 2008, Novabase had created a concept of a “Specialist Enterprises Network, creating along with it an unbeatable value preposition for new talents. Spin-offs were created and/or companies were acquired in areas such as Decision Support, Data Quality, Specialized Human Resources Outsourcing, CRM and others. Key shared services companies were created along with the venture capital company, Novabase Capital”. 48
In 2010, Novabase created a new brand, new vision, values and organizational structure, in order to “experience” the Novabase culture every day.
I.
Vision, Culture and Values
The vision of Novabase is to make people's lives and companies’ daily routines easier and happier through the use of the technology. According to the Novabase CEO, “it is an outward-looking vision focused on benefits for people, both our customers and their customers alike. It is a pioneering and innovative approach. Each customer becomes an opportunity for us to change the lives of thousands or millions of people.”49
By hiring the best and professional expertise, Novabase have been gathering the most important skills and achieving great success, not only in the national but also the international market.
Simultaneously, Novabase has created its new values. Novabase CEO approves that “we focused the organization on what distinguishes it; we defined our service, attitude, positioning and growth strategy. Instead of nouns and adjectives, we use verbs in the present tense and in the first person. “I give”, “I listen”, “I connect” and “I grow” are our values.”50
48 Novabase Annual Report 2008 49
Novabase Annual Report of 2010
50 Novabase Annual Report of 2010
41 | P a g e
II.
Mission
Novabase's mission is to design, deploy and manage innovative business solutions in order to create customer benefits, such as: profitability, service quality and individual satisfaction.
III. Strategy
Novabase first priority is to grow extensively in terms of international turnover, by creating a sustainable growth, increasing sales and investing in the differentiation of its offers.
IV.
Design Thinking
Through its approach of “Design Thinking”, Novabase proposes a creative and new way where individuals are the focus of the solutions. The objective is to reach the demanded solutions by focusing on peoples’ opinion and satisfaction.
In 2012, Novabase reached a turnover of 212 million euros, with 29% of their revenues being obtained outside of Portugal. It is also important to highlight that Novabase operated in 40 different countries, including UK, France and countries in the Middle East, Asia and Africa.
In 2013, Novabase international activity grew 18%, representing already 34% of total annual turnover. According to the Annual Report of 2013, “internationalization is a focus that intensifies year after year, above all in emerging markets.” Novabase products and services have become more sophisticated, allowing them to compete directly with the major companies worldwide.
According to European Union (EU) information, Novabase is considered the sixth company that has higher level investment in Research and Development (R&D) Innovation.
In terms of future perspectives, Novabase aims to achieve higher market share in foreign countries by implementing more projects and creating new opportunities in the African market, namely in South Africa.
42 | P a g e
2.1.2 Operational Business Structure
From the beginning of Novabase first steps, the company aims to ensure the fully commitment and support of their customers, within a multiplicity of sectors.
In order to organize its business segments and consequently to increase the volume of clients, Novabase started structuring itself according to the following main segments: [1] Business Solutions, [2] Infrastructure and Business Solutions, [3] Digital TV and [4] Novabase Capital.
I.
Business Solutions (BS)
This segment is essentially responsible for Financial Services, Government & Healthcare, Telecommunications & Media, Business & IT consulting, Advanced Custom Development, Business Intelligent and Enterprise Applications & Integration.
Business Solutions focuses on “business process consulting, and in designing and deploying applications solutions to support these processes”.51
It allows Novabase to work directly with the largest companies and institutions from Portugal. Additionally, Novabase started implementing its business solutions on emerging markets, internationalizing its operations.
II.
Infrastructure and Managed Solutions (IMS)
Inside this segment, Novabase developed three operational areas: Intelligent Infrastructures, IT Management and Managed Services & Outsourcing.
The first area “develops its engineering expertise through systems and communication infrastructure consulting, design, planning and deployment services.”52
The second area “specializes in IT management and operation process consulting and optimization. It has specific competencies, certifications and software to address every aspect involving the organization, its processes and respective industrialization.” 53
51
Novabase Annual Report of 2008
43 | P a g e
The third area focuses on “post-deployment management and operation, and specifically on specialized or global outsourcing of the entire IT infrastructure.” 54
From 2009, IMS segment was also in charge of Ticketing and Transport Solutions, one of most important business line implemented and developed for transportation sector. Novabase was able to provide organization and gadgets for every stage of the life-cycle of the transporting sector tickets.
III.
Digital TV
Digital TV segment was organized in two main activities: Digital TV - where Novabase provide Digital TV solutions - and SIP (System-in-pack) that represents I&D solutions.
This business area had an extraordinary growth potential. In 2008, Novabase was a “technology leader in the set-top box market, with a history of innovation and of launching new products of great customer value on the market.”55 Additionally, Novabase was the “supplier for all the major cable and pay TV operators in Germany (the largest TV market in Europe) through its partners.” 56
This business segment lasted until 2012, due to restructuring strategies.
IV.
Venture Capital (or Novabase Capital)
Novabase Capital is a venture capital firm owned entirely by Novabase SGPS, SA. Its main purpose is to “support Portuguese business projects – in early development or expanding – with high value potential and synergies with Novabase.“57
Novabase invests, reviews strategies and offers services, such as: marketing and accounting support, in order to help these companies being more profitable and dynamic.
53
Novabase Annual Report of 2008
54
Novabase Annual Report of 2008
55 Novabase Annual Report of 2008 56
Novabase Annual Report of 2008
44 | P a g e
To ensure the continuance of Venture Capital operations, Novabase has been gathering the support of institutions, such as: PME Investimentos, FINOVA – Fundo de Apoio ao Financiamento e à Inovação, PRIME, COMPETE and European Union.
In order to maximize the synergies and operational efficiency, during the second semester of 2012, Novabase reorganized its segments, incorporating Digital TV solutions (DTV) in Infrastructures and Managed Solutions (IMS) and System-in-Package (SIP) in Venture Capital (VC) segment.
Before the reorganization, the Digital TV segment was essentially represented by the German held company, TechnoTrend. However, Novabase decided to sell TechnoTrend, after a long period of reported losses.
Nowadays, after this business restructure, Novabase organizes itself in three operational segments: Business Solutions, Infrastructure and Managed Solutions and Venture Capital. This business structure is predicted to be maintained in the future.
45 | P a g e 65% 6% 2% 3% 24% Portugal Rest of Europe Asia Middle East Africa
2.1.3 International Expansion
“Internationalization is the will, the way and the strategy.”
Luís Paulo Salvado, Novabase CEO
The efforts made regarding international expansion were rewarded and became visible in 2010. Through the implementation of the new brand, vision and mission, Novabase created the intention of expand quickly and globally.
More than the Portuguese IT leader, in 2010, Novabase became a potential and solid company with 8 offices in 6 different countries – Portugal, Germany, Spain, France Angola and United Arab Emirates - with innumerous projects in the 4 continents.
In 2012, as result of selling TechnoTrend, Novabase offices in Germany and France were shut down, due to the disintegration and sale of part of Digital TV segment.
In 2013, Novabase had the opportunity to focus on more profitable projects and markets, opening offices in Maputo (Mozambique) and London (United Kingdom) - countries with powerful economies and higher range of opportunities.
According to Annual Report of 2013, the distribution of turnover by geography was the following:
Through Graph 2, we can notice that the second most representative continent is Africa, representing already 24% of total turnover and a strong opportunity to Novabase African’s operations.
46 | P a g e
In 2010, Novabase Angola inaugurated its operations, creating partnerships with local companies. Around 50% of Novabase Angola is held by Novabase SGPS, whereas the remaining is held by a local firm, Microcenter.
In the second quarter of 2013, Novabase reinforced its position in Africa with the official inauguration of operations in Mozambique. Novabase had invested around 200 Thousand Euros and transferred 10 consultants to ensure the successful implementation of Mozambique’s transportation system.
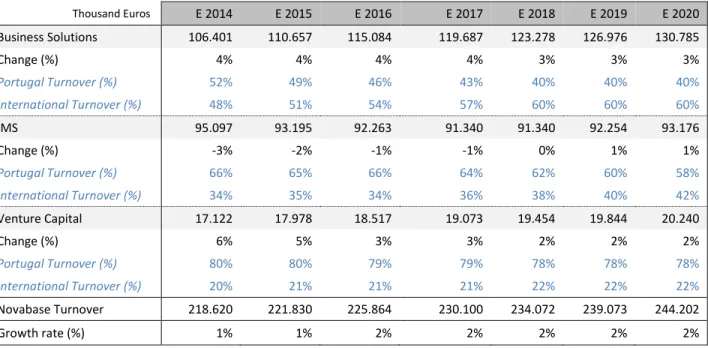
Taking a look at the Guidance for 2014, we can conclude that Novabase expects to maintain its international strategy, gathering partnerships in Istanbul and Ghana. Novabase is considering the acquisition of other companies to accelerate international expansion, representing an investment of around 1 Million Euros. Additionally, and having the same goal in mind, Novabase aims to start an office in South Africa.
Novabase Partnerships and Developments
In terms of partnerships, Novabase, in the last five years, has been gathering strategic partnerships with influent companies, including Microsoft, Siebel and SAP. Novabase provides services that include managing, renewal, controlling and asset optimization.
47 | P a g e
Graph 3: Distribution of Turnover by Sector according to Annual Report of 2013
2.1.4 Customers Activity Sector
Novabase operates essentially with companies from the following industries: Telecommunications & Media, Financial Services, Government & Healthcare, Energy & Utilities, Aerospace & Transportation e Manufacturing & Services.
Performance of Turnover by Sector
In Graph 3, we can observe that Telecommunications and Financial Services are the preponderant sectors, representing 36% and 19% of the total turnover, respectively. The information was extracted from Novabase Annual Report of 2013. In 2012, this distribution was quite similar, excepting for the sectors of Public Administration and Energy.
Main Projects and Developments
In terms of operational sectors, Novabase has already implemented the following important solutions and projects:
Telecommunications and Media
Novabase has recently developed an automatic transfer call service, where land line calls were directly transferred to mobile phones, to ensure that no call was lost. In addition, Novabase
0% 10% 20% 30% 40% 50% 60% 70% 2013 2012