AMTD
6, 7473–7504, 2013Chemical interference or a real
atmospheric phenomenon?
X. Wang et al.
Title Page
Abstract Introduction
Conclusions References
Tables Figures
◭ ◮
◭ ◮
Back Close
Full Screen / Esc
Printer-friendly Version Interactive Discussion
Discussion
P
a
per
|
D
iscussion
P
a
per
|
Discussion
P
a
per
|
Discuss
ion
P
a
per
|
Atmos. Meas. Tech. Discuss., 6, 7473–7504, 2013 www.atmos-meas-tech-discuss.net/6/7473/2013/ doi:10.5194/amtd-6-7473-2013
© Author(s) 2013. CC Attribution 3.0 License.
Atmospheric Measurement
Techniques
Open Access
Discussions
Geoscientiic Geoscientiic
Geoscientiic Geoscientiic
This discussion paper is/has been under review for the journal Atmospheric Measurement Techniques (AMT). Please refer to the corresponding final paper in AMT if available.
High concentrations of N
2
O
5
and NO
3
observed in daytime with a TD-CIMS:
chemical interference or a real
atmospheric phenomenon?
X. Wang1,2, T. Wang1,2, C. Yan1, Y. J. Tham2, L. Xue2, Z. Xu1,2, and Q. Zha1 1
Department of Civil and Environmental Engineering, The Hong Kong Polytechnic University, Hong Kong, China
2
Environment Research Institute, Shandong University, Ji’nan, Shandong, China
Received: 18 July 2013 – Accepted: 7 August 2013 – Published: 19 August 2013
Correspondence to: T. Wang (cetwang@polyu.edu.hk)
AMTD
6, 7473–7504, 2013Chemical interference or a real
atmospheric phenomenon?
X. Wang et al.
Title Page
Abstract Introduction
Conclusions References
Tables Figures
◭ ◮
◭ ◮
Back Close
Full Screen / Esc
Printer-friendly Version Interactive Discussion
Discussion
P
a
per
|
D
iscussion
P
a
per
|
Discussion
P
a
per
|
Discuss
ion
P
a
per
|
Abstract
Dinitrogen pentoxide (N2O5) and the nitrate radical (NO3) play important roles in
at-mospheric chemistry, yet accurate measurements of their concentrations remain chal-lenging. A thermal dissociation chemical ionization mass spectrometer (TD-CIMS) was deployed to an urban site in Hong Kong to measure the sum of N2O5and NO3 in
au-5
tumn 2010. To our surprise, very high concentrations of N2O5+NO3 were frequently
observed in daytime, with mixing ratios in the range of 200–1000 pptv. To investigate this unusual phenomenon, various interference tests and measurements with diff er-ent instrumer-ent configuration were conducted. It was found that peroxy acetyl nitrate (PAN) contributed to measurable signals at 62 amu, and more importantly, this
inter-10
ference increased significantly with co-existence of NO2. Nitric acid (HNO3), on the
other hand, had little interference to the detection of N2O5/NO3via the NO−3 ion in our
TD-CIMS. According to the test results, the interference from PAN and NO2could have contributed to 30–50 % of the average daytime (12:00–16:00 LT) N2O5+NO3signal at
our site. However, evidence exists for the presence of elevated daytime N2O5, in
addi-15
tion to the daytime signal at 62 amu. This includes: (1) daytime N2O5measured via the I(N2O5)− cluster ion with an unheated inlet, which subjects to minimum interferences,
and (2) observation of elevated daytime ClNO2 (a product of N2O5 hydrolysis) during
a follow-up study. In view of the difficulty in accurately quantifying the contribution from the interferences of PAN and NO2 and un-tested potential interfering chemicals in the
20
real atmosphere, we caution the use of 62 amu in the TD-CIMS for measuring ambi-ent N2O5in a high NOxenvironment like Hong Kong. Additional studies are needed to re-examine the daytime issue using other measurement techniques.
1 Introduction
The nitrate radical (NO3) and dinitrogen pentoxide (N2O5) play important roles in the
25
AMTD
6, 7473–7504, 2013Chemical interference or a real
atmospheric phenomenon?
X. Wang et al.
Title Page
Abstract Introduction
Conclusions References
Tables Figures
◭ ◮
◭ ◮
Back Close
Full Screen / Esc
Printer-friendly Version Interactive Discussion
Discussion
P
a
per
|
D
iscussion
P
a
per
|
Discussion
P
a
per
|
Discuss
ion
P
a
per
|
atmosphere, particularly for biogenic hydrocarbons and sulfur-containing compounds (Atkinson, 1991). N2O5 has long been recognized as a key intermediate in the
trans-formation of nitrogen oxides (NOx=NO+NO2) to aerosol nitrates (Riemer et al., 2003;
Aldener et al., 2006; Chang et al., 2011; Brown and Stutz, 2012). Recent studies have also demonstrated an important role of N2O5 hydrolysis at night in chlorine
activa-5
tion and the subsequent effect on the next-day’s ozone formation (Osthoffet al., 2008; Simon et al., 2009; Thornton et al., 2010).
Due to the low ambient abundances and high reactivity, accurate measurements of
atmospheric N2O5 and NO3 have been challenging. Based on the strong absorption
of NO3in the visible spectrum at 662 nm, several optical techniques have been
devel-10
oped to measure the ambient NO3, including long-path differential optical absorption spectroscopy (DOAS) (Platt et al., 1980; Atkinson et al., 1986), cavity ring-down spec-troscopy (CRDS) (Brown et al., 2001, 2002), laser-induced fluorescence (LIF) (Wood et al., 2003, 2005; Matsumoto et al., 2005), and cavity enhanced absorption spec-troscopy (CEAS) (Venables et al., 2006; Langridge et al., 2008). N2O5 is determined
15
by using a heated channel to decompose it into NO3or from the calculation according
to the fast equilibrium between N2O5with NO3and NO2.
Another emerged technique for detecting ambient N2O5 and NO3 is the chemical
ionization mass spectrometry (CIMS) which combines the ion-molecule chemistry with mass spectrometry detection. This technique was originally used in the laboratory to
20
study the heterogeneous uptake kinetics of N2O5 and ClNO2 (e.g., Hu and Abbatt,
1997; Thornton et al., 2003; Thornton and Abbatt, 2005), and later on was applied in field measurements (Slusher et al., 2004; Zheng et al., 2008). The fundamental of this method is the reaction of I− (the reagent ion) with N2O5(and/or NO3) forming the
NO−3 ion that can be detected at 62 amu. Previous laboratory studies suggested that
25
the N2O5/NO3measurement at 62 amu may be subject to interferences from other
AMTD
6, 7473–7504, 2013Chemical interference or a real
atmospheric phenomenon?
X. Wang et al.
Title Page
Abstract Introduction
Conclusions References
Tables Figures
◭ ◮
◭ ◮
Back Close
Full Screen / Esc
Printer-friendly Version Interactive Discussion
Discussion
P
a
per
|
D
iscussion
P
a
per
|
Discussion
P
a
per
|
Discuss
ion
P
a
per
|
(Slusher et al., 2004; Huey et al., 2007) indicating the capability of this method in mea-suring N2O5in the atmosphere. Although non-negligible and varying background
sig-nals at 62 amu have been observed during field studies (Chang et al., 2011), there have been no reports of detailed assessment of these potential interferences under different atmospheric conditions and for different configurations of CIMS. Kercher et al. (2009)
5
developed a method to detect N2O5via the I(N2O5)− cluster ion at 235 amu with an
un-heated inlet to address the interference at 62 amu in their CIMS, however this method has its own limitation including a lower sensitivity and larger impact of water vapor than that at 62 amu.
In autumn 2010, a TD-CIMS (thermal dissociation-CIMS), which is the same type
10
used by Slusher et al. (2004) and Huey et al. (2007), was deployed to an urban site in Hong Kong which is characterized by large quantities of NOx, ozone and particulate
matters. Unexpectedly, concentration peaks of N2O5+NO3were frequently observed
in daytime in our study. To investigate this unusual observation, we have conducted a series of laboratory and field tests, including testing interferences individually and in
15
combination from PAN, NO2, O3, HNO3, detection of N2O5by using a cold inlet via the
detection of I(N2O5)− cluster ion at 235 amu, and examination of daytime ClNO
2which
is a product of N2O5. In this paper, we will first present the ambient observations, and
then the detailed test results on interferences and other evidence for daytime N2O5.
A surprising result from the tests is that PAN+NO2can have large interference to the
20
TD-CIMS at 62 amu, which has not been reported in previous studies. Despite large chemical interference, we show that the observed daytime N2O5signal may be in part
AMTD
6, 7473–7504, 2013Chemical interference or a real
atmospheric phenomenon?
X. Wang et al.
Title Page
Abstract Introduction
Conclusions References
Tables Figures
◭ ◮
◭ ◮
Back Close
Full Screen / Esc
Printer-friendly Version Interactive Discussion
Discussion
P
a
per
|
D
iscussion
P
a
per
|
Discussion
P
a
per
|
Discuss
ion
P
a
per
|
2 Experiment and methodology
2.1 Measurement site
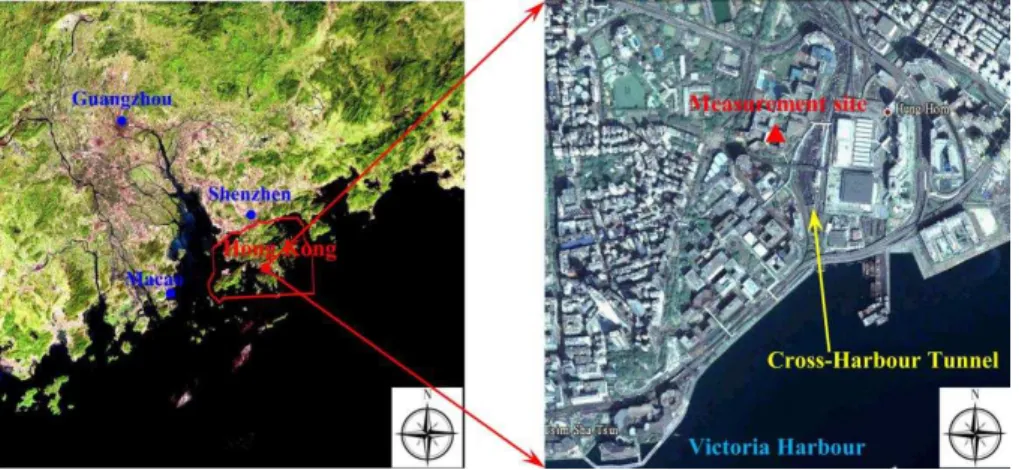
The field study was conducted in the urban center of Hong Kong (22◦18′N, 114◦11′E,
∼15 m a.s.l.). The sampling site was located on the rooftop of a seven-story teaching
building (about 20 m above the ground) on the campus of the Hong Kong
Polytech-5
nic University (HKPU). To the southeast of the campus, there is a cross-harbor tunnel in the north-south direction with a large flow of vehicles, especially during rush hours (see Fig. 1). Victoria Harbor is located about 1 km south of the measurement site. Thus emissions from vehicles and marine vessels are the most important local an-thropogenic sources. The sampling site is surrounded by business districts, tourism
10
and residential areas, with no large industrial sources nearby. The field measurements were carried out from 15 October to 4 December 2010, which is the season with the most severe photochemical pollution in Hong Kong (Wang et al., 2009).
2.2 The CIMS apparatus
A TD-CIMS was deployed to measure the sum of N2O5and NO3in this study. The
sys-15
tem was developed at theGeorgia Institute of Technology and is based on a soft and selective ionization process resulting from the reaction between a reagent ion and the target compounds, with the generated ions detected by a mass spectrometer. In the present study, the measurement method and operating parameters of TD-CIMS were the same as those described by Slusher et al. (2004) which was configured to
simul-20
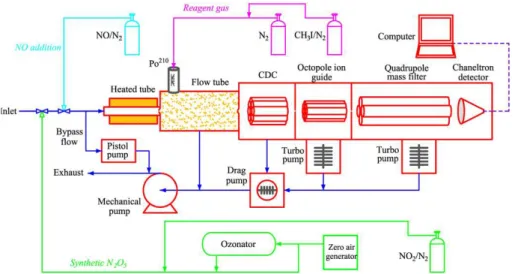
taneously measure ambient N2O5and PANs. The schematic diagram of our TD-CIMS
is shown in Fig. 2. I−, which was produced from passing a flow of 2 sccm of 0.3 %
CH3I/N2through an alpha ion source (Po-210), served as the reagent ion. Ambient air
samples were drawn through a PFA-Teflon tube (I.D., 9.5 mm; O.D., 12.7 mm; length, 2 m) to the CIMS at a flow rate of 1.5 standard liters per minute (SLPM). To reduce the
25
AMTD
6, 7473–7504, 2013Chemical interference or a real
atmospheric phenomenon?
X. Wang et al.
Title Page
Abstract Introduction
Conclusions References
Tables Figures
◭ ◮
◭ ◮
Back Close
Full Screen / Esc
Printer-friendly Version Interactive Discussion
Discussion
P
a
per
|
D
iscussion
P
a
per
|
Discussion
P
a
per
|
Discuss
ion
P
a
per
|
was directed to the exhaust. Immediately before the flow tube, the last 14.8 cm of inlet was heated to 180◦C. The temperature of the air on the axis of the heated inlet was estimated at∼117◦C (Slusher et al., 2004), under which condition more than 99 % of
the N2O5 would decompose into NO3 with an ambient NO2 level of 40 ppbv. The pro-duced and the original NO3 then reacted with I− to produce NO−3 ions in the flow tube,
5
which were subsequently detected and quantified by a quadruple mass spectrometer at 62 amu with a time resolution of 6 s. The NO−3 signal is proportional to the concen-tration of total NO3, the I− signal, the effective reaction rate constant between them,
and the effective reaction time (Huey, 2007). Figure 3 depicts the mass spectrums of ambient air in urban Hong Kong obtained both at day and at night, which clearly shows
10
the I−signal at 127 amu, NO−3 (N2O5+NO3) signal at 62 amu, and CH3C(O)O− (PAN)
signal at 59 amu, etc.
In the present study, the TD-CIMS instrument was calibrated once a week using the on-line N2O5synthesis method (Bertram et al., 2009). The calibration source was gen-erated from the reactions of NO2with O3and subsequently NO3with NO2. The
concen-15
trations of the prepared N2O5were determined via the change in NO2concentrations
after adding ozone, and conversely verified by the change in ozone after adding NO2. Zero air that was free from moisture and aerosols served as the diluent so as to prevent the hydrolysis of N2O5 during the calibrations (see Fig. 2). NO2 was monitored with
a chemiluminescence analyzer equipped with a photolytic converter, which ensured
20
measurements of the true NO2 (Xu et al., 2012). Based on the relative standard
devi-ation of the sample signal, the precision of our TD-CIMS was 3 % for 1000 pptv N2O5.
The sensitivity of N2O5during the campaign was 2.8±0.2 (mean±SD) Hz pptv−1. The
instrument background was automatically measured for 2 min once an hour by adding a small flow (5 mL min−1) of NO (1000 ppm) to the sample flow (diluted to 9.2 SLPM),
25
titrating NO3 and thus N2O5. The background signal of the NO−
3 ion during this field
study was 71.7±36.0 (mean±SD) Hz. Figure 4 shows the raw signals of N2O5+NO3
AMTD
6, 7473–7504, 2013Chemical interference or a real
atmospheric phenomenon?
X. Wang et al.
Title Page
Abstract Introduction
Conclusions References
Tables Figures
◭ ◮
◭ ◮
Back Close
Full Screen / Esc
Printer-friendly Version Interactive Discussion
Discussion
P
a
per
|
D
iscussion
P
a
per
|
Discussion
P
a
per
|
Discuss
ion
P
a
per
|
exhibited relatively low background compared to ambient N2O5+NO3during both day and night. According to three times the standard deviation of the background signal, the typical detection limit of N2O5for 6 s average time was estimated to be 13 pptv for
our TD-CIMS.
2.3 Other instruments
5
In addition to the TD-CIMS, a large number of other instruments were deployed con-currently. Here, we briefly describe those that were used to aid the presentation of
the N2O5 and NO3 data. O3 was measured by a commercial UV photometric
ana-lyzer (Model 49i, Thermo Environmental Instruments (TEI), USA). NO and NO2 were
analyzed with a chemiluminescence instrument (Model 42i, TEI) equipped with a
pho-10
tolytic NO2-converter (Air Quality Design, USA) (Xu et al., 2012). Solar radiation was
measured using a LI-200 Pyranometer Sensor (LI-COR, USA). The ambient RH and
temperature were monitored with a RH/temperature probe(Model 41382VC/VF, M.R.
YOUNG, USA). During the field measurements, the minute-average data of trace gases
and meteorological parameters were collected in real time by a data logger (Model
15
8816, Environmental Systems Corporation, USA).
3 Observation results
The time series of hourly mixing ratios of N2O5+NO3 measured in urban Hong Kong
from 15 October to 4 December 2010 is shown in Fig. 3. Similar to the measurement re-sults obtained in other locations, several night-time concentration peaks of N2O5+NO3
20
were noticed in our study (e.g., 31 October, 1 and 10 November). However, very high mixing ratios of N2O5+NO3were frequently observed during the daytime (e.g., 23 and
24 October, 19, 22 and 30 November, and 2 December). During the 50 day measure-ment period (excluding 11 November due to a lack of data), the average hourly con-centration of N2O5+NO3was 86.9 (±85.6) pptv with the maximum value of 1033 pptv
AMTD
6, 7473–7504, 2013Chemical interference or a real
atmospheric phenomenon?
X. Wang et al.
Title Page
Abstract Introduction
Conclusions References
Tables Figures
◭ ◮
◭ ◮
Back Close
Full Screen / Esc
Printer-friendly Version Interactive Discussion
Discussion
P
a
per
|
D
iscussion
P
a
per
|
Discussion
P
a
per
|
Discuss
ion
P
a
per
|
recorded at 15:00 LT on 30 November. The mean daytime mixing ratio of N2O5+NO3 was 102.5 pptv (06:00–17:59 LT), even higher than the value of 71.3 pptv at nighttime (18:00–05:59 LT).
To learn more about the atmospheric conditions associated with the elevated day-time N2O5 and NO3 signals at 62 amu, we present six cases during which the hourly
5
N2O5+NO3values exceeded 400 pptv. Figure 4 presents the 5 min data of N2O5+NO3,
O3, Ox (O3+NO2), NO, NO2, RH, and solar radiation for these episodes. The ratio of NO3/N2O5, calculated based on the temperature dependent equilibrium among
N2O5, NO3 and NO2, is also given. Inspection of the figure reveals that the daytime
N2O5+NO3 peaks appeared when both ozone and NO2 were in high levels together
10
with low levels of NO. However, daytime N2O5+NO3concentrations calculated using
both steady state (Osthoff et al., 2006) and non-steady state approaches (McLaren
et al., 2010) were much lower (by a factor of 1–100) than observations. The daytime concentrations in our study are also much higher than those of previous studies which reported daytime N2O5 and NO3concentrations of only a few to over ten pptv (Geyer
15
et al., 2003; Brown et al., 2005; Osthoffet al., 2006).
4 Chemical interferences
A major drawback of the TD-CIMS technique is that there could be potential interfer-ences to the selected NO−3 ion that can give rise to significant background noise at 62 amu (Chang et al., 2011). Previous laboratory studies have proposed many
possi-20
ble ion-molecule reactions yielding the NO−3 ion, as summarized in Table 1. As stated earlier, the detailed results of these interferences in the real atmospheres have not been reported to date. To examine the influences of these potential interferences to our N2O5+NO3 measurements, a series of tests were conducted in various atmospheric
conditions and in laboratory during and after the measurement campaign.
25
AMTD
6, 7473–7504, 2013Chemical interference or a real
atmospheric phenomenon?
X. Wang et al.
Title Page
Abstract Introduction
Conclusions References
Tables Figures
◭ ◮
◭ ◮
Back Close
Full Screen / Esc
Printer-friendly Version Interactive Discussion
Discussion
P
a
per
|
D
iscussion
P
a
per
|
Discussion
P
a
per
|
Discuss
ion
P
a
per
|
compounds that are unreactive to NO, including most potential ones other than PAN
and HO2NO2. As stated above, the background was periodically measured once an
hour throughout the campaign. Considerable amount of background signals at 62 amu
in our CIMS was indeed seen during the present study with a mean counts (±SD) of
71.7 (±36.0) Hz, and they also exhibited a diurnal pattern with higher values in the 5
late afternoon (see Fig. 5). This indicated that the N2O5+NO3measurements via the
62 amu channel in our TD-CIMS were subject to some interference during the present study. However, the background signals were much lower than the ambient signals. For the six cases with daytime N2O5+NO3concentrations exceeding 400 pptv, the
in-strument background only accounted for on average 10 % of the ambient values. This
10
background signal due to most of the gases shown in Table 1 and has been accounted for (i.e., subtracted from the total signals at 62 amu) in our final data. The interference
from PAN and HO2NO2 could not be determined because they also reacted with NO
during zeroing. Their interferences are addressed below.
4.1 Interference of PAN
15
PAN is the most possible compound to interfere the TD-CIMS measurements in this study, not only due to its relatively high ambient abundances but also because it can escape from background determination by adding NO. In the previous studies, higher N2O5 signals than the steady-state predictions were usually observed with elevated
mixing ratios of PAN (Brown et al., 2005; Osthoffet al., 2006). The interference from
20
PAN to the NO−
3 signals in our TD-CIMS was evaluated post the field campaign by
adding synthetic PAN to zero air and in the ambient air samples. The PAN was
gen-erated from a PAN calibrator (Meteorologie Consult GmbH), which is based on the
reaction sequence of NO and acetone in ultrapure air with a Penray lamp. The con-centrations of PAN that were added to the CIMS were quantified simultaneously by
25
a NOy analyzer (TEI42CY). We also generated PAN using a conventional wet
AMTD
6, 7473–7504, 2013Chemical interference or a real
atmospheric phenomenon?
X. Wang et al.
Title Page
Abstract Introduction
Conclusions References
Tables Figures
◭ ◮
◭ ◮
Back Close
Full Screen / Esc
Printer-friendly Version Interactive Discussion
Discussion
P
a
per
|
D
iscussion
P
a
per
|
Discussion
P
a
per
|
Discuss
ion
P
a
per
|
results from the two PAN sources are consistent, thus this study only shows the result which used the PAN generated from the photolytic source.
For tests of PAN in zero air and in relatively clean ambient air at a coastal site (Hok Tsui), measurable interference from PAN was observed at 62 amu. The result in zero air indicates 17∼25 (22.8±4.1) pptv from NO3+N2O5 for every ppbv of PAN (see
5
intercepts in Fig. 7). Adding PAN to ambient air at the coastal site yielded similar results. Table 2 shows the results from four tests conducted with varying ambient pollution levels and meteorological conditions. Introducing 5.6–6.3 ppb of PAN to the ambient air resulted in an increase in the NO−3 signal of 42–75 pptv of NO3+N2O5in our TD-CIMS,
again indicating interference from PAN to the field NO3/N2O5 measurements via the
10
NO−3 by TD-CIMS. The mechanism how PAN interferes the NO−3 detection is unclear. Some researchers proposed that the CH3C(O)O−ion (produced from the reaction of I−
with CH3C(O)O2– the product of PAN thermo-dissociation) likely reacts with HNO3 to
produce NO−3 (Veres et al., 2008; Roberts et al., 2010). This appeared not to be the
case in our CIMS as additions of both PAN and HNO3 didn’t lead to any increase at
15
62 amu compared to the addition of PAN alone (see Fig. 6).
A surprising finding was much large interferences at 62 amu when the same spike tests were conducted at the PolyU site, which has very high NOx concentrations, and the interference appeared to increase with ambient NO2 suggesting that reaction
be-tween PAN and NO2leads to significant interference at 62 amu. To confirm this, a
se-20
ries of tests were conducted. Figure 7 shows the signal at 62 amu as a function of PAN and NO2 concentrations in zero, which clearly shows that the interference increases
with both PAN and NO2. For example, at 5 ppbv of PAN, adding 60 ppbv of NO2
pro-duces 400 ppt equivalent NO3signal, compared to 150 pptv without NO2, indicating an amplifying effect of NO2on the previously reported PAN interference. The exact
chem-25
ical reaction that leads to the interference is not clear. We believe that interference of PAN+NO2 is related to the thermal dissociation of PAN followed by radical reactions with NO2in the heated inlet. The radical reactions might serve as a source of NO3and
AMTD
6, 7473–7504, 2013Chemical interference or a real
atmospheric phenomenon?
X. Wang et al.
Title Page
Abstract Introduction
Conclusions References
Tables Figures
◭ ◮
◭ ◮
Back Close
Full Screen / Esc
Printer-friendly Version Interactive Discussion
Discussion
P
a
per
|
D
iscussion
P
a
per
|
Discussion
P
a
per
|
Discuss
ion
P
a
per
|
62 amu. We will evaluate the possible contribution of PAN+NO2 to the observed high daytime N2O5+NO3for the 2010 autumn study later.
4.2 Interference of HNO3
Another possible source of interference to the NO−3 ion is the HNO3since it has a NO3
group. Several studies have proposed the production of NO−
3 from ion-molecule
re-5
actions involving HNO3, with somewhat inconsistent results. Huey and co-workers
showed that the reaction of I−with HNO3(producing NO−3) was rather inefficient.
Thorn-ton and coworkers on the other hand found a significant background signal (10–50 Hz) at the NO−3 mass in a cold iodide CIMS under conditions of long ion-molecule reaction time, and attributed this to the reaction of HNO3with I−(Thornton et al., 2003; Thornton
10
and Abbatt, 2005). Roberts and coworkers reported that the HNO3was sensitive to the acetate ions and react to produce NO−3 ions at the 62 amu (Veres et al., 2008; Roberts et al., 2010).
The relatively low background signals by adding NO in our study suggest insignificant interference from HNO3to our CIMS, which has been corrected during data reduction.
15
This was further confirmed by the addition of HNO3. The test was carried out three
times for varying ambient conditions to check the repeatability of the results, which are listed in Table 2 with an example being shown in Fig. 6. It can be seen that after
introducing a trace amount of HNO3 to the inlet tube of our TD-CIMS, there was no
significant increase in the NO−3 signal compared to the ambient air. Additionally, adding
20
HNO3to a trace level of PAN which resulted in an acetate ion signal of∼0.9×10⁴Hz,
the NO−3 signal showed no apparent change compared to that for only adding PAN.
These results suggest that the HNO3 itself and its mixture with acetate ions have no
significant interference to the detection of N2O5+NO3via the NO−
3 ion in our TD-CIMS.
It should be noted that the result of non-reactivity of HNO3 to the acetate ion in our
25
AMTD
6, 7473–7504, 2013Chemical interference or a real
atmospheric phenomenon?
X. Wang et al.
Title Page
Abstract Introduction
Conclusions References
Tables Figures
◭ ◮
◭ ◮
Back Close
Full Screen / Esc
Printer-friendly Version Interactive Discussion
Discussion
P
a
per
|
D
iscussion
P
a
per
|
Discussion
P
a
per
|
Discuss
ion
P
a
per
|
(negative-ion proton-transfer CIMS) (Veres et al., 2008; Roberts et al., 2010), possibly due to different configurations and operation conditions.
4.3 Interference of other possible compounds
ClONO2, BrONO2 and HO2NO2 also react efficiently with I− to produce NO−3 (Huey
et al., 1995; Hanson et al., 1996; Zhang et al., 1997; Amelynck et al., 2001). Again, the
5
relatively low instrument background indicated small interference from ClONO2 and
BrONO2 and any interference from them would have been corrected in our
measure-ments because they cannot be removed by adding NO. The zeroing would not work for HO2NO2. However, it is impossible for HO2NO2 to pass through the heated inlet tube
in our TD-CIMS considering its thermally unstable nature.
10
In addition, the NO−3 ion may also come from the ion-molecule reactions involving Cl−(35 amu), C2H2N−(40 amu), NO−2 (46 amu), O
−
3 (48 amu), CO
−
3 (60 amu), and CO
−
4
(76 amu) (listed in Table 1). These reagent ions were observed in quite low levels (i.e.,
<20 Hz for 40 and 48 amu, and 10–500 Hz for 35, 46, 60 and 76 amu) in our TD-CIMS during the field measurements (see Fig. 3). Therefore, the ion-molecule reactions
in-15
duced by Cl−, C2H2N−, NO−2, O
−
3, CO
−
3 and CO
−
4 are also believed to have no significant
influence to the NO−3 detection based on the relationship between the product ion and reactants.
In summary, according to the above tests and discussions, reactions between PAN and NO2in the heated inlet are found to have significant interference to signal at 62 amu
20
AMTD
6, 7473–7504, 2013Chemical interference or a real
atmospheric phenomenon?
X. Wang et al.
Title Page
Abstract Introduction
Conclusions References
Tables Figures
◭ ◮
◭ ◮
Back Close
Full Screen / Esc
Printer-friendly Version Interactive Discussion
Discussion
P
a
per
|
D
iscussion
P
a
per
|
Discussion
P
a
per
|
Discuss
ion
P
a
per
|
5 Contribution of interference to daytime concentrations
As indicated above, laboratory and field tests revealed significant interference from PAN and NO2 to 62 amu in our TD-CIMS. The contribution from this interference to the
ob-served daytime N2O5+NO3in this study was examined and corrected based the tests results in Fig. 7. During the field campaign at PolyU, PAN was concurrently measured
5
by the same TD-CIMS and a GC-ECD instrument (gas chromatography with an elec-tron capture detector). For the six episodes shown in Fig. 4, the interference would con-tribute to 41.3–67.0 %, 29.0–39.8 %, 32.2–73.2 %, 25.6–49.2 %, 19.4–43.4 %, 20.4– 77.8 %, respectively, to the daytime signals in the 6 episodes. (Two examples on 23 October and 30 November were shown in Fig. 8.) The remaining daytime signal may
10
be a real contribution from N2O5and NO3, but interferences from other untested
chem-icals cannot be ruled out. As interferences at the 62 ion channel are large and variable, it is difficult to determine the fraction of real signal from N2O5+NO3 in our study at 62 amu.
6 Other evidence of daytime NO3+N2O5in Hong Kong 15
To check the measurement results by at 62 amu, we attempted to measure ambient N2O5with a cold version of CIMS immediately after the present campaign at the same
site. The CIMS was configured similar to that described by Kercher et al. (2009). When an unheated inlet tube is used, the reactions of N2O5 with I− produce both the NO−
3
and I(N2O5)− cluster ions. The I(N2O5)− ion (at 235 amu) is thought to be free from
20
the chemical interferences that can perturb the NO−3 ion, and thus provides a better measure of N2O5 (Kercher et al., 2009). In our study, the sensitivity of N2O5 from the I(N2O5)− ion was determined at 0.55±0.003 Hz pptv−
1
, which is smaller than the value of 0.93 Hz pptv−1 obtained by Kercher et al. (2009) possibly due to a smaller sample flow rate and/or stronger electric field in the collisional dissociation chamber
25
AMTD
6, 7473–7504, 2013Chemical interference or a real
atmospheric phenomenon?
X. Wang et al.
Title Page
Abstract Introduction
Conclusions References
Tables Figures
◭ ◮
◭ ◮
Back Close
Full Screen / Esc
Printer-friendly Version Interactive Discussion
Discussion
P
a
per
|
D
iscussion
P
a
per
|
Discussion
P
a
per
|
Discuss
ion
P
a
per
|
not re-scaled according to the I(H2O)−/I− ratio as described by Kercher et al. (2009),
because the I− ion at 127 amu was not detected in real-time in our study. The
re-scaled N2O5 concentrations during the daytime would be even higher, because the
daytime I(H2O)−signals were generally lower than (by a factor of 0.4–1.0) those during
the calibrations. Despite the above uncertainty in determining the absolute value, the
5
general variation pattern of N2O5should be trustworthy. Consistent with the setup with
the heated inlet and the detection at 62 amu, signal at 235 amu with the cold CIMS also showed a daytime peak. Figure 9 gives an example of the ambient results taken on 20 December 2010.
Another independent piece of evidence for the daytime N2O5+NO3 in Hong Kong
10
is concurrent increase in the mixing ratios of ClNO2 (a product of N2O5 hydrolysis)
observed in a follow-up study in western Hong Kong (Tung Chung; see SI for the experiment information). At this site, elevated N2O5+NO3 concentrations were also
found at daytime during photochemical episodes, with the ClNO2 signals (208 amu)
showing concurrent increases. Figure 10 shows an example for 28 August 2011. On
15
that day, N2O5+NO3from 62 amu exhibited an afternoon peak of 670 pptv (5 min
av-erage, at 14:00 LT), and ClNO2 had a concurrent enhancement to 120 pptv. To
esti-mate the levels of N2O5 that would be needed to sustain such amount of ClNO2, we assumed a photostationary steady state for ClNO2in the afternoon with an uptake
co-efficient of 0.03 for N2O5 hydrolysis on aerosol surfaces and a ClNO2 yield of 10 %.
20
The photolysis rate of ClNO2 was estimated as 7.8×10⁻⁴s−1 using the method by
Simon et al. (2009), and the aerosol surface area was 979 mm2m−3 from concurrent measurements of aerosol size distribution. The calculation showed that to produce the observed 120 pptv of ClNO2, at least 518 pptv of N2O5 would be required. This result provides additional corroboration of the possible elevated daytime concentrations of
25
AMTD
6, 7473–7504, 2013Chemical interference or a real
atmospheric phenomenon?
X. Wang et al.
Title Page
Abstract Introduction
Conclusions References
Tables Figures
◭ ◮
◭ ◮
Back Close
Full Screen / Esc
Printer-friendly Version Interactive Discussion
Discussion
P
a
per
|
D
iscussion
P
a
per
|
Discussion
P
a
per
|
Discuss
ion
P
a
per
|
7 Conclusions
A TD-CIMS technique, which has been previously applied to field measurements in the
US, was deployed to measure ambient NO3and N2O5 in urban Hong Kong in a
pho-tochemical season. Surprisingly, concentration peaks of NO3+N2O5were frequently observed in daytime at 62 amu channel in the TD-CIMS, which is in contrast to our
cur-5
rent understanding of reactive nitrogen chemistry. Our subsequent laboratory and field tests provide new insights into chemical interferences in the TD-CIMS. In particular,
we have discovered that reaction between NO2 and PAN can amplify the interference
from PAN at 62 amu. This interference could have contributed 30–50 % to the average daytime NO3 and N2O5 at our site. Despite the large interference, evidence exists to
10
suggest that the elevated N2O5in daytime may be in part due to real contribution from
NO3or N2O5. In viewing of the large and variable interferences at 62 amu and difficulty
in correcting them, we conclude that it is not suitable to use the TD-CIMS to measure NO3or N2O5at 62 amu in a high NOxenvironment like the present study site. Adoption
of either 235 amu with a cold inlet or an optics-based technique is recommended. We
15
also suggest more studies to examine the abundance of daytime NO3 and N2O5 in
similar urban areas with co-existence of high ozone and NO2.
Supplementary material related to this article is available online at http://www. atmos-meas-tech-discuss.net/6/7473/2013/amtd-6-7473-2013-supplement.pdf.
Acknowledgements. We thank Steven Poon and K.S. Lam for their help in the field study and 20
AMTD
6, 7473–7504, 2013Chemical interference or a real
atmospheric phenomenon?
X. Wang et al.
Title Page
Abstract Introduction
Conclusions References
Tables Figures
◭ ◮
◭ ◮
Back Close
Full Screen / Esc
Printer-friendly Version Interactive Discussion
Discussion
P
a
per
|
D
iscussion
P
a
per
|
Discussion
P
a
per
|
Discuss
ion
P
a
per
|
References
Aldener, M., Brown, S., Stark, H., Williams, E., Lerner, B., Kuster, W., Goldan, P., Quinn, P., Bates, T., and Fehsenfeld, F.: Reactivity and loss mechanisms of NO3 and N2O5 in a pol-luted marine environment: results from in situ measurements during New England Air Quality Study 2002, J. Geophys. Res., 111, D23S73, doi:10.1029/2006JD007252, 2006.
5
Amelynck, C., Stépien, C., Schoon, N., Catoire, V., Labonnette, D., Arijs, E., and Poulet, G.: Gas phase reactions of negative ions with ClONO2, Int. J. Mass. Spectrom., 207, 205–215, doi:10.1016/S1387-3806(01)00373-6, 2001.
Atkinson, R.: Kinetics and mechanisms of the gas-phase reactions of the NO3 radical with organic compounds, J. Phys. Chem. Ref. Data, 20, 459–507, doi:10.1063/1.555887, 1991. 10
Atkinson, R., Winer, A. M., and Pitts, J. N.: Estimation of night-time N2O5concentrations from ambient NO2 and NO3 radical concentrations and the role of N2O5in night-time chemistry, Atmos. Environ., 20, 331–339, doi:10.1016/0004-6981(86)90035-1, 1986.
Bertram, T. H., Thornton, J. A., and Riedel, T. P.: An experimental technique for the direct measurement of N2O5 reactivity on ambient particles, Atmos. Meas. Tech., 2, 231–242, 15
doi:10.5194/amt-2-231-2009, 2009.
Brown, S. S. and Stutz, J.: Nighttime radical observations and chemistry, Chem. Soc. Rev., 41, 6405–6447, doi:10.1039/c2cs35181a, 2012.
Brown, S., Stark, H., Ciciora, S., and Ravishankara, A.: In situ measurement of atmospheric NO3 and N2O5 via cavity ring down spectroscopy, Geophys. Res. Lett., 28, 3227–3230, 20
doi:10.1029/2001GL013303, 2001.
Brown, S. S., Stark, H., Ciciora, S. J., McLaughlin, R. J., and Ravishankara, A. R.: Simultaneous in situ detection of atmospheric NO3and N2O5via cavity ring-down spectroscopy, Rev. Sci. Instrum., 73, 3291–3301, doi:10.1063/1.1499214, 2002.
Brown, S. S., Osthoff, H. D., Stark, H., Dubé, W. P., Ryerson, T. B., Warneke, C., de Gouw, J. A., 25
Wollny, A. G., Parrish, D. D., and Fehsenfeld, F. C.: Aircraft observations of daytime NO3and N2O5and their implications for tropospheric chemistry, J. Photoch. Photobio. A, 176, 270– 278, doi:10.1016/j.jphotochem.2005.10.004, 2005.
Chang, W. L., Bhave, P. V., Brown, S. S., Riemer, N., Stutz, J., and Dabdub, D.: Heterogeneous atmospheric chemistry, ambient measurements, and model calculations of N2O5: a review, 30
AMTD
6, 7473–7504, 2013Chemical interference or a real
atmospheric phenomenon?
X. Wang et al.
Title Page
Abstract Introduction
Conclusions References
Tables Figures
◭ ◮
◭ ◮
Back Close
Full Screen / Esc
Printer-friendly Version Interactive Discussion
Discussion
P
a
per
|
D
iscussion
P
a
per
|
Discussion
P
a
per
|
Discuss
ion
P
a
per
|
Fehsenfeld, F., Howard, C., and Schmeltekopf, A.: Gas phase ion chemistry of HNO3, J. Phys. Chem., 63, 2835–2841, doi:10.1063/1.431722, 1975.
Gaffney, J. S., Fajer, R., and Senum, G. I.: An improved procedure for high purity gaseous peroxyacyl nitrate production: use of heavy lipid solvents, Atmos. Environ., 18, 215–218, doi:10.1016/0004-6981(84)90245-2, 1984.
5
Geyer, A., Alicke, B., Ackermann, R., Martinez, M., Harder, H., Brune, W., di Carlo, P., Williams, E., Jobson, T., and Hall, S.: Direct observations of daytime NO3: implications for urban boundary layer chemistry, J. Geophys. Res., 108, 4368, doi:10.1029/2002JD002967, 2003.
Hanson, D. R., Ravishankara, A. R., and Lovejoy, E. R.: Reaction of BrONO2 with H2O on 10
submicron sulfuric acid aerosol and the implications for the lower stratosphere, J. Geophys. Res., 101, 9063–9069, doi:10.1029/96jd00347, 1996.
Hu, J. H. and Abbatt, J. P. D.: Reaction probabilities for N2O5 hydrolysis on sulfuric acid and ammonium sulfate aerosols at room temperature, J. Phys. Chem. A, 101, 871–878, doi:10.1021/jp9627436, 1997.
15
Huey, L.: Measurement of trace atmospheric species by chemical ionization mass spectrome-try: speciation of reactive nitrogen and future directions, Mass. Spectrom. Rev., 26, 166–184, doi:10.1002/mas.20118, 2007.
Huey, L., Hanson, D., and Howard, C.: Reactions of SF6− and I− with atmospheric trace
gases, J. Phys. Chem., 99, 5001–5008, doi:10.1021/j100014a021, 1995. 20
Ikezoe, Y. and Viggiano, A.: Gas Phase Ion-Molecule Reaction Rate Constants Through 1986, Ion Reaction Research Group of the Mass Spectroscopy Society of Japan, distributed by Maruzen Co., Tokyo, Japan, 1987.
Kercher, J. P., Riedel, T. P., and Thornton, J. A.: Chlorine activation by N2O5: simultaneous, in situ detection of ClNO2 and N2O5by chemical ionization mass spectrometry, Atmos. Meas. 25
Tech., 2, 193–204, doi:10.5194/amt-2-193-2009, 2009.
Langridge, J. M., Ball, S. M., Shillings, A. J. L., and Jones, R. L.: A broadband absorption spectrometer using light emitting diodes for ultrasensitive, in situ trace gas detection, Rev. Sci. Instrum., 79, 123110, doi:10.1063/1.3046282, 2008.
Matsumoto, J., Kosugi, N., Imai, H., and Kajii, Y.: Development of a measurement system for ni-30
AMTD
6, 7473–7504, 2013Chemical interference or a real
atmospheric phenomenon?
X. Wang et al.
Title Page
Abstract Introduction
Conclusions References
Tables Figures
◭ ◮
◭ ◮
Back Close
Full Screen / Esc
Printer-friendly Version Interactive Discussion
Discussion
P
a
per
|
D
iscussion
P
a
per
|
Discussion
P
a
per
|
Discuss
ion
P
a
per
|
McLaren, R., Wojtal, P., Majonis, D., McCourt, J., Halla, J. D., and Brook, J.: NO3radical mea-surements in a polluted marine environment: links to ozone formation, Atmos. Chem. Phys., 10, 4187–4206, doi:10.5194/acp-10-4187-2010, 2010.
Osthoff, H. D., Sommariva, R., Baynard, T., Pettersson, A., Williams, E. J., Lerner, B. M., Roberts, J. M., Stark, H., Goldan, P. D., and Kuster, W. C.: Observation of daytime N2O5in the 5
marine boundary layer during New England Air Quality Study – intercontinental transport and chemical transformation 2004, J. Geophys. Res., 111, D23S14, doi:10.1029/2006JD007593, 2006.
Osthoff, H. D., Roberts, J. M., Ravishankara, A. R., Williams, E. J., Lerner, B. M., Som-mariva, R., Bates, T. S., Coffman, D., Quinn, P. K., Dibb, J. E., Stark, H., Burkholder, J. B., 10
Talukdar, R. K., Meagher, J., Fehsenfeld, F. C., and Brown, S. S.: High levels of nit-ryl chloride in the polluted subtropical marine boundary layer, Nat. Geosci., 1, 324–328, doi:10.1038/ngeo177, 2008.
Platt, U., Perner, D., Winer, A. M., Harris, G. W., and Pitts Jr., J. N.: Detection of NO3 in the polluted troposphere by differential optical absorption, Geophys. Res. Lett., 7, 89–92, 15
doi:10.1029/GL007i001p00089, 1980.
Riemer, N., Vogel, H., Vogel, B., Schell, B., Ackermann, I., Kessler, C., and Hass, H.: Im-pact of the heterogeneous hydrolysis of N2O5 on chemistry and nitrate aerosol forma-tion in the lower troposphere under photosmog condiforma-tions, J. Geophys. Res., 108, 4144, doi:10.1029/2002JD002436, 2003.
20
Roberts, J. M., Veres, P., Warneke, C., Neuman, J. A., Washenfelder, R. A., Brown, S. S., Baasandorj, M., Burkholder, J. B., Burling, I. R., Johnson, T. J., Yokelson, R. J., and de Gouw, J.: Measurement of HONO, HNCO, and other inorganic acids by negative-ion proton-transfer chemical-ionization mass spectrometry (NI-PT-CIMS): application to biomass burning emissions, Atmos. Meas. Tech., 3, 981–990, doi:10.5194/amt-3-981-2010, 2010. 25
Simon, H., Kimura, Y., McGaughey, G., Allen, D. T., Brown, S. S., Osthoff, H. D., Roberts, J. M., Byun, D., and Lee, D.: Modeling the impact of ClNO2 on ozone formation in the Houston area, J. Geophys. Res., 114, D00F03, doi:10.1029/2008jd010732, 2009.
Slusher, D. L., Huey, L. G., Tanner, D. J., Flocke, F. M., and Roberts, J. M.: A thermal dissociation-chemical ionization mass spectrometry (TD-CIMS) technique for the simulta-30
AMTD
6, 7473–7504, 2013Chemical interference or a real
atmospheric phenomenon?
X. Wang et al.
Title Page
Abstract Introduction
Conclusions References
Tables Figures
◭ ◮
◭ ◮
Back Close
Full Screen / Esc
Printer-friendly Version Interactive Discussion
Discussion
P
a
per
|
D
iscussion
P
a
per
|
Discussion
P
a
per
|
Discuss
ion
P
a
per
|
Thornton, J. and Abbatt, J.: N2O5 reaction on submicron sea salt aerosol: Kinetics, prod-ucts, and the effect of surface active organics, J. Phys. Chem. A, 109, 10004–10012, doi:10.1021/jp054183t, 2005.
Thornton, J., Braban, C., and Abbatt, J.: N2O5hydrolysis on sub-micron organic aerosols: the effect of relative humidity, particle phase, and particle size, Phys. Chem. Chem. Phys., 5, 5
4593–4603, doi:10.1039/B307498F, 2003.
Thornton, J., Kercher, J., Riedel, T., Wagner, N., Cozic, J., Holloway, J., Dubé, W., Wolfe, G., Quinn, P., and Middlebrook, A.: A large atomic chlorine source inferred from mid-continental reactive nitrogen chemistry, Nature, 464, 271–274, doi:10.1038/nature08905, 2010.
Venables, D. S., Gherman, T., Orphal, J., Wenger, J. C., and Ruth, A. A.: High sensitivity 10
in situ monitoring of NO3 in an atmospheric simulation chamber using incoherent broad-band cavity-enhanced absorption spectroscopy, Environ. Sci. Technol., 40, 6758–6763, doi:10.1021/es061076j, 2006.
Veres, P., Roberts, J. M., Warneke, C., Welsh-Bon, D., Zahniser, M., Herndon, S., Fall, R., and de Gouw, J.: Development of negative-ion proton-transfer chemical-ionization mass spec-15
trometry (NI-PT-CIMS) for the measurement of gas-phase organic acids in the atmosphere, Int. J. Mass. Spectrom., 274, 48–55, doi:10.1016/j.ijms.2008.04.032, 2008.
Wang, T., Wei, X. L., Ding, A. J., Poon, C. N., Lam, K. S., Li, Y. S., Chan, L. Y., and Anson, M.: Increasing surface ozone concentrations in the background atmosphere of Southern China, 1994–2007, Atmos. Chem. Phys., 9, 6217–6227, doi:10.5194/acp-9-6217-2009, 2009. 20
Wood, E., Wooldridge, P., Freese, J., Albrecht, T., and Cohen, R.: Prototype for in situ detection of atmospheric NO3 and N2O5 via laser-induced fluorescence, Environ. Sci. Technol., 37, 5732–5738, doi:10.1021/es034507w, 2003.
Wood, E. C., Bertram, T. H., Wooldridge, P. J., and Cohen, R. C.: Measurements of N2O5, NO2, and O3east of the San Francisco Bay, Atmos. Chem. Phys., 5, 483–491, doi:10.5194/acp-5-25
483-2005, 2005.
Xu, Z., Wang, T., Xue, L. K., Louie, P. K. K., Luk, C. W. Y., Gao, J., Wang, S. L., Chai, F. H., and Wang, W. X.: Evaluating the uncertainties of thermal catalytic conversion in measuring atmospheric nitrogen dioxide at four differently polluted sites in China, Atmos. Environ., 76, 221–226, doi:10.1016/j.atmosenv.2012.09.043, 2013.
30
AMTD
6, 7473–7504, 2013Chemical interference or a real
atmospheric phenomenon?
X. Wang et al.
Title Page
Abstract Introduction
Conclusions References
Tables Figures
◭ ◮
◭ ◮
Back Close
Full Screen / Esc
Printer-friendly Version Interactive Discussion
Discussion
P
a
per
|
D
iscussion
P
a
per
|
Discussion
P
a
per
|
Discuss
ion
P
a
per
|
Zheng, J., Zhang, R., Fortner, E. C., Volkamer, R. M., Molina, L., Aiken, A. C., Jimenez, J. L., Gaeggeler, K., Dommen, J., Dusanter, S., Stevens, P. S., and Tie, X.: Measurements of HNO3 and N2O5 using ion drift-chemical ionization mass spectrometry during the MILAGRO/MCMA-2006 campaign, Atmos. Chem. Phys., 8, 6823–6838, doi:10.5194/acp-8-6823-2008, 2008.
AMTD
6, 7473–7504, 2013Chemical interference or a real
atmospheric phenomenon?
X. Wang et al.
Title Page Abstract Introduction Conclusions References Tables Figures ◭ ◮ ◭ ◮ Back Close
Full Screen / Esc
Printer-friendly Version Interactive Discussion Discussion P a per | D iscussion P a per | Discussion P a per | Discuss ion P a per |
Table 1.Ion-molecule reactions with product of NO−3 and the rate constants.
Reaction Rate constant (molecule−1
cm3s−1
)
Comments Reference
I−+HNO
3→NO−3+HI <5×10
−11 Fehsenfeld et al. (1975)
No reaction Huey et al. (1995) I−+ClONO
2→NO−3+ICl 9×10− 10
±40 % Huey et al. (1995) I−+BrONO
2→NO−3+IBr Unknown Hanson et al. (1996)
I−+HO
2NO2→NO−3+HIO Unknown Zhang et al. (1997)
CO−
3+HNO3→NO−3+products 8×10− 10
Fehsenfeld et al. (1975) CO−
3+NO2→NO−3+CO2 2×10− 10
±50 % Ikezoe and Viggiano (1987) CO−
4+NO→NO
−
3+CO2 4.8×10− 11
±30 % Ikezoe and Viggiano (1987) C2H2N−+HNO
3→NO−3+CH3CN 1.4×10−
9 297 K Ikezoe and Viggiano (1987)
C2H3O−
2+HNO3→NO−3+C2H4O2 Unknown Roberts et al. (2010)
Cl−+HNO
3→NO−3+HCl 1.6×10
−9
±40 % Ikezoe and Viggiano (1987) NO−
2+HNO3→NO−3+HONO 1.6×10− 9
±40 % Ikezoe and Viggiano (1987)
NO−
2+NO2→NO−3+NO <2×10− 13
Ikezoe and Viggiano (1987) NO−
2+N2O→NO3−+N2 <1×10− 12
Ikezoe and Viggiano (1987) NO−
2+O3→NO−3+O2 1.2×10− 10
±40 % Ikezoe and Viggiano (1987) O−
3+NO2→NO−3+O2 2.8×10− 10
AMTD
6, 7473–7504, 2013Chemical interference or a real
atmospheric phenomenon?
X. Wang et al.
Title Page
Abstract Introduction
Conclusions References
Tables Figures
◭ ◮
◭ ◮
Back Close
Full Screen / Esc
Printer-friendly Version Interactive Discussion
Discussion
P
a
per
|
D
iscussion
P
a
per
|
Discussion
P
a
per
|
Discuss
ion
P
a
per
|
Table 2.Summary of the interference tests for the TD-CIMS.
Test Ambient conditions Standard addition∗ CIMS response NOy O3 T RH ∆PAN ∆HNO3 ∆N2O5 ∆S62/∆S59 (ppb) (ppb) (◦) (%) (ppb) (ppb) (ppt) (cps/cps)
1 3.5 69 25 83 6.3 0 75 0.014
2 4.8 71 25 87 5.8 0 42 0.009
3 4.5 60 23 83 5.9 0 69 0.014
4 14.0 35 22 69 5.6 0 62 0.013
5 7.2 70 24 81 0 1.4 1 n.a.
6 6.2 76 24 64 0 9.1 1 n.a.
7 15.2 38 22 69 0 8.9 2 n.a.
8 12.8 41 21 68 5.3 8.9 62 n.a.
∗The concentrations of PAN and HNO
AMTD
6, 7473–7504, 2013Chemical interference or a real
atmospheric phenomenon?
X. Wang et al.
Title Page
Abstract Introduction
Conclusions References
Tables Figures
◭ ◮
◭ ◮
Back Close
Full Screen / Esc
Printer-friendly Version Interactive Discussion
Discussion
P
a
per
|
D
iscussion
P
a
per
|
Discussion
P
a
per
|
Discuss
ion
P
a
per
|
“ ” “ ”
“ ” “ ”
“ ” “ ”
“ ” “ ”
“ ” “ ”
AMTD
6, 7473–7504, 2013Chemical interference or a real
atmospheric phenomenon?
X. Wang et al.
Title Page
Abstract Introduction
Conclusions References
Tables Figures
◭ ◮
◭ ◮
Back Close
Full Screen / Esc
Printer-friendly Version Interactive Discussion
Discussion
P
a
per
|
D
iscussion
P
a
per
|
Discussion
P
a
per
|
Discuss
ion
P
a
per
|
Fig. 4.Time series of N2O5+NO3, NO3/N2O5ratio, trace gases and meteorological parameters
for six pollution episodes on(a)23 October,(b)24 October,(c)19 November,(d)22 November,
AMTD
6, 7473–7504, 2013Chemical interference or a real
atmospheric phenomenon?
X. Wang et al.
Title Page
Abstract Introduction
Conclusions References
Tables Figures
◭ ◮
◭ ◮
Back Close
Full Screen / Esc
Printer-friendly Version Interactive Discussion
Discussion
P
a
per
|
D
iscussion
P
a
per
|
Discussion
P
a
per
|
Discuss
ion
P
a
per
|
Fig. 5.Raw NO−
3(62 amu) signal with hourly automatic background detection by adding excess
AMTD
6, 7473–7504, 2013Chemical interference or a real
atmospheric phenomenon?
X. Wang et al.
Title Page
Abstract Introduction
Conclusions References
Tables Figures
◭ ◮
◭ ◮
Back Close
Full Screen / Esc
Printer-friendly Version Interactive Discussion
Discussion
P
a
per
|
D
iscussion
P
a
per
|
Discussion
P
a
per
|
Discuss
ion
P
a
per
|
Fig. 6.Changes of raw signals of CH3C(O)O-, NO−3, C3H7C(O)O-, I(H2O)−detected by I−
AMTD
6, 7473–7504, 2013Chemical interference or a real
atmospheric phenomenon?
X. Wang et al.
Title Page
Abstract Introduction
Conclusions References
Tables Figures
◭ ◮
◭ ◮
Back Close
Full Screen / Esc
Printer-friendly Version Interactive Discussion
Discussion
P
a
per
|
D
iscussion
P
a
per
|
Discussion
P
a
per
|
Discuss
ion
P
a
per
|
Fig. 7. Interference of NO2 to equivalent NO−
3 concentration under different levels of PAN.
AMTD
6, 7473–7504, 2013Chemical interference or a real
atmospheric phenomenon?
X. Wang et al.
Title Page
Abstract Introduction
Conclusions References
Tables Figures
◭ ◮
◭ ◮
Back Close
Full Screen / Esc
Printer-friendly Version Interactive Discussion
Discussion
P
a
per
|
D
iscussion
P
a
per
|
Discussion
P
a
per
|
Discuss
ion
P
a
per
|
Fig. 8.Time series of corrected and uncorrected N2O5+NO3, PAN, NO2and NO on 23 October
AMTD
6, 7473–7504, 2013Chemical interference or a real
atmospheric phenomenon?
X. Wang et al.
Title Page
Abstract Introduction
Conclusions References
Tables Figures
◭ ◮
◭ ◮
Back Close
Full Screen / Esc
Printer-friendly Version Interactive Discussion
Discussion
P
a
per
|
D
iscussion
P
a
per
|
Discussion
P
a
per
|
Discuss
ion
P
a
per
|
Fig. 9.Time series of of N2O5 from the I(N2O5)− ion, solar radiation and relative humidity in
AMTD
6, 7473–7504, 2013Chemical interference or a real
atmospheric phenomenon?
X. Wang et al.
Title Page
Abstract Introduction
Conclusions References
Tables Figures
◭ ◮
◭ ◮
Back Close
Full Screen / Esc
Printer-friendly Version Interactive Discussion
Discussion
P
a
per
|
D
iscussion
P
a
per
|
Discussion
P
a
per
|
Discuss
ion
P
a
per
|
Fig. 10.A case showing concurrent increase of ClNO2 and N2O5 at daytime during a