Mergers and Acquisitions
Pernod Ricard and Beam
Author:
David Martins Boquinhas
Hand-in date:
16
thSeptember 2013
Supervisor:
Peter Tsvetkov
Programme:
Master of Science in Finance
Dissertation submitted in partial fulfillment of requirements for the degree of MSc in Finance at the Universidade Católica Portuguesa
David Boquinhas Page 2
Abstract
The spirits industry is consolidating with more than 40 M&A deals in 14 years. Organic growth is not the only priority major players have. In order to maintain their position on top, big producers and marketers of spirits have long been following a regular strategy of acquisitions and divestitures that allows them to create value for shareholder. In this study, an overview of a potential deal between Pernod Ricard S.A. and Beam Inc. is conducted by taking into consideration this deal’s place within the academic literature on Valuation and M&A, this industry and companies’ characteristics and value drivers, and how these are reflected in the assessment of value creation from the deal. According to the study’s conclusion, Pernod Ricard and Beam could create value for its shareholders by merging in a debt financing deal that would involve Pernod paying a 19% premium over last year average share price of Beam, which in turn would generate net synergies corresponding to around 8% of Pernod current enterprise value. The study concludes with further insights on how this deal could generate more value, and how different conditions could affect the viability of the merger.
David Boquinhas Page 3
Acknowledgements
The author would like to express his sincere gratitude to his thesis advisor, Peter Tsvetkov, for the constant availability, confidence and helpful feedback. To his work colleagues, friends and family for the support, contribution and motivation.
David Boquinhas Page 4
Table of Contents
1. Introduction ... 6 2.Literature Review ... 7 2.1 Valuation Overview ... 7 2.1.1 Valuation Purposes... 7 2.1.2 Valuation Models ... 82.1.2.1 Cash Flow Discounting ... 10
2.1.2.1.1 DDM and Free Cash Flow Approach – Equity and Firm Specific ... 11
2.1.2.1.2 Free Cash Flow Inputs ... 12
2.1.2.2Relative Valuation ... 18
2.2 M&A Overview ... 20
2.2.1 Types of Deals ... 20
2.2.2 History and Patterns ... 21
2.2.3 Synergies and Value Creation ... 22
2.2.4 Performance Fundamentals of M&A ... 23
2.2.5 Cross Border M&A. New wave? More value? ... 24
3. Companies and Industry ... 26
3.1 Alcoholic Beverage Industry ... 26
3.2 Pernod Ricard SA ... 31
3.3 BEAM Inc. ... 38
4. Valuations ... 44
4.1 BEAM Valuation ... 44
4.1.1 Key Considerations and Value Drivers ... 44
4.1.2 Results and Final Considerations ... 51
4.2 Pernod Ricard Valuation ... 53
4.2.1 Key Considerations and Value Drivers ... 53
4.2.2 Results and Final Considerations ... 59
5. The Merger ... 61
5.1 The Merged Entity ... 61
5.1.1 Consolidation and Cross Border Issues ... 61
5.1.2 Synergies Analysis... 64
David Boquinhas Page 5
5.2 Aspects of the Deal ... 72
5.2.1 Deal’s Rationale ... 72
5.2.2 Characteristics of the merger ... 73
5.2.3 Final Considerations ... 74
6. Conclusion ... 76
7. Appendixes ... 77
David Boquinhas Page 6
1. Introduction
The following dissertation proposes a merger between Pernod Ricard S.A. based in France and Beam Inc. headquartered in the United States, both major players on the worldwide spirits industry. The purpose underlying such proposal is to analyze a concrete case where an M&A deal would be possible and to closely study the major steps associated with an operation like this.
The first section of this paper introduces the topics of Valuations and M&A by offering a literature review in which the classical studies of these two topics by academics is evaluated as well as state of the art approaches which have been gaining territory within the finance community. Some of the main characteristics of Valuations and M&A are then critically reviewed and the contextualization of the proposed deal within literature is presented.
In the subsequent section, a thoroughly analysis on the current, as well as historically, state of the spirits industry is commenced to afterward fit both of the companies in the context of its industry and economic environment. Also, both companies are comprehensively studied in order to assess what their value drivers are and how their characteristics can impact each company, as well as, ultimately, both firms together.
The valuations chapter performs the valuation of each standalone company in order to as realistically as possible model the key value drivers and opportunities present in each firm, to arrive at a fair value of their equity. For that, extensive Valuation methodology was applied and compared to real market estimates as to check on whether the models were being realistically capturing the public information and estimates made.
Finally, in the last section, the merger between Pernod Ricard and Beam is valued, relying heavily on the inputs given in previous chapters. An M&A operation can be a complex deal and distortions to what the deal output may be are common. Therefore, a careful analysis to what these companies have to offer to each other was completed, and an in depth analysis on the strategic and operational side of the deal was performed.
David Boquinhas Page 7
2. Literature Review
The following literature review offers the possibility to appraise how in recent years the study of M&A has been conducted and how revealing it has been. It is not as obvious as it may seem that two similar companies merging together will form a better, bigger company. Many times they will not. It seems to be about measuring the value of the firms separately, the value of the firms together, and as a consequence the added value by the deal that one can assess the impact of an M&A transaction.
The first section will perform an overview on some of the most influential literature on valuation approaches, as well as state of the art studies that have been trying to improve standard valuation models. Throughout the second section it will be offered the opportunity to review some of the main characteristics of M&A deals in literature: how they are classified, what is their focus, their contribution to the shareholders, their strategy, motives, history and trends that most contribute for how M&A deals are conducted and evaluated in recent years.
2.1 Valuation Overview
2.1.1 Valuation Purposes
Along with some other subjects in Finance literature, valuation has been a “hot topic” for the past decades. Research on valuation is extremely vast; however, some methodologies have prevailed in detriment of others, although not in a consensual manner. For instance, according to Kaplan & Ruback (1996), investment bankers and dealmakers typically price firms and transactions using multiples of current earnings or cash flow for comparable companies or transactions, while financial academics usually estimate market values of companies and transactions by recurring to the discount value of the expected future cash flows.
There are a multitude of reasons why there is not a single and unique path to value firms and transactions, as it could be expected since valuation plays such an important and common role in Finance. It should be noticed that valuation is not an exact science with an exact purpose and that is why academics and professionals differ in their valuation approaches. Valuation can be performed through different methods, with different assumptions, requirements, inputs and outputs having nonetheless one final and common goal, which can then serve different purposes and reasons. That common goal is to measure value and identify sources of economic value creation and destruction within a firm and/or transaction (Fernandez, 2007). The identification and measure of the value drivers can then supply a variety of functions
David Boquinhas Page 8
depending on who is performing the valuation and which routes and assumptions is using to get there. In this sense, it is natural that some methods can be simple, quick and straightforward while others can be quite complex (Damodaran, 2002).
Among the many purposes served in different contexts by valuation methods, some of them are naturally more relevant than others. In its overview of Valuation studies, Fernandez (2007) described, from the wide range of purposes, the main ones as follows: (1) Public offerings (“The valuation is used to justify the price at which the shares are offered to the public”); (2) Valuation of listed companies (“The valuation is used to compare the value obtained with the share’s price on the stock market and to decide whether to sell, buy or hold shares”); (3) Buying and selling operations (For the buyer and for the seller, the valuation will indicate them the highest price he should pay and the lowest price he should sell, respectively); (4) Compensation schemes based on value creation (“The valuation of a company or business unit is fundamental for quantifying the value creation attributable to the executives being assessed”); (5) Identification of value drivers (“The valuation of a company or business unit is fundamental for identifying and stratifying the main value drivers”); and (6) Strategic decisions on company’s continued existence (“The valuation of a company or business unit is a prior step in the decision to continue in the business, sell, merge, milk, grow or buy other companies”). Valuation in the context of M&A will naturally serve several of the purposes illustrated by Fernandez, and as previously mentioned; there are several methods and approaches to perform valuations that have been the subject of debate in the literature.
2.1.2 Valuation Models
Authors like Damodaran (2002) and Fernandez (2007) used similar classifications to wrap-up the many approaches, described in the literature and used by professionals, based on their basic methodologies. The authors classify the models, in a summarized way, as follows:
Main Valuation Methods
Balance Sheet E.g., Book Value, Liquidation Value, Substantial Value
Relative Valuation (Multiples) E.g., PER, EV/EBITDA, EV/Sales, PBV
Cash Flow Discounting E.g., FCFE, FCFF, DDM, Capital Cash Flow, APV
Value Creation E.g., EVA, Economic Profit, Cash Value Added
Options E.g., Black and Scholes, Investment Options Table 1: Main Valuation Methods (source: adapted from Fernandez, 2007)
Notice that these classifications are useful to organize and to be a starting point in studying the models used by financiers, however, many authors have different perspectives for each of the
David Boquinhas Page 9
models presented, demonstrating how rich the variety of options one can have when performing valuation depending on his needs.
Young et al. (1999) argues that one of the reasons for such an extended variety of approaches in valuation is that different models make different features of the valuation clearer at the expense of diminishing others, and for this reason, this author offers a way to cut through this complexity. In his study, Young affirms that “virtually every popular valuation approach is simply a different way of expressing the same underlying model”. Starting off by considering four of the main models (Dividend Discount Model, Discounted Cash Flow, Economic Value Added and Dynamic ROE), the author of “All roads lead to Rome”, studies the possibility of re-expressing one model in terms of another in search for the desired common valuation approach. His main conclusion seems to be the recognition of similarities among valuation approaches, and that there is a trade-off when using different models in the sense that all of them offer a partial picture of the valuation.
In the same line of thought as Young et al. (1999), for instance Oded & Michel (2007), concluded that the significant inconsistencies, that occur in valuation literature about discounted cash flows approaches such as APV, FCFE, FCFF and Capital Cash Flows, lie on the assumptions made about debt rebalancing and when the debt rebalancing policy is applied consistently, all valuation methods produce equivalent results.
There seems to be a well defined place for Discounted Cash Flow variants and approaches in Finance literature. The notion that the value of a firm does not lies entirely in its balance sheet, that it is not static and therefore takes into account the company’s possible future evolution, or money’s time value, contrasts the methods based on Cash Flow discounting with those based on Balance Sheet (Fernandez, 2007). Similarly, in its 2001 study “EVA and Cash Value added do not measure shareholder value creation”, Fernandez argues that both Income Statement and Balance Sheet are historical data and for that reason, it is impossible for accounting-based measures, such as EVA or cash value added, to measure value creation, which in turn is determined by the changes in expectations regarding the growth of the firm’s cash flows and also by the changes in the firm’s risk. This view is largely shared and accepted by the Finance community that considers growth and return on invested capital (thus implying the perceived riskiness of the firm) to be the drivers of value (Koller, Goedhart, & Wessels, 2010). Options based models however, are not the mainstream approaches used in valuation due to its nature. These methods are mostly applied to value companies or investments whose underlying assets are quickly valued by capital markets such as commodities that require a
David Boquinhas Page 10
totally different risk treatment from the cash flow restatements (such methods are notably used to value oil reserves for example), (Froot & Kester, 1995).
As stated before, literature on valuation is extremely complete and continues on lengthening. One of the conclusions of this valuation overview is that there is no unique conclusion regarding the way one can conduct a valuation, except, that there is no exclusive method or path in valuation. Literature seems to be consistent with the idea that one should adapt its valuation methods to his constraints and needs. With this in mind, even if the Cash Flow Discounting method prevails to be the mainstream approach to be studied by scholars, if there is one thing authors would agree on is that when performing an evaluation one should consider the type of company, transaction, the industry he is looking to value, the information available, and the purpose he wants to emphasize. For this reason, the literature review will highlight from this paragraph on, some of the Cash Flow Discounting variants and multiples analysis more relevant in a context of M&A in the Consumer Staples sector.
2.1.2.1 Cash Flow Discounting
Discounted cash flow (DCF) analysis, the widely recognized methodology for valuing companies, assets or projects has its origin in the notion of time value of money. All discounted cash flow methods involve forecasting future cash flows and then discounting them to their present value at a rate that reflects their riskiness, that is to say, the investors’ opportunity cost of taking that investment (Luehrman, 2007). However, DCF itself can be split into a variety of different approaches having all of them the same fundamental concept. The most common DCF approach in the literature is the Weighted Average Cost of Capital (WACC) approach in which the expected future cash flows are discounted at a risk adjusted discount rate (cost of capital) to compute the present value (PV) of that stream of cash-flows. For equity valuation methods, the cost of capital will purely be the cost of equity which is also employed when using the Adjusted Present Value (APV) approach, first investigated by Modigliani & Miller (1963), presented in its contemporary appearance by Myers (1974), and argued to be the best valuation tool in today’s technological era by Luehrman (1997). APV mechanics starts by considering the company as unlevered, when discounting the future cash flows, and then compute the PV of financial maneuvers separately and add both values. There has been a rising debate on the literature about which tool is better for valuing operations, the WACC based DCF or the APV, which will be discussed further on.
David Boquinhas Page 11
2.1.2.1.1 DDM and Free Cash Flow Approach – Equity and Firm specific
The mainstream DCF model can either be applied to value a business as a whole (Free Cash Flow to the Firm - FCFF) or to value the firm to the shareholders (Free Cash Flow to Equity - FCFE), which is to say the cash available to shareholders after funding capital requirements, working capital needs, but also, debt financing requirements (Stowe, Robinson, Pinto, & McLeavey, 2007).
This second approach has, according to the literature, its roots in the work of Williams (1938) and Durand (1957) who found evidence of a close correlation between the stock price and the present value of the dividend stream. This correlation is the basis of another method frequently referred by Finance scholars, the Dividend Discount Model (DDM). As Stowe et al. put it in its 2007 CFA Institute scholar book “Equity Asset Valuation”, “DDM is the simplest and oldest present value approach to valuing stock”. Although, one of the most popular methods used in valuation, a significant number of authors have argued and provided evidence against the link between prices and dividends. Shiller (1981) has demonstrated how stock price volatility clearly surpasses that of dividends while Fama & French (1988) have similarly provided evidence that dividend yields1 fluctuate, on average, a lot more than dividends. Furthermore, in cash flow discounting approaches as the ones just mentioned - FCFF, FCFE and DDM - the first step required is to estimate what the assets will generate in the future, which involves creating expectations about return on invested capital (ROIC), growth rate (g) and growth period. Moreover, in the DDM method, assumptions must be made about growth rates of earnings and pay-out ratios in order to determine the long term growth rate (g) of dividends. The pay-out ratio is assumed to be stable (Gordon, 1962), but as Damodaran (1994) points out “The focus on dividends in this model can lead to skewed estimates of value for firms that are not paying out what they can afford in dividends. In particular, we will under estimate the value of firms that accumulate cash and pay out too little in dividends.”. This assessment can be of special importance for growing companies that usually pay lower dividends relative to earnings than mature ones, because reinvestment needs are higher for a startup. Even multi-stage growth models like that of Fuller & Hsia (1984) engage on the same risk as they also assume a constant pay-out ratio.
The common alternative to DDM will be the FCFE that as Vernimmen et al. (2005) classified, is a direct method, through which one can directly value the equity capital, as opposed to the
1 𝐷𝑖𝑣𝑖𝑑𝑒𝑛𝑑𝑠 𝑆𝑡𝑜𝑐𝑘 𝑃𝑟𝑖𝑐𝑒𝑠
David Boquinhas Page 12
FCFF in which first, it is calculated the value of the firm as a whole (the enterprise value, EV), and then subtract the value of net debt.
Given this, the Free Cash Flow Valuation inputs, including both FCFF and FCFE, will continue to be further analyzed in this section as literature coverage of the DDM method will not be the focus of the rest of the review.
2.1.2.1.2 Free Cash Flow Inputs
As already mentioned before, the Free Cash Flow models estimate the value of the firm, or equity of the firm, as the present value of future Free Cash Flows discounted at a rate that reflect their cost (cost of capital for FCFF (WACC), or just the cost of equity (KE) for FCFE since
this method is only measuring how much cash a firm can afford to return to its stockholders) (Stowe, Robinson, Pinto, & McLeavey, 2007):
Firm Value (1+WACC )FCFFt t
∞ 𝑡=1
Equity Value (1+𝐾FCFEt 𝐸)t
∞ 𝑡=1
Free cash flows, period of estimation and Terminal Value
The definition of FCFF is generally regarded as the cash flow available to the company’s suppliers of capital after all operating expenses (including taxes) have been paid and necessary investments in working capital (e.g., inventory) and fixed capital (e.g., equipment) have been made. The company’s suppliers of capital include common stockholders, bondholders and preferred stockholders (Stowe, Robinson, Pinto, & McLeavey, 2007). FCFE is, as already mentioned, the cash flow available to the company’s shareholders after funding capital requirements, working capital needs, but also, debt interest and principal payments have been made (but, plus receipts from debtholders) (Stowe, Robinson, Pinto & McLeavey, 2007). FCFF and FCFE are advantageous relative to other earnings measures such as net income, EBIT or EBITDA, in the sense that these measures can either double-count or omit cash flows in some way.
Given the definition of FCFs, a consensual topic in the literature, one must then define a period of estimation which, on the other hand, is not a subject that gathers agreement amongst scholars and practitioners. The formulas above (for Firm Value and Equity Value) are depicted as if the company would generate cash-flows for an indefinite time, which is one of the assumptions of the model, however it would not be possible to discount infinite cash-flows.
David Boquinhas Page 13
Fernandez (2007) clearly illustrates that there should exist two distinct periods of time within the DCF method: the explicit forecast horizon, where cash-flows are distinctively estimated and the post-horizon period, or Terminal Value, where cash-flows are assumed to grow at a steady rate in perpetuity (Gordon Model). The fact that the explicit period is usually between 5 to 15 years, commonly being 10 years (Jennergren, 2008), contributes for the Terminal Value to generally represent well over 75% of the market value estimate (Young et al. 1999). Conversely, the assumption of constant growth in perpetuity, widely accepted in the computation of the Terminal Value, generated a long debate in literature regarding the verisimilitude of such assumption. Authors like Ohlson & Zhan (1999) analyzed how a horizon date affected valuation, and concluded that errors arising because of the horizon tend to vanish as the horizon approaches infinity and, in fact, every increase in the horizon reduces the error.
Cost of Capital
In order to compute the weighted average of the after-tax costs of different sources of capital (WACC) one needs estimates for the relative amount of Debt and Equity in the capital structure (Luehrman, 1997):
WACC (WE × KE) + [(WD × KD × (1 – Tax rate)]
WE and WD stand for weight of market value of equity and weight of market value of debt in
terms of total capital in market values, respectively. It is considered more appropriate to use market values since the WACC is a forward-looking measure that reflects the expectations of investors and how a company can raise new capital (Damodaran, 2012).
The cost of Debt (KD) is observable in the market, and for the computation of cost of capital
one must take into account the tax deductibility of Debt (Damodaran, 2002). Nonetheless, a company can have all sorts of debt obligations making it difficult to get to a precise rate, thus Damodaran (2012) suggests that the cost of debt can be determined by adding to the risk-free rate, a default spread that reflects the default risk of the company.
Now, regarding the cost of Equity (KE), or also known as the required rate of return on
common stock, literature has long been showing a different enthusiasm about this discount rate. The required rate of return for investors in the equity market has been enlightened by the Capital Asset Pricing Model (CAPM) which was first introduced by Sharpe (1964), Lintner (1965), Mossin (1966), and Treynor (1965). It is a one period model which affirms that in
David Boquinhas Page 14
equilibrium, the expected return of any asset or portfolio varies linearly with its covariance with the market portfolio.
CAPM Model 𝐸 𝑟𝑖 = 𝑟𝑓+ 𝛽𝑖 𝐸 𝑟𝑚 − 𝑟𝑓 𝛽𝑖 =𝐶𝑜𝑣 (𝑟𝑉𝑎𝑟 (𝑟𝑖,𝑟𝑚)
𝑚)
From the above regression, it is assumed that the risk premium [𝐸 𝑟𝑚 − 𝑟𝑓] of an asset
depends on the betas, which represent an individual asset’s correlation with a market portfolio. From an investor’s perspective, if the market was to be in equilibrium, he could in fact expect that the return he would get from a stock would only have the market risk as a source, the systematic risk. In this situation, he would be able to diversify the specific stock risk away. CAPM is in fact a very popular model to determine a theoretically appropriate rate of return of an asset, due to its simplicity. But aligned to this, it is also a much criticized model. Roll (1977) for instance has stated that the market portfolio in which the excess asset returns are regressed is only a proxy of the true market; therefore it might seem to be mean-variance efficient when the true market is not. Also the proxy may not be efficient, leading to an inconsistent 𝛽 estimate.
Other authors have grant valuation literature with alternatives to the CAPM. Fama-French (1992) Three-Factor model, for instance, provides an alternative to the CAPM, and tries to explain the CAPM anomalies. In their model, apart from the excess market return, two additional factors are included in the effort of explaining an asset’s excess return. These are the return on a portfolio of small stocks minus the return on a portfolio of large stocks (SMB), and the return on a portfolio of stocks with high book to market values minus the return on a portfolio of stocks with low book to market values (HML) which are important for describing the returns on growth-stock funds.
Three-Factor Model 𝐸 𝑟𝑖 − 𝑟𝑓 =+ 𝛽1𝑖 𝐸 𝑟𝑚 − 𝑟𝑓 + 𝛽2𝑖𝑆𝑀𝐵 + 𝛽3𝑖𝐻𝑀𝐿 + 𝑒𝑖
The debate about the computation of the equity discount rate has still many pages to go. However, it seems that CAPM continues to be the most popular asset pricing model among the Finance community with several studies proving the effectiveness of CAPM against the Fama-French Model. One of those studies was led by Kaplan & Ruback (1996) who examined 51 highly leveraged transactions and looked for the relationship of the implied risk premia not only to systematic risk measures, but also to firm size and book-to-market ratios, concluding that the implied risk premia were not significantly related to firm size or pre-transaction book-to-market ratios, but were positively related to firm and industry betas.
David Boquinhas Page 15
Regarding the estimation of Beta for the CAPM, a relative measure of systematic risk (Koller, Goedhart & Wessels, 2010), one must understand its drawbacks and criticisms. The first drawback is that there is no entire market portfolio of all equities available to easily assess beta. For this reason, practitioners use a proxy of the market, usually a broad stock market index such as the S&P 500. Moreover, the estimation of beta can follow a number of methods illustrated in the literature by several authors:
Raw Beta – probably the most common, and suggested by several authors such as Damodaran (2012), it is computed by running a simple regression with the company’s monthly excess stock returns as the dependent variable and the monthly excess returns in the market as the independent variable (Hitchner, 2006);
Unlevered (𝛽𝑈) and Levered Beta (𝛽𝐿) – 𝛽𝐿 = 𝛽𝑈 × [1 + (1 - 𝑇𝑐)( 𝐷
2
𝐸)] – knowing that the
unlevered beta removes a company’s financing decision from the beta calculation (Hitchner, 2006);
Adjusted Betas – suggested by Vasicek (1973), the adjusted beta is a weighted average of the company’s regression beta and its peer group beta, based on the theory that over time a company’s beta tends toward its industry’s average beta. The motivation behind this calculation is to make a forecast of the true beta in the future which can be used to estimate the expected return.
Industry Betas – the “Full-Information” (FIB) approach, first suggested by Ehrhardt & Bhagwat (1991), estimates industry betas by using a cross-sectional regression that includes from all companies, the betas and their percentage of sales in all of the industries. Ehrhardt & Bhagwat (1991) performed the regression using OLS, so their industry betas were equally weighted across companies. Kaplan & Peterson (1998) however, obtained market capitalization-weighted industry betas by developing a capitalization-weighted regression technique. The FIB approach according to Kaplan & Peterson (1998) seems to be gaining more relevance in the literature than Ehrhardt & Bhagwat’s one.
Peer Group Beta – “it takes into consideration the industry betas of all industries in which a company is involved. It is the sales-weighted average of the betas for each industry in which a company has sales.” (Hitchner, 2006).
2
David Boquinhas Page 16
Now, the risk free rate affects both the cost of equity and the cost of debt, but it is normally given little attention in academic research. According to Pratt & Grabowski (2010), the risk-free rate should reflect three components (a real return for lending the funds over the investment period, thus forgoing consumption for which the funds otherwise could be used; expected rate of inflation during the period of the investment; and the risk that the investment’s principal market value will rise or fall during the period to maturity as a function of changes in the general level of interest rates). All three of these economic factors are embedded in the yield to maturity for any given maturity length. Damodaran (2008) classifies an asset as risk-free when its actual return equals the expected return and there is no uncertainty or variance related to its actual return. The author also suggests that the risk-free rate should be consistent with the currency and duration of the cash-flows under analysis. Practitioners frequently use ten-year government bonds, even for companies with higher cash-flow duration, given the lack of liquidity of longer-maturity instruments.
Finally, the risk premium [𝐸 𝑟𝑚 − 𝑟𝑓], last component of the CAPM, quantifies the return of
the market over risk-free assets. Risk premium is commonly computed by recurring to historical averages and forward-looking estimates (Koller, Goedhart & Wessels, 2010). Nevertheless, other methods to estimate the market risk premium include the use of regression analysis to link current market variables (i.e. dividend-to-price ratio) to project the expected market risk premium and, the use of DCF valuation, along with estimates of return on investment and growth, to reverse engineer the market’s cost of capital (Koller, Goedhart & Wessels, 2010). While arguments about the methods to estimate the risk premium are common in academic Finance literature, other arguments concerning the risk premium computation are also present in the literature disregarding the method used. One of the disagreements lies on the fact that analysts often add a premium to account for the country risk in some markets while literature argues that the country risk, like the specific risk, can be diversified away if the investor holds a geographically diversified portfolio (Stulz, 1999). Goedhart & Haden (2003) on the other hand, advocate that this is a subjective matter and that on a short term valuation it may make sense to add a country risk while on a long term analysis its effect would not be relevant.
Numerous studies on the CAPM have been published addressing and modifying the original CAPM. Most recently, Bali et al. (2009) examined the cross-sectional relationship between conditional betas and expected stock returns for a sample period from 1963 to 2004. The authors found that it explained between 2.02 percent and 2.13 percent of the cross-sectional variation in returns. Addition of size and book-to-market ratio increased the R2 values to
David Boquinhas Page 17
between 4.7 percent and 4.87 percent. No matter how negatively this low explanatory power can be viewed by the Finance world, one must take into account that markets are not perfect and a stock’s return cannot be predicted relying 100% on explainable variables. If both CAPM and Three-Factor Model were to work out perfectly, this would mean they would have a zero alpha, the alpha is the stock’s specific risk, therefore what is not explained by the market.
APV vs. WACC
The Adjusted Present Value is an alternative approach to the WACC method in which financial maneuvers, including interest tax shields, costs of financial distress (include direct costs such as lawyers expenses, and indirect costs such as loss of clients and brand damage), subsidies, etc… are separately valued and added to the base-case valued (value of the project as if it were financed entirely with equity) (Luehrman, 1997). This approach is argued to better value a business when its capital structure is complex and financial side effects are not reliably addressed by the automatic WACC method (Koller, Goedhart & Wessels, 2010). The APV method is also advocated to provide a more complete picture and help managers perceive not only the value of an asset but where the value comes from (Damodaran, 2006). The main argument defended by Luehrman (1997) is that the APV is still a DCF methodology and some of the limitations that the WACC approach demonstrates (poorly suited to value projects that are essentially options), are also present in the APV, however some of them are not (“*…+ APV always works when WACC does, and sometimes when WACC doesn’t, because it requires fewer restrictive assumption *…+). In addition, Luehrman (1997) states that the fact that WACC can still be more popular than APV is due to the fact that WACC’s virtue, only one discounting operation, was a great advantage in the days of “calculators and slide rules”, but nowadays it has become irrelevant.
When using APV though new concerns arise: which discount rate to use when discounting interest tax shields for instance? Authors like Myers (1974) defended the use of the cost of debt to discount tax shields, years later however, Miles & Ezzel (1980) and Harris & Pringle (1985) advocated the use of the cost of equity as the discount rate. More recently, Luehrman (1997) assumes that academics do not agree on how risky tax shields are. The author defends that tax shields are as uncertain as principal and interest payments, yet “*…+ there may come a time when you can afford to make your interest payments but can’t use the tax shields *…+”. For this reason, Luehrman (1997) suggest that tax shields are riskier than Debt and should be discounted at a higher rate than Debt, nonetheless, the author fails at quantifying how much higher the discount rate should be.
David Boquinhas Page 18
Despite all different views in the literature regarding the discount rates used to value the PV of financial side effects and the efficiency of using one approach over the other, one argument of the APV advocators seems to gather consensus amidst the academics: “Rather than model the effect of capital structure changes in the weighted average cost of capital, APV explicitly measures and values the cash flow effects of financing separately.” (Koller, Goedhart & Wessels, 2010).
To sum up, cash flow discounting analysis have a variety of alternatives that have drawn the attention of more and more academics due to its relevance in practical Finance. There are many debatable subjects regarding DCF analysis which in turn is fueling scholars to better complement the initial studies carried by academics, and it seems this dynamic literature is here to stay.
2.1.2.2 Relative Valuation
As already stated in the commencement of this overview, there is the idea that cash flow discounting methods are usually applied by academics while in the “real world” analysts typically resort to relative valuation to price securities, transactions or other financial assets. In fact, the use of relative valuation – comparing a firm’s multiples with those of comparable companies (Koller, Goedhart & Wessels, 2010) – is widespread and most equity research reports and valuations are based upon the use of some multiple. The fact this method gathers so much popularity among analysts does not comes as a surprise once one understands the advantages of multiples valuation in regard to other valuation methodologies. Damodaran (2002) enumerates some of the reasons of such a success:
Fewer assumptions are needed, and far quicker than DCF valuation; Simpler to use and to present to clients and investors than DCF; More likely to reliably represent the market’s direction.
Even so, the use of multiples in valuation must be carefully and properly executed. When performing a valuation using multiples one must bear in mind that all companies are different from each other, and that “any analysis is as accurate as the forecasts it relies on”. Koller, Goedhart & Wessels (2010) refer that multiples are often misunderstood and misapplied by overlooking well-known facts. The authors exemplify with the use of the multiple P/E (price-to-earnings) where analysts commonly multiply the industry average P/E by a company’s earnings to obtain a fair price estimate, and thus totally overlooking the fact that companies within an industry can have very different expected growth rates, returns on invested capital, and capital structures. Koller et al. (2010) conclude that a carefully designed multiples analysis can be of
David Boquinhas Page 19
great value, in accordance with Kaplan & Ruback (1996) who recommends using both DCF and multiples approaches in practical valuation where comparable values are available. Kaplan & Ruback (1996) empirical study also contributes to the literature by suggesting that one should use multiples based on EBITDA to make the values estimated with multiples comparable to those estimated using cash-flow discounting.
In order to compare the values of similar firms in the market, Damodaran (2002) standardized values as follows:
Earnings multiples – the value of the firm as a multiple of the operating income or EBITDA for instance;
Book value or Replacement value multiples – the value of the firm as a multiple of the book value of all assets, or as an alternative, the replacement cost of the assets (Tobin’s Q);
Revenue multiples – far less accounting influence, the value of the firm as a multiple of revenues such as sales;
Sector-Specific multiples – the value of the firm as a multiple of some sector-specific characteristic (i.e., number of hits generated by a firm’s website in the Internet sector). Koller et al. (2010) advocate the use of forward-looking multiples to be consistent with the principals of valuation (PV of future cash-flows), the use of Enterprise-Value multiples (EV/EBIT) to avoid price-earnings major flaws (effect of capital structure, the effect of non-operating gains and losses and manipulation via depreciations) and the adjustment of Enterprise-Value multiples because even though EBIT is superior to earnings for multiples calculation purposes, it still needs to be adjusted for non-operating items (excess cash and other non-operating assets, operating leases, employee stock options, pension liabilities). On the other hand, Liu, Nissim & Thomas (2007) support the higher accuracy of earnings multiples over any other multiples based on their empirical analysis.
Although there is no general agreement on which multiples are better fit at providing a reliable relative valuation, literature seems to agree on the role multiples analysis play in valuation – a useful and relatively simple methodology that when cautiously applied can be very consistent and a great ally of the DCF models.
David Boquinhas Page 20
2.2 M&A Overview
Mergers, and acquisitions, of firms have always been a natural strategy used by businesses with the intent to grow, prosper and deliver value for its investors and customers. The concept of creating alliances between similar entities that will result in a stronger entity that benefits all of the intervenient, or, the integration of a smaller entity in a bigger one with that same purpose – to strengthen both entities – is not new, it is in fact ancient and it has been part of every dimension of life. However, this natural concept is nonetheless one of the most important shapers of evolution, with its decisions dictating many times the route development will take. In the global era the world lives nowadays, the mergers and acquisitions (M&A) of businesses has been, and will continue to, be a shaper of the global economy’s future.
Identically to literature on valuation, literature on M&A is immense and some of its topics are far from scholars and analysts’ consensus. The fact that deals like M&A are an inherently way for businesses to expand in an incessantly globalized world, in addition to the foggy assessment of such deals’ outcomes, have provided Finance scholars with many resources to write. To further understand the role played by M&A transactions a look into its main characteristics and history shall be conducted.
2.2.1 Types of Deals
Literature distinguishes Mergers and Acquisitions transactions into several types of deals. Damodaran (2002) points out the difference between a firm’s acquisition led by another firm or by its own managers or outside investors (usually a tender offer). The latter are named management buyouts (managers’ involvement) or leveraged buyouts when the funds for the tender offer are mainly composed by Debt. As for an acquisition led by another firm, the author classifies into four different categories: merger, when two firms agree to combine, usually 50% of both firms’ shareholders have to agree to the merger, and the target firm ceases to exist and becomes part of the acquiring company; consolidation, when a new firm is created after a merger and the shareholders from both firms receive a stake in the new company’s common equity capital; tender offer, when one firm makes an offer for the outstanding stock of another firm at a specific price directly to the shareholders of the company, thus enabling the target firm to continue existing as long as there are dissident stockholders; and finally, acquisition of assets, when one firm purchases the assets of another company conditional on its shareholders’ approval.
David Boquinhas Page 21
2.2.2 History and Patterns
One of the major features of M&A present in the literature is its “wave pattern”. Martynova & Renneboog (2009) classified the term “takeover wave” as the pattern of the number and total value of takeover deals over time. This phenomenon means that there are short periods of very intense merger activity (Town, 1992). Martynova & Renneboog (2009) states that five completed waves have been examined in the academic literature – early 1900’s, 1920’s, 1960’s, 1980’s and the 1990’s – being the most recent particularly remarkable in terms of size and geographical dispersion. The author’s study argued that M&A activity is: (a) typically interrupted by an abrupt decline in stock markets and a subsequent economic recession; (b) usually takes place in periods of economic recovery coinciding with rapid credit expansion and stock market booms; (c) often fuelled by regulatory changes; (d) frequently driven by industrial and technological shocks; and (e) significantly influenced by managers’ personal objectives. Accordingly, another main literature concern is whether M&A deals have been having the desired profitable effect throughout history. Gaughan (2004) stated that many of the largest deals in the 90’s M&A wave were “colossal failures”. The author claims that “some of the more prominent failures of the 1990s, such as the AOL Time Warner (now Time Warner) fiasco, the Daimler-Chrysler merger, the acquisition programs of Tyco and WorldCom, and Vivendi’s and AT&T’s unsuccessful forays into fields outside of their core businesses” can all be traced to insufficiently diligent board of directors. This fact lead to a recurrent issue in M&A texts: whether the focus of M&A activity should be a diversified or a related acquisition strategy. Authors like Morck et al. (1990) have suggested that managers’ motivation to engage on diversified acquisitions is to make up for poor performance, reduce risk and assure survival of the company. The authors, in agreement with Gaughan (2004), assert that few companies have been able to successfully pursue a diversification strategy. Other authors like Berger & Ofek (1995), Maquieira, Megginson & Nail (1998) and DeLong (2001) also found evidence of value destruction from diversification and that the degree of relatedness between the businesses and geographical location of the acquirer and acquiring company are positively correlated with returns. However, Morck & Yeung (1997) found that not all companies are subject to value destruction from diversification and that information-intensive (e.g. R&D) companies, can benefit from this strategy.
David Boquinhas Page 22
2.2.3 Synergies and value creation
Damodaran (2005) defines synergy as the additional value produced by two combining firms that together create opportunities that would not otherwise been created. Synergies are the ‘Holy Grail’ of mergers and acquisitions and as just mentioned above, M&A deals can easily destroy value and turn out to be authentic failures. For that reason, the interest academics nurture for the creation of synergies and its measurement is significant. Synergies are created from different sources which Damodaran (2005) categorized as operating and financial synergies. Operating synergies relate to the operations of the post-transaction firm and include economies of scale, increased pricing power and higher growth potential (higher expected cash flows). Financial synergies include tax benefits, diversification, higher debt capacity and uses for excess cash (higher expected cash flows and/or lower discount rates). Synergies however need to be valued prior to the deal has occurred leading one more time to projections and expectations. That is where the “fog” is. As Warren Buffett once said, “In some mergers there truly are major synergies – though often times the acquirer pays too much to obtain them – but at other times the cost and revenue benefits that are projected prove illusory”. Damodaran (2005) stresses how important it is to keep the value of the synergy apart from the value of control, when valuing the synergies (in which according to the authors’ steps one should firstly value the firms involved in the merger independently, then value the combined firm, with no synergy and finally, value the combined firm with synergy). In a summarized way, to value control, Damodaran (2005) suggests a revaluation of the target firm with a presumably better management in place and then to compare the value obtained with the valuation with the existing management in place.
As Sirower & Sahni (2006) argue, the truth of the matter is that literature agreement that, on average, acquiring companies increase value and acquirer’s destroy value for their shareholders, has little or no impact on the course M&A activity will take on the future. The good boards and managers will always go for a deal when they spot a good opportunity, whether it will materialize or not. A study on synergies that can relate to this view, and can provide an explanation for the creation or destruction of value within M&A related companies was conducted by Houston et al. (2001) where the authors suggest that expected synergies are important drivers of the wealth creation through M&A. By studying the relationship of the present value of the synergies with the deal’s announcement day, Houston et al. (2001) have found evidence that the market discount the value of synergies associated with the deal with a greater discount rate for revenue-enhancing synergies, and with a smaller discount rate for cost-reduction synergies, thus influencing the actual wealth creation of the transaction.
David Boquinhas Page 23
2.2.4 Performance fundamentals of M&A
Sirower & Sahni (2006) examined a sample of 302 large deals from the 90’s merger wave with the purpose of effectively oversight the decisions that lie behind years of difficulty in creating value through M&A. The key results of the study are as follows:
“On average, acquirers underperform their industry peers.” Note, however, that together with this average there was a wide variance of outcomes in the sample with one-year returns ranging from -151% to 281.5%;
“Initial reactions are persistent and indicative of future returns.” The authors affirm that the majority of deals that had an initial negative response presented negative returns one year after the deal, while half of the deals that began positively maintained a strong positive return after the same period;
“Delivering results after a good start pays off big.” Following last argument, the authors conclude that deals that began with a positive reaction by investors, and that continued to receive a positive response outperformed in 58% deals that began and continued to be perceived negatively;
“Price matters.” The study conducted by the two authors found that the average premium paid by the initially negative responded deals was around 8% higher than the positive deals. The deals performing negatively, after one year, had around the same difference in premium paid and, more prominent was the difference found in the premium paid between persistent negative performers and positive ones (around 15%);
“Cash deals outperform stock deals.” This finding reiterates the extensively documented evidence on the underperformance of stock deals;
“Sellers are the biggest beneficiaries of M&A transactions.” Shareholders of the buyer company lost on average, while shareholders of the selling firm earned on average 20% from the week before the deal announcement and the week after;
“M&A transactions create value at the macroeconomic level.” The combined value creation (even though shareholders of the buyer company loses, shareholders of the selling firm win) was on average 1% at announcement, thus creating value for the economy. The stock deals however presented negative combined value creation, but
David Boquinhas Page 24
on the other hand cash deals had a positive combined return compensating for the observed value destruction of stock deals.
2.2.5 Cross Border M&A. New wave? More value?
Zenner, Matthews, Marks & Mago (2008) studied how the growing integration of the global markets for labor, capital, goods, and services has been fueling cross-border M&A in a stagnated developed economy. The authors refer how in 2007 cross-border transaction quintupled in dollar volume, attaining an historical high volume. Zenner, Matthews, Marks & Mago (2008) identify and focus on globalization, diversification and deregulation as the long-term factors driving the current cross-border M&A wave while the short-long-term catalysts are recognized to be the high relative valuations, cheap USD, sovereign wealth funds influence and reduced domestic competitions.
Dobbs, Goedhart & Suonio (2006), in a previous study, had already studied the new boom in M&A activity circa 2006. Their study did not impact on whether the activity was taking place across borders or inside border, but on how shareholders were doing compared to the previous waves researched in the literature. According to the researchers, the value added by the deals in the current boom was around 6% when the average value creation in the previous boom was a bit more than 1%. The authors mention the fact that the value creation through M&A is at a ten-year record high. One of the explanations presented by the authors for the more favorable market reactions is the fact that the percentage of cash-deals to total deals has increased in this boom. However, researchers note that both cash and stock deals performed best in the current boom. Another shift in performance observed by the authors is the value acquiring companies’ shareholders are getting from this current boom in M&A activity. Accordingly, Dobbs, Goedhart & Suonio (2006) argue that buyer’s firms’ shareholders are keeping more value and that the proportion of acquirers overpaying has decreased. Both the lower premiums paid and also the proportion of cash deals are indicated as plausible justifications for the observed acquirer firms’ shareholders’ gains.
Conclusion
Both Valuation and M&A are extensively researched subjects by academics. The fact that valuation is the basis of Finance these days, and M&A activity plays such an important role at micro and macroeconomic levels have made it this way. Valuation literature keeps on growing with the conscience that the models applied do not truly reflect reality. Academics desire to improve these models while dealing with the paradox between complexity and reality-faithful models have kept literature on valuation dynamic. M&A activity patterns and its much debated
David Boquinhas Page 25
value creation/destruction phenomenon have also kept scholars very interested in this topic with the intention of deciphering the secrets of a successfully transaction. A glance on some of the work conducted by scholars and academics over the years was provided in this section with the purpose of illustrating how researchers have been approaching both Valuation and M&A subjects and how their main questions have been addressed.
David Boquinhas Page 26
3. Companies and Industry
This paper presents a hypothetical merger between Beam Inc. (US) and Pernod Ricard S.A. (French), two companies operating in the Distilled Beverage (also known as Wines & Spirits, liquors or distillers & vintners) industry.
This section provides an overview on the Wines & Spirits industry worldwide, followed by separately analysis on both Beam Inc. (Beam) and Pernod Ricard S.A. (Pernod Ricard). The purpose of such analysis is to contextualize the proposed deal within the macro and micro environment in which the participant companies are involved, to identify trends, specific characteristics, and value drivers that can influence the way the merger should be structured.
3.1 Alcoholic Beverage Industry
The industry in which both Beam and Pernod Ricard operate is classified according to the GICS (MSCI 2010) as Distillers & Vintners. The GICS (MSCI 2010) classifies the Distillers & Vintners sub-industry of Food, Beverage & Tobacco, as the distillers, vintners and producers of alcoholic beverages that are not classified in the Brewers sub-industry which in turn include the producers of beers and malt liquors (high alcohol content beer).
The Distillers & Vintners industry can be sub-divided into two main industries: spirits and wine industries. However, companies in the Wines & Spirits industry compete for market share in an exceptionally competitive environment. Competition within this industry is not only between brands but also between categories and includes other alcoholic beverages such as beer. Products like Heineken beer competes not only against Budweiser beer, but also against Ballantine’s scotch or Bacardi rum (ICAP, 2002). Under this circumstances, this industry overview section will not be confined to the analysis of the specific Distillers & Vintners industry category but will, on the other hand, highlight the main characteristics of the whole alcoholic beverage sector that can play a determinant role in the assessment of the context in which the merger between Beam and Pernod Ricard will eventually take place, with a special emphasis on the US market, in which most of the pre-determinants and outcomes of the deal will have an effect.
Competition and major players
Alcoholic beverages include beer, cider, ale, wine (including sparkling, barley, and rice wine) and spirits such as rum, whiskey, brandy and vodka. In 2011, almost 40% of the world’s
David Boquinhas Page 27
alcoholic beverage consumption involves branded drinks that are usually large companies operating at an international level and investing heavily in marketing to promote image and encourage consumer loyalty (ReportLinker, 2011). This happens because demand is driven by consumer preferences in alcohol consumption and demographic trends. The profitability of individual companies depends on effective sales operations and maintaining low operating costs. Large companies have advantages in exclusive distribution rights in large markets. Small operations can compete effectively by distributing rare and expensive products. At a general level, the world’s top five alcohol beverage companies (thus including wine, spirits and beer players) are, according to its market cap, as listed below:
Figure 1: Top Five Alcohol Beverage Companies by Market Cap
Rank Company Country Market Cap ($ M)
1 Anheuser-Busch Inbev Belgium 155,675.75
2 AMBEV Brazil 122,635.46
3 Diageo UK 75,527.39
4 Heineken Netherlands 41,727.84
5 Pernod Ricard France 32,100.63
Source: Bloomberg (17-April-2013)
Notice that, of these five, only Diageo and Pernod Ricard are major players in the wine and spirits industry.
The beer wholesale industry is fragmented: the top 50 companies account for about a third of industry revenue. The wine market is also very fragmented. The top 10 companies accounted for just 13.5% of total sales by volume in 2010. The largest player in the wine industry is Constellation Brands, which has a 3% market share. The spirits industry, in contrast with the beer and wine industry is characterized by a high degree of concentration, with major US players Diageo, Brown Foreman, Beam and Pernod Ricard accounting for much of domestic production. The top players often buy and sell brands among each other, thus leading to considerable reallocation of market share and brands. For instance, in 2008, Fortune Brands acquired the Cruzan Rum brand from Pernod Ricard and later in that year sold Pernod Ricard its Absolut vodka brand. Even though it is difficult to indicate exactly the market share of the major players operating in the spirits industry, the top five spirits’ players in the world by volume are, according to an ImpactBank study in 2011, as follows:
David Boquinhas Page 28
Figure 2: Top Five Distilled Spirit Marketers Worldwide in 2010 (millions of nine-liter cases)
Rank Company 2010 Volume 1995 Volume 1995 Rank
1 Diageo 115.9 109.0 1 2 United Spirits 110.7 15.1 9 3 Pernod Ricard 97.0 24.4 7 4 Bacardi 36.4 27.4 5 5 Beam 33.5 24.7 6 Source: ImpactBank, 2011
Growth and key segments in the Distillers & Vintners Industry
“While consolidation has been these companies’ long-term M&A strategy, players have recently tweaked their approach in order to lessen the impact of the recession. Their discount brands have been selling well. However, this segment is very competitive with a number of unbranded and private label wines available in many markets.” (M&A International, 2011). As a result, global alcoholic beverage companies like Pernod Ricard, its main competitors (e.g. Diageo, Bacardi), and major wine producers such as Constellation Brands have recently experienced margin degradation. In order to counteract this, producers have begun to divest their lower-end offerings to focus on premium brands, i.e. over $12/liter (M&A International, 2011).
There is indeed the perception that the wine market can lose ground to alternatives such as beer and spirits, especially as consumptions trends change, however, the global wine industry is expected to generate almost $292 billion in 2014. The EU leads with a 75% share of the global market (ReportLinker, 2011). On the other hand, the global spirits industry was worth almost $263 billion in 2010, having recorded yearly growth of over 2.5% between 2006 and 2010 (ReportLinker, 2011). Market growth is expected to accelerate to exceed a yearly growth rate of 3% between 2010 and 2015 to hit $306 billion (ReportLinker, 2011). The global spirits industry refers to the manufacturing of spirits, with companies involved in distilling and blending liquors, blending and mixing liquors with other ingredients, and distilling potable liquors. Worldwide, in 2012, the spirits category distribution according to global volume is as follows:
David Boquinhas Page 29
Source: Distilled Spirits Council of US, 2013
While in the US market, Vodka is the Spirits’ leader accounting for 32% of all volume and 26% of revenue in 2012 (Distilled Spirits Council of US, 2013), in a global level, whisky represents the leading market segment, generating almost $70 billion in sales in 2010 and accounting for almost 27% of the overall market in terms of value (ReportLinker, 2011). The vodka industry recorded strong global growth prior to the economic recession, which negatively impacted the market. Though vodka sales plummeted in 2009, the market recovered in 2010, with a particularly strong rebound in Russia (ReportLinker, 2011). The world gin market reached a volume of almost 47 million cases in 2010, with the US leading the market with almost 38% market share (appendix 1, 2 and 3).
Trends in the Spirits Industry
Among the factors contributing for the continuous growth of the spirits industry, the following four trends have played an important role during the 2000’s decade, with special incidence on the US market (Distilled Spirits Council of US, 2013):
Product innovations and sophisticated line extensions. For instance, in 2012 over 40% of products had a flavor (e.g. orange, cherry, lemon) component beyond traditional categories (e.g. vodka, rum, tequila);
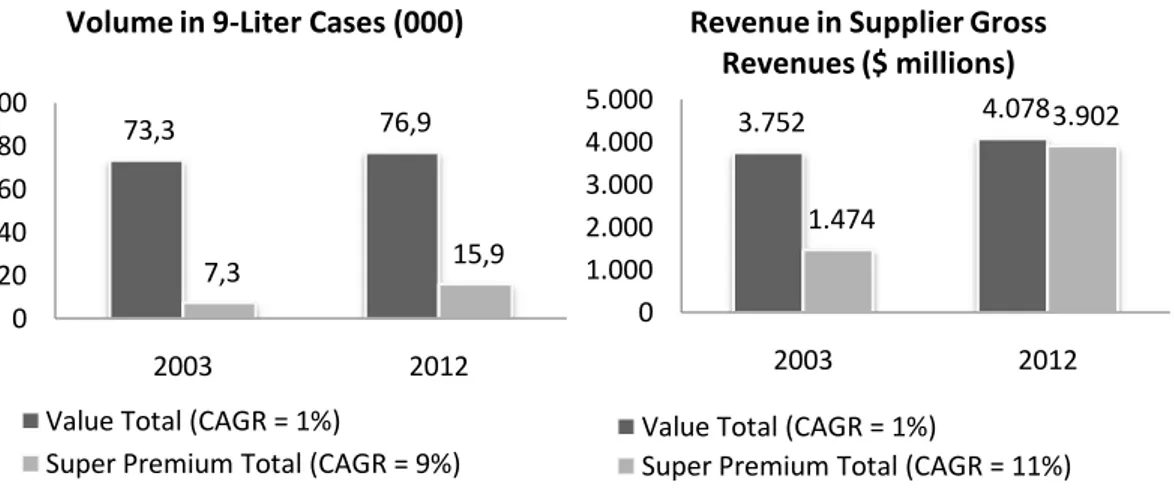
“Premiumization” - Spirits’ products are segmented on supplier prices, even though the range varies by product category, into four classes: Value, Premium, High End, and Super Premium (being Value the cheapest and Super Premium the most expensive) (Distilled Spirits Council of US, 2013) (see Appendix 1 for the distribution by Volume and Gross Revenue of the four categories of spirits). As illustrated in Figure 4, while
Whiskey 31,2% Vodka 21,7% Rum 12,3% Liqueur 12,2% Asian White Spirits
8,0%
Gin 6,2%
Tequila 3,6%
David Boquinhas Page 30
Value category has grown steadily, Super Premium has skyrocketed, in a phenomenon named “Premiumization”;
Figure 4: Evolution of Value Spirits vs. Super Premium Spirits
Source: Distilled Spirits Council of US, 2013
Modernization drive expands consumer access and “premiumization”. The increased advertising played an important role for the modernization and “Premiumization” effect. The new media (e.g. Facebook, YouTube, Twitter) allows spirits, beer and wine to have a whole new visibility in different market segments;
Global fascination with American Whiskey drives 3rd year of record exports. American
Whiskeys (most notably the Bourbon) represents 68% of total US spirits exports.
73,3 76,9 7,3 15,9 0 20 40 60 80 100 2003 2012
Volume in 9-Liter Cases (000)
Value Total (CAGR = 1%)
Super Premium Total (CAGR = 9%)
3.752 4.078 1.474 3.902 0 1.000 2.000 3.000 4.000 5.000 2003 2012
Revenue in Supplier Gross Revenues ($ millions)
Value Total (CAGR = 1%)
David Boquinhas Page 31
3.2 Pernod Ricard SA
Description
According to Forbes (2013) description, Pernod Ricard SA is a France-based producer and distributor of spirits and wines. The Company is active in eight principal beverage sectors: whiskies, aniseed spirits, liqueurs, cognacs and brandies, white spirits and rums, bitters, champagnes and wines. Pernod Ricard operates through 75 affiliates and has chosen to focus on sustainable growth through a large portfolio of international brands and a high-end strategy, known as “Premiumisation”. Pernod Ricard SA's flagship brands include ABSOLUT, Ricard, Havana Club, Ballantine's, Malibu, The Glenlivet, Chivas Regal, Beefeater, Kahlua, Martell, Royal Salute, Mumm, Perrier-Jouet and Jameson, among others. The wine category includes, Jacob's Creek, Brancott Estate, Campo Viejo and Graffigna. It operates as holding company, with the structure divided between brand owner subsidiaries, such as The Absolut Company, Havana Club International and Chivas Brothers, which produce and develop marketing strategies for the brands, and regional distribution subsidiaries, such as Pernod Ricard Europe, Pernod Ricard Americas and Pernod Ricard Asia, distribute local brands. As of December 31, 2010, the Company owned 107 production plants.
History and Strategy
Pernod Ricard was born in 1975 out of the merger of two companies, Pernod SA and Ricard SA and ever since the group was able to take advantages of new resources and expand globally by pursuing an acquisition strategy, common to its industry peers. Pernod Ricard gave priority to whiskey, the most consumed spirits in the world, and the United States, the world’s biggest market for the industry. Following a series of successful acquisitions around the globe, in the late 90’s Pernod Ricard “embarked on a reorganization, aimed primarily at decentralizing its activities” (Pernod Ricard Annual Report, 2012). With a strong financial and commercial performance, Pernod refocused on its core business, starting to divest from the non-alcoholic food and beverage segment and continuing its acquisition strategy of major spirits companies as can be elucidated by the successful acquisition in 2008 of Vin&Sprit Group, owner of ABSOLUT Premium vodka, the world leader in its category. In late 2000’s Pernod Ricard, despite the difficult economic context, continued to demonstrate a rise in its profits with the successfully integrated ABSOLUT brand, and continued with the strategic refocusing with a series of disposals, particularly in the wine segment accompanying the industry trends and with the purpose of deleveraging its balance sheet.
David Boquinhas Page 32
Organization, key segments and brands
As illustrated in Figure 5 below, the general organization of the Group is based around Pernod Ricard which holds companies referred to as “Brand Companies” and, either directly or indirectly through holding companies referred to as “Market Companies”. Some companies combine both Brand Company and Market Company activities as it is the case with the ABSOLUT brand, for which Pernod Ricard set up two new operational structures following its acquisition in July 2008: The ABSOLUT Company, a Brand Company responsible notably for the ABSOLUT brand throughout the world (including production), and Pernod Ricard Nordic, a “cluster”, under Pernod Ricard Europe, in charge of selling Pernod Ricard’s local and international brands on the Swedish, Danish, Finnish, Norwegian, Baltic and Icelandic markets (Pernod Ricard Annual Report, 2012).
Figure 5: Pernod Ricard’s Organization
Source: Pernod Ricard Annual Report, 2012
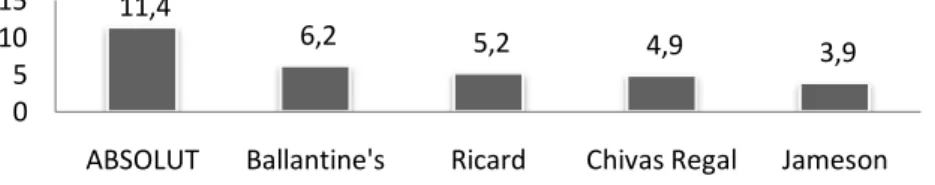
The company relies on its decentralized organizational structure, which employs almost 19,000 people in more than 70 countries, to pursue its current strategy of: (a) investing foremost on its world-class strategic brands (14 of those brands); (b) add Premium Brands to the company’s portfolio; (c) expand in the U.S. and emerging markets; and (d) continue to grow through acquisitions to remain a dynamic player in the consolidation of the Wines & Spirits sector. Regarding Pernod Ricard’s portfolio, the company owns one of the industry’s most prestigious brand portfolios which include the following strategic brands:
Figure 6: Top 5 Strategic Brands3(2011/2012 volumes in millions of 9-liter cases)
Source: Pernod Ricard Annual Report, 2012
3
Excluding wine brands 11,4 6,2 5,2 4,9 3,9 0 5 10 15