FACULDADE DEENGENHARIA DAUNIVERSIDADE DOPORTO
Combining Simulation and Optimization to
Improve Picking Performance on a Specialized
Retailer Warehouse
João Figueiredo Lopes Alves
Mestrado Integrado em Engenharia Industrial e Gestão Supervisor: Prof. Luis Guimarães
Combining Simulation and Optimization to Improve
Picking Performance on a Specialized Retailer Warehouse
João Figueiredo Lopes Alves
Mestrado Integrado em Engenharia Industrial e Gestão
Abstract
The importance of warehouses have on companies’ supply chain has been increasing in the past few years. This pressures warehouses in attempting to decrease costs to become more efficient. In the supply chain a warehouse can serve many purposes such as taking advantage of forward buys, meet uncertainties in the supply chain and many more. While these tasks are beneficial for the supply chain, the very labor intensive operations inside the warehouse can mean significantly high operating costs. Therefore, any inefficiency can be seen as a major opportunity for cost reduction. Among the most vital decisions in warehouse planning is the storage assignment policy. The decision of where to locate the products inside the storage space of the warehouse has been proven to have a considerable impact in the overall warehouse productivity.
To tackle this problem a methodology that can be used to select a best overall storage assign-ment policy was developed. The methodology combines simulation and optimization to design test and evaluate alternative policies. The first part of the methodology is used to characterize picking performance, next an optimization method is used measure the expected performance of each policy and afterwards the storage assignment policy is tested under uncertainty.
The results achieve by this methodology look promising and show that it can be used to tackle the storage assignment policy on a more operational level, instead of the more frequent tactical level. In the case study tackled by this thesis, the estimated reduction of the expected order-picking travel time achieved was of 17%.
Resumo
A importância que os armazéns têm na cadeia de abastecimento das empresas tem vindo a au-mentar nos últimos anos. Este fator faz com que os armazéns tentem reduzir custos para ficar eficientes. Numa cadeia de abastecimento, um armazém pode ter vários propósitos, tais como aproveitar compras a prazo, aguentar com a variabilidade natural da cadeia de abastecimento, en-tre outros. Enquanto estas tarefas são fundamentais para a cadeia de abastecimento, é preciso uma quantidade considerável de mão-de-obra o que por sua vez pode levar a altos custos operacionais. Portanto, qualquer ineficiência pode ser vista como uma grande oportunidade para uma redução de custos. Uma das decisões mais críticas para o planeamento de um armazém é a política de atribuição de posições. Já foi demonstrado que a decisão de onde colocar cada produto dentro da área de armazenamento tem um impacto considerável na produtividade do armazém.
Para resolver este problema foi desenvolvida uma metodologia que pode ser usada para se-lecionar a melhor política de atribuição de posições. Esta metodologia combina simulação e otimização para testar e avaliar políticas alternativas. A primeira parte da metodologia é usada para caracterizar a performance do picker, a seguir um modelo de otimização é usado para medir o valor expectável da alteração da política de atribuição de localizações e finalmente a nova política escolhida é testada, usando incerteza.
Os resultados obtidos por esta metodologia aparentam ser promissores e mostram que pode ser usada para resolver este problema da política de atribuição de posições num nível mais opera-cional, em oposição a ser ao nível tático mais comum. No caso de estudo desta tese a redução estimada do tempo de viagem é de 17%.
Acknowledgments
The first person that I want to thank is my supervisor, Prof. Luis Guimarães. The amount of confidence that he deposits in me, the support that he gives when it is needed, the motivation to continue moving forward no matter and continues challenges for me to solve what are one of the main reasons that, in the few months that I have been working in CEGI, made me a better person and a better professional. Above everything else, I am grateful for his amazing friendship and everything he already taught me.
I would also like to thank Prof. Bernardo Almada Lobo for giving me the chance to work with this project in this area of work that each passing day makes me enjoy it even more dearly.
I would also like to thank to the project team because without you this thesis would never seen the light of day. Thank you for all the fruitful discussion we have had. Especially, Mário Lopes whose innovative and changeling ideas made that this methodology could exist.
More people worth mentioning are all my colleagues that work on Centro de Engenharia e Gestão Industrial (CEGI) on INESC TEC for making going to work a pleasure and fun. Everyone that works there is an amazing professional and I feel humble to work with such amazing people.
Also, I would like to thank those who without their constant support and patience I would not be able to finish this thesis.
Finally, I would like to thank my girlfriend, the one person who listens to me everyday, that was there to offer a kind word when I needed, and to everything I needed
Contents
1 Thesis Overview 1
1.1 Problem Setting . . . 1
1.2 Scope and objective . . . 2
1.3 The proposed approach . . . 3
1.4 Thesis Structure . . . 4
2 The Warehouse 5 2.1 Storage Facilities . . . 5
2.2 Reception . . . 8
2.3 Storage and assigning picks . . . 8
2.4 Order-Picking . . . 9
2.5 Sorting and Shipping . . . 12
2.6 Operational Constraints . . . 12
2.7 Key Performance Indicators . . . 13
3 Warehouse Science 15 3.1 Warehouses . . . 15 3.2 Warehouse Operations . . . 16 3.3 Layout . . . 16 3.4 Picking policies . . . 17 3.5 Storage assignment . . . 18 3.6 Zoning . . . 19 3.7 Comparison . . . 20
4 The SOS Methodology 21 4.1 Describe Warehouse Zones . . . 21
4.2 Optimizing Zone Layout . . . 24
4.3 Estimating Performance Under Uncertainty . . . 31
5 Improving Picking Performance 35 5.1 Validation of the Simulation Model and Estimation of the Picking Parameters . . 35
5.2 Validation of the Analytical Model . . . 39
5.3 Improving Picking Performance Changing Storage Assignment Policy . . . 41
6 Conclusions and Future Work 45
References 47
List of Figures
1.1 An overall perspective of the SOS methodology and its building blocks . . . 3
2.1 Supply chain and distribution center main activities . . . 6
2.2 Simplified scheme of the layout of the pallet racking system . . . 6
2.3 Current layout of zones in the warehouse (in black are zones currently not being used) . . . 7
2.4 Cumulative distribution function of the number of order-picking tasks generated by an order on the Racks area . . . 9
2.5 Cumulative distribution function of the number of order-picking tasks generated by an order on each zone . . . 10
2.6 Average number of order-picking tasks created in each zone by each order on a given day . . . 11
2.7 Picking heat map . . . 12
2.8 Productivity vs Quantity Picked . . . 13
2.9 Quantity picked and total time required by zone . . . 14
4.1 Global overview of the first simulation model . . . 22
4.2 Events that occur on each day of the simulation . . . 23
4.3 The logic behind an order-picking task . . . 23
4.4 An example of a layout . . . 24
4.5 3 different cases where an aisle can be visited when it does not have an order-picking task and belongs to domain D . . . 27
4.6 3 different cases where an aisle can be visited when it does not have an order-picking task an belongs to domain I . . . 29
4.7 Global overview of the simulation model . . . 31
4.8 Events that occur on each day of the simulation . . . 32
4.9 Process flow of assigning a new storage position . . . 33
4.10 Process flow to create order-picking tasks . . . 34
5.1 Comparison of daily total picking tasks time between the simulation model and reality for all the zones of the Racks area . . . 36
5.2 Comparison of daily total picking tasks time between the simulation model and reality for the SPZ zone . . . 37
5.3 Comparison of daily total picking tasks time between the simulation model and reality for the RAK zone . . . 38
5.4 Comparison of daily total picking tasks time between the simulation model and reality for the PUN zone . . . 39
5.5 Comparison of daily total picking tasks time between the simulation model and reality for the UNI zone . . . 39
x LIST OF FIGURES
5.6 Comparison of daily total picking tasks time between the simulation model and reality for the CAL zone . . . 40 5.7 Comparison of the total order-picking time between the analytical model
estima-tion against the actual values for different task sizes . . . 41 5.8 COI-based ABC curve of zone CAL . . . 42 5.9 Zone CAL heatmap with a COI based policy vs the actual one . . . 43 5.10 The expected improvement on the total task time when using a COI-based ABC
policy vs. a random storage policy . . . 43 5.11 The expected improvement on the total travel time when using a COI-based ABC
List of Tables
2.1 Description of each zone . . . 8
4.1 Inputs of the first simulation model . . . 22
4.2 Inputs of the last simulation model . . . 32
5.1 Summary of the overall approximation . . . 40
Acronyms and Symbols
APS Automatic Picking System
COI Cube-per-Order Index
FD Fashion Division
KPI Key Performance Indicators
PBS Picking By Store
SD Sports Division
SOS Simulation-Optimization-Simulation
SKU Stock Keeping Unit
WMAE Weighted Mean Absolute Error
WMS Warehouse Management System
Chapter 1
Thesis Overview
Nowadays warehouses and distribution centers are vital points of any supply chain. To keep the price of products low, the operations inside the supply chain have to be as efficient as possible (Jacobs and Chase (2010)) and warehouses play a major role in this endevour. In this context some of the warehouses missions are related to: take advantage of quantity purchase and forward buys, maintain a steady source of supply, meet uncertainties in the supply chain, consolidate cus-tomers order and save transportation costs, among other (Manzini et al.(2011)). Therefore, an efficient supply chain must be based on efficient warehouse operations. However, warehouses are frequently associated with large costs because of their extremely labor intensive activities which constitute an important motivation to improve warehouse productivity and at the same time the efficiency. An efficient and productive warehouse allows to serve the customers with shorter lead times and in a more cost-efficient manner. Moreover, an increase in productivity can also lead an higher service level with controlled increase in costs for the company.
The project that motivated this thesis was the study of the main warehouse of a specialized retailer operating on fashion apparel and sports equipment areas. The warehouse is divided into picking zones, the main goal was to study their storage assignment policies, in other words, prod-uct storage allocation rules inside these zones in order to improve picking performance. These decisions are to take into account operational and physical constraints as well as the demand pat-terns imposed by the stores orders.
1.1
Problem Setting
Specialized retail is a subtype of the ever growing and dynamic retail market. The retail market is by definition the sale of goods or services to the last element of the supply chain, the end-user. Usually the retailer buys from suppliers large quantities and sells smaller quantities to the consumer with the goal of making profit.
Specialized retailers are individuals or businesses, that usually through a brand, focus on sell-ing products that clearly belong to one very specific type of segment. The main advantage of
2 Thesis Overview
a specialized retailer over a non-specialist retailer often comes from providing a wider product assortment, thus better fitting customer needs.
The warehouse under study serves three different brands of specialized retailers that target two different types of product segments. One of the brands is specialized in sporting goods, having products ranging from footwear, to clothing, sports gear or even gym equipment. The products belonging to this brand are located in the warehouse at the Sports Division (SD). The other brands served by the warehouse are specialized on selling fashion apparel for two different target audiences: (1) the baby and children segment, mainly clothes and nursery products; (2) women and her family, especially clothing and fashionable items. Because of the similarity among the products from these two categories they are placed together at the Fashion Division (FD).
J. Susan Ferraraclassifies the goods that a retailer can sell in two different types, hard goods and soft goods. Hard goods are, for example, electronics, jewelry, some sports equipment like treadmills. On the other hand, we have soft goods, like apparel, accessories, books or even footwear.
This two markets have mostly soft goods, and one of the main characteristics these products is related to their short life cycle, usually less than one year. Furthermore, in the FD there are products with an extremely short life cycle being designed to last only a month at the stores. This fact poses major challenges to the company operations and thus to the warehouse planning. For companies that work on this market the short life cycle of products makes forecasting prod-ucts’ performance an extremely complex and difficult task. In face of these hesitant forecasts, warehouse operations are stressed as the decision of where to store a given product lacks reliable information and storing a product in the wrong position can create significant inefficiencies.
1.2
Scope and objective
The main project objective was to study how can picking productivity be increased by questioning the current storage assignment policy inside each zone. By doing so, it would be possible to improve the warehouse efficiency without requiring any structural change, allowing managers to realize the current constraints and their impact in picking productivity. Having this goal in mind the following key questions were made to challenge the current status quo.
• How does the current rules perform?
• How to assign storage positions to maximize productivity? • How will the new rules perform under different conditions?
To answer this questions it was mandatory to study the warehouse in depth and understand what could be changed and which were the hard constrains to be considered. Additionally, the new solutions for the storage assignment policy should be validated in particular, the required changes that warehouse operations would have to go through in the implementation phase, are to be explained.
1.3 The proposed approach 3
The warehouse is divided in two main areas: the Racks area composed by a pallet racking system in which the picking positions are at ground level and above are the storage positions for the multiple products that flow through the warehouse; the Mezzanine area which consists of 4 floors with shelves having multiple positions used both for picking and storage.
Each one of these areas is further divided into picking zones. Picking zones confine the picking tasks, in other words, when performing a picking task it only passes through picking positions within the same zone. As a result, a picking position cannot be part of more than one zone. In the Racks area, zones are separated between the FD and SD and also accordingly to the some specifications on the shipping support1. In this work the focus will be the Racks area as it was identified to be the least productive area.
1.3
The proposed approach
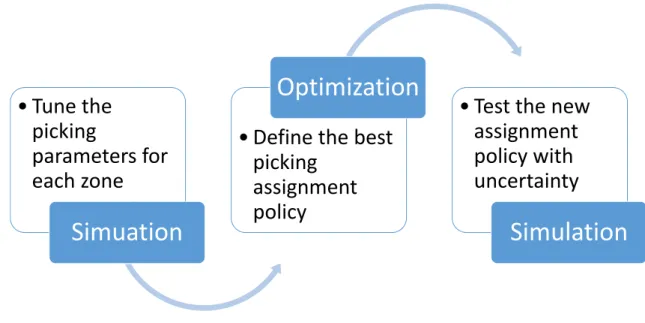
In order to tackle the problem at hand a hybrid approach combining simulation and optimization was developed with two steps of simulation and one step of optimization. First a simulation model is used to fine tune the picking parameters by simulating the current operations and comparing the results with actual figures. Afterwards, an analytical model is used to select the best storage assignment policy aiming to minimize the total picking travel time within each zone. Finally a discrete event simulation model is applied introducing uncertainties in the storage assignment policy with the goal of validating the policy robustness. The precedences and connection between these building blocks are depicted in Figure1.1.
• Tune the
picking
parameters for
each zone
Simuation
• Define the best
picking
assignment
policy
Optimization
• Test the new
assignment
policy with
uncertainty
Simulation
Figure 1.1: An overall perspective of the SOS methodology and its building blocks
1The term shipping support is used to define the holder of the products, when these are shipped to store, e.g. cases,
4 Thesis Overview
The main contribution of this thesis is the analytical model that estimates the expected picking travel time according to the storage assignment policy. The outputs of the first simulation are feed into this model that is used to evaluate the different picking policies and select the best one. The final simulation model will evaluate the robustness of the suggested storage assignment policy by introducing uncertainty in the picking assignments that would lead to misplacement’s of SKUs.
Using the framework established byFigueira and Almada-Lobo(2014) it is possible to clas-sify the purpose of the two simulations. The hierarchical structure of the models is a Sequential Simulation-Optimization, meaning that first the simulation is run and the optimization phase only takes place when first the simulation is finished. This simulation has the purpose of being an Ana-lytical Model Enhancement. As the name suggests in this methodology the simulations results are used to enhance the optimization model parameters. The classification of the last simulation, the one performed after the optimization, is Solution Generation meaning that it is used to comple-ment the solution provided by the optimization model. Accordingly to the authors hybrid models that combine simulation and optimization usually are used as an attempt to answer uncertainty.
1.4
Thesis Structure
In the following chapters of this thesis it is possible to find a more detailed explanation and anal-ysis of all the context and methodology of the project. In Chapter 2, the warehouse will be presented and analyzed in more detail. In Chapter 3, the current state-of-the-art is revised and compared against the warehouse making it possible to understand better the warehouse character-ization. Moreover, the techniques that already exist to diagnose and improve performance are also presented allowing the identification of the gaps relative to the problem under study. The SOS methodology to tackle this problem is explained in Chapter 4, which includes an analysis and ex-planation of the models. After presenting the methodology, Chapter 5 is devoted to the validation of the methodology, along with the results and their analysis. To finalize, Chapter 6 withdraws the main conclusions and also points some suggestions and improvements for future work.
Chapter 2
The Warehouse
Taking in account the importance of warehouses in the supply chain of a company, improving their performance can bring major cost reductions to the global supply chain cost or an significant in-crease in service level to the final client. In this chapter a description of the warehouse is presented. First the storage facilities will be explained, followed by the definition of the main operations. Af-terwards, the main operating constrains will be addressed and to finalize the Key Performance Indicators (KPI) which will be used to measure warehouse performance are introduced, namely picking productivity. The current values for the KPIs will also be presented.
Warehouse operations comprehend many activities, as depicted in Figure2.1, which occur in distinct areas: reception, storage and shipping. A product that enters the warehouse, does it trough the reception area. After the recount and quality check the product passes to the storage area. At this point in time, one of the most crucial activities takes place: the storage position assignment. Finally, when a store order arrives a picker goes to the assigned position of the product and takes the quantity specified in the order moving it to the shipping area.
2.1
Storage Facilities
To better understand the problem at hand there are a few key characteristics that are crucial for a good understanding of the current warehouse operations. The warehouse under study operates on a low-level picker-to-parts system. A picker-to-parts system is defined by having a picker to walk or drive along the aisles of the picking area to pick the items. A low-level picking is characterized by having the picking positions located less than two meters high.
Another important characteristic of the warehouse regards its layout. As aforementioned, the warehouse is divided in two main storage areas: the Racks area and the Mezzanine area. The Racks area will be the main focus of this work.
The Racks area operates on a pallet racking system composed of 27 groups of aisles with storage positions on both sides, except the first and the last group of aisles that only have storage positions on one side. Each group of aisle is composed by three aisles creating two cross aisles. A simplified scheme of the Racks area is presented in Figure2.2. This allows for a picker to
6 The Warehouse Suppliers Store Assign picks Stores Reception Picking Shipping Marshalling
Figure 2.1: Supply chain and distribution center main activities
2.1 Storage Facilities 7
quickly exchange between group of aisles without having to travel the full length of an aisle group. Another property of the pallet racking system is that each position has 5 levels and each level can support a full pallet (the height of each level is limited to 2 meters). This warehouse uses a low-level picker-to-parts picking policy, thus order-picking is only performed on the ground low-level and the vertical storage space is used to store reserve quantities for the picking positions . When the stored quantity on the picking position ends one of the reserve positions is used to replenish the picking position of that particular SKU.
The other major storage area inside the warehouse is the Mezzanine area, despite it not being a subject of study of this thesis there are some characteristics that are needed to be understood. The Mezzanine area has 4 floors on each floor there are shelves with multiple picking positions, on each storage position of the Mezzanine usually only fit one or two cases of an SKU. This characteristic makes the Mezzanine area more fit to store smaller quantities when compared to the Racks area. The Racks area is able to store a full pallet of products than can hold multiple cases in one position, the mezzanine area would require many positions to achieve the same storage capacity. On the other hand, the Mezzanine area has access to an Automatic Picking System (APS) that allows for order-picking tasks to be batched and thus increase picking productivity.
Another key property is the concept of picking zones defined within each area, and these are particularly important in the Racks area. These zones serve three purposes. The first one is to reduce the overall picking time by restricting the area that an order-picker can travel when per-forming an order-picking task. The second purpose is related to the shipping policies of different products. While some products have to be shipped in cases, others because of their size are shipped on pallets. The final purpose is related to the two divisions, Fashion Division (FD) and Sports Di-vision (SD), each zone belongs exclusively to one of these diDi-visions making it possible to separate the products of the two business areas.
Figure 2.3: Current layout of zones in the warehouse (in black are zones currently not being used)
0Picking positions are those that an order-picker goes to retrieve the an SKU when it is ordered by a client. Reserve
8 The Warehouse
A description of each zone of the Racks area can be seen in Table2.1. The position of each zone inside the overall layout of the warehouse is shown Figure2.3.
Table 2.1: Description of each zone
Division Zone Drop point Shipping support Product types
SD SPZ Shipping Lines Pallet Beverages, consumables, strange formats
SD CAL Shipping Lines CAL case Sports footwear
SD UNI Case Sorter Standard case Sports clothing and equipment
FD RAK Shipping Lines Pallet Nursery
FD PUN Case Sorter Standard case Clothing packs with multiple sizes
2.2
Reception
The entry of a new SKUs in the warehouse occurs in the reception area which is constituted by multiple bay doors that serve to unload shipments from suppliers. When a new truck is at a bay door it is emptied to the reception area. Afterwards, the staff has to cross-validate the information label of the support of the SKU against the SKU that actually is inside the support. The main reason behind this procedure is the low reliability of suppliers. Once all the cases have been checked the products are ready to be stored.
2.3
Storage and assigning picks
After the reception has been made, it is needed to assign picks and store SKUs. There is a very small percentage of SKUs that are being received for pure replenishment purposes. This occurs due to the product’s short life cycle, as such very few SKUs stay in portfolio long enough to receive multiple orders from the supplier. Moreover, the sourcing policy of the company also dictates that most SKUs are ordered only once and the quantity that arrives is the quantity that is going to be sold.
When defining the storage position of a new product one of the first decisions is to choose between the Mezzanine area and the Racks area. There are multiple rules to decide on which area it should be allocated, and some of the more important are:
• Does the product fit into a Mezzanine storage position? If not the product goes to the Racks area.
• If stored on the Mezzanine area how many storage positions will the SKU occupy? If the number of positions to be occupied is very high the product goes to the Racks area.
• Can the product be processed on the APS? If yes the SKU goes to the Mezzanine area. Once the area where the product is to be stored is defined there are more specific rules that define the zone. Since this work focus on the Racks area and also because the decisions within the
2.4 Order-Picking 9
Mezzanine do not influence this additional specification, only the rules related to the Racks area will be analyzed.
As it was previously mentioned, the Racks area is divided into multiple picking zones defined by: the division to which the products belong and the shipping characteristics that the products are subjected. What was not yet mentioned is that the picking zones are often subdivided into sections grouping classes of products. The goal is to simplify the storage assignment policy. Inside each section the storage position to be chosen is the first free position nearest to the begging of the section. Summing up the rule, the order in which they are applied is:
• Is the product of the SD or of the FD?
• Which shipping support is needed by the SKU? • What class of product does it belong to?
• What is the first free position nearest to the begging of the corresponding section?
After all the previous question have been answered the future storage position for a SKU is fully defined. Note that this rules are only applied to assign the picking position of a given product. The rule to assign products to reserve positions is simply to choose the closest free reserve positions from its assigned storage position.
2.4
Order-Picking
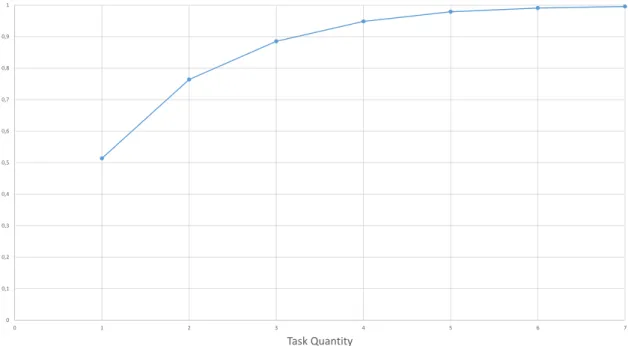
0 0,1 0,2 0,3 0,4 0,5 0,6 0,7 0,8 0,9 1 0 1 2 3 4 5 6 7 Task QuantityFigure 2.4: Cumulative distribution function of the number of order-picking tasks generated by an order on the Racks area
10 The Warehouse
Once all SKUs have picking positions assigned within the Racks area it is possible to look at orders from customers and start creating order-picking tasks. Figure2.2shows that each group of aisles has only one travel direction. This means that when a order-picker enters an aisle the full length of the aisle has to be traveled.
0 0,1 0,2 0,3 0,4 0,5 0,6 0,7 0,8 0,9 1 1 2 3 4 5 6 7
CAL UNI SPZ RAK PUN
Figure 2.5: Cumulative distribution function of the number of order-picking tasks generated by an order on each zone
In the Racks area all picking tasks are done using a picking by store (PBS) policy, this means that the order-picking tasks only serve a single store. When an order arrives to warehouse and there are products on the Racks area to be picked the order is split between the multiple zones that exist on the warehouse, because an order-picking task cannot go to more than one zone. Moreover, after each part of the order has been assigned to the corresponding zone the next step is, if needed, to split each part in picking tasks which are limited by the maximum capacity that an order-picker can pick in a single task. This constraint is related both to the maximum allowed volume for a picker to handle in a single order-picking task and to the maximum allowed weight. All these calculations are done by the Warehouse Management System (WMS) implemented at the warehouse.
The split of orders in multiple order-picking tasks allows them to be picked in parallel, i.e. order-picking tasks are independent as the order assembly is done afterwards, the assembly will be explained in section2.5.
Orders when split between zones usually create a single task per zone, as it show on Figure 2.4. Further analysis of this data shows that 95% of the orders received by the warehouse need at most 4 tasks to be completed.
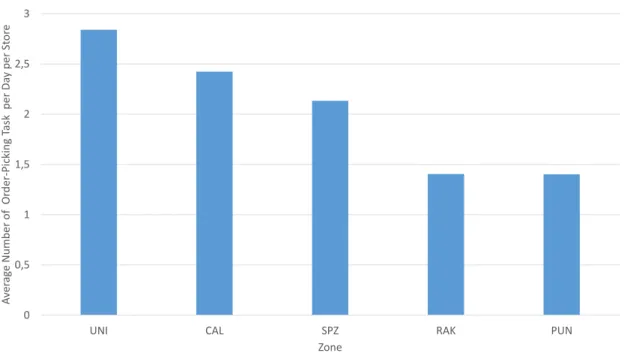
Repeating the previous analysis to each zone, presented in Figure2.5, shows that zones of each division have a similar pattern regarding the creation of tasks. The orders that belong to the SD
2.4 Order-Picking 11 0 0,5 1 1,5 2 2,5 3
UNI CAL SPZ RAK PUN
A ver ag e Num be r of Or de r-P ic ki ng Tas k pe r Da y pe r St or e Zone
Figure 2.6: Average number of order-picking tasks created in each zone by each order on a given day
usually require more order-picking tasks than the orders of the FD. It is possible to see this more clearly in Figure2.6 where it is shown that the average number of order-picking tasks on zones that belong to the SD is higher when compared to the FD where zones have a similar number of order-picking tasks created.
Figure 2.7 shows a visual representation of how many times an order-picking task went to the a given aisle of the Rack area (more frequently visited aisles are colored in warmer colors -red, while less frequently visited aisles are colored in colder colors - green), looking at this image and also to Figure 2.3 it is easy to understand why the left side of the heat map does not have any pickings, those aisles are not in used in the current layout. Also, looking to Figure2.5 the zones that generate more tasks are also those of the SD, which is globally speaking more warm. Furthermore the aisles that are from the SD and have a more warm tone are also the aisles where there are two picking positions per storage position.
To aid the order-picker performing the order-picking tasks, there is a voice picking system implemented. Each order-picker uses a wireless, wearable computer with a headset and micro-phone to receive instructions by voice from the WMS, and verbally confirm their actions back to the system. This system tells to a picker to go to a storage position. When the picker confirms that has arrived to the designed position the system tells the quantity to retrieve of the product stored assigned to that storage position. When the order-picker confirms that the picking is done the voice picking system says to the picker the next position. Two main advantages of this system are that the system can tell the order-picker the most efficient way to visit the storage positions and also that it lets the picker to operate hands free.
12 The Warehouse AF AG AH AJ AK AL AM AN AP AQ AR AS AT AV AW AX AY AZ BA BB BC BD BE BF BG BH BJ 1 46 82 81 45 46 82 81 45 46 82 81 45 46 82 81 45 46 82 81 45 46 82 81 45 46 82 81 45 46 82 81 45 46 82 81 45 46 82 81 45 46 82 81 45 46 82 81 45 46 82 81 45 2 82 46 45 81 82 46 45 81 82 46 45 81 82 46 45 81 82 46 45 81 82 46 45 81 82 46 45 81 82 46 45 81 82 46 45 81 82 46 45 81 82 46 45 81 82 46 45 81 82 46 45 81 3 AF AG AH AJ AK AL AM AN AP AQ AR AS AT AV AW AX AY AZ BA BB BC BD BE BF BG BH BJ 275 272813 602 1091 105 279994 12280 368 1730 1962 2080 2173 2392 3426 1052 309 1089 903 449 397 571 759806 1107 1002 638742 789770 1328 897 1604 485 5610 0265 57 0 0 0 0 0 0 0 0 0 249 0 0 0 9 12435 0 35 7 0 24220 1322 236 244 935903 1147 1369 13160 131382 1210 563 1251 1656 1514 1174 931 1459 1729 2120 2103 1370 1672 313 2590 201302 731900 1809 775 603559 828823 483 2345 2477 775 1164 1856 1873 1754 4 0 653 812 1860 1557 3186 2234 1280 1270 693 6760 0849 60596 347493 626436 347 1141 842376 480483 610725 1057 574 425717 1706 1853 1211 2389 1626 2002 2033 1180 1706
Circuito à palete (RAK) Circuito à caixa (PUN)
Circuito à palete (LPC)
Figure 2.7: Picking heat map
zone inside a division is dedicated to different shipping characteristics. While picking is done with an order-picker car in all zones that can carry two pallets, the shipping support may vary. In some zones the shipping support is the pallet and on other zones the pallet of the car has on top shipping boxes and the picked products are put inside the box. There are two type of shipping boxes: the standard box which is the most common box and it is used all throughout the warehouse, and a slightly bigger box only used in the CAL zone, because of the characteristics of the products stored in this zone. Each box has a label intended to identify the destination store and also the type of products inside. The shipping support that each zone uses is detailed on table2.1.
2.5
Sorting and Shipping
At the end of an order picking task the picker may go to two different locations: shipping lane or automatic box sorting machine. The final destiny depends upon the type of shipping support used in the picking zone where the order-picking task took place. Therefore, order-picking tasks not done on a standard box are sent to the shipping line and those that are done on the standard box sent to the automatic box sorting machine. This machine is able to read the label stamped in the box that associates it with a store. The machine has multiple lanes, each one of the lanes corresponds to a store, after reading its label the box is sent to the correct lane for building a pallet to be shipped afterwards to the stores.
The first trucks that are loaded are the trucks that go to stores that have a shorter lead-time of only 24 hours, usually the warehouse has at least 48 hours to satisfy an order from a store. Afterwards, the trucks are loaded in a geographic sense, the first ones to be loaded are the ones that must travel higher distances. This makes that the order on which order-picking tasks are performed is the same as the one followed by the shipping schedule.
2.6
Operational Constraints
Some of the characteristics that were described in the previous sections will be explained here and why they cannot be changed, at least without major changes to the warehouse. This are the hard constraints of the case study.
The zoning system that exists inside the Racks area cannot be changed because it is related to picking restrictions of the products. This means that the number of zones has to be, at least equal or greater than the current number of zones. Also there are products that do not fit in a standard
2.7 Key Performance Indicators 13
box or it would be highly inefficient to do so, this obligates that a zone for this product should be created so that products that cannot go to the box sorting machine do not go.
Another characteristic that cannot be altered is that the aisles in Racks area only have one way of travelling, and within a group of aisles all the aisles have to share the same direction. The main driver for this reasoning is that reduces the number of maneuvers that an order-picker has to do inside an aisle.
In section2.1was mentioned that each zone has to belong to either the Sports Division or to the Fashion Division, this cannot be altered because a product belongs only to one of the business areas and also because the WMS system can associate a zone only to one division. The WMS system imposes another restriction because a storage position can only belong to one zone.
Another constraint is that there are storage positions inside the Racks area that are rented and cannot be occupied by SKUs of the SD or the FD, this storage positions can be moved and assigned to different storage positions, but the quantity cannot be altered.
There is also one constraint present in the warehouse that only presents as a difficulty on this project, the Warehouse Management System (WMS) does not keep an history of operations or the stock level of the warehouse, the only history as to be taken daily and manually. This presents a major challenge because it decreases the amount of data that is available.
2.7
Key Performance Indicators
UNI CAL RAK SPZ PUN 0 50000 100000 150000 200000 250000 0 0,5 1 1,5 2 2,5 3 Tot al Qu an tity Pic ke d Productivity
Figure 2.8: Productivity vs Quantity Picked
Key Performance Indicators (KPI) were defined to assess the warehouse performance. The main goal of the project is to increase picking productivity, so it is fairly straight forward to under-stand that the main project KPI is productivity. This KPI is the same being used by the warehouse
14 The Warehouse
managers to evaluate picking performance and is defined according to:
Productivity=Total Quantity Picked
Total Picking Time (2.1)
Figure2.8 gives an insight on how the productivity of each zone of the warehouse is related to the volume picked. By analyzing this plot, as well as Figure2.3, it is clearly noticeable that the bigger zones have smaller productivity. This is particularly evident when comparing the PUN zone with the SPZ zone. Despite having similar picking volumes, SPZ, which has the smaller area, has a much higher productivity.
Figure2.9decomposed the productivity KPI in its components: the quantity picked and the time that it took to retrieve it. Looking at the image it is possible to see that there is not a clear relation between the quantity picked or the time that it took to be picked.
0 20000 40000 60000 80000 100000 120000 140000 160000 180000 200000 0 50000 100000 150000 200000 250000
UNI CAL RAK SPZ PUN
To ta l Pickin g Tim e (m in ) To ta l Qu an tit y P ick ed Zone
Figure 2.9: Quantity picked and total time required by zone
Productivity of the warehouse is important, nevertheless there are other indicators necessary to correctly evaluate warehouse decisions. One of the indicators worthwhile to monitor is the picking storage utilization. The high rotation of products implies that space required for each zone in a given season is different from the next season. For that reason when comparing two layouts with similar productivity, the one with an overall smaller space utilization would be preferable.
Chapter 3
Warehouse Science
Warehouses are in a large number of companies a central point of the supply chain, most research focus on the design of the warehouse or looking to the warehouse on a more tactical level while the operational level if often disregarded. This chapter will first present a brief review to why warehouses are needed and what are their main functions in the supply chain. Afterwards, the main warehouse operations will be explained. The final part of the chapter is dedicated to the research more intricately related to the work of this thesis. It reviews the body of literature devoted to layout configuration, how to assign storage spaces to products and finally policies used to retrieve products.
3.1
Warehouses
In current days a warehouse is one of the major parts of a supply chain of many companies. The recent book ofBartholdi and Hackman (2014) and the literature review of Gu et al. (2007) ar-gue that one of the main reasons behind the rationale of having a warehouse is to create a better match between supply and demand. Especially in retail markets where surges in demand can be very high, those peaks would be very difficult to respond without stockpiled products. Moreover, warehouses can have the opposing effect, if there is a collapse in demand a warehouse can provide space and buffer to slow or hold inventory back. So one function of a warehouse is to quickly respond to demand changes or, more generally, variability in the supply chain. Another reason that is pointed in the previous works for having a warehouse is to reduce transportation by con-solidating orders from suppliers and also by concon-solidating orders from downstream points in the supply chain.
Warehouses are a part of the supply chain, as all the products flow through the supply chain they also flow on the warehouse. In this flow a Stock Keeping Unit (SKU) is the smallest physi-cal unit that is tracked. Usually in the upstream part of the supply chain products are handled in larger quantities, pallets or boxes which have to be broken down as they flow downstream. Ware-houses are usually one of the places where the broken down of the large quantity received from the supplier takes place.
16 Warehouse Science
In their workde Koster et al. (2007) classify the main function of a warehouse as buffering and storage. Additionally distribution could also be a major function, in those cases distribution center is the most commonly used classification. Whereas in case the major focus is picking the term warehouse is the most commonly used, even when applied to distribution centers. Taking this in account in this thesis the most proper definition is warehouse instead of distribution center.
3.2
Warehouse Operations
To describe the main operations of a warehouse two important works are ofBartholdi and Hack-man (2014) andde Koster et al.(2007) where they describe the four main operations that occur inside a warehouse: receiving, put-away, order-picking and shipping, two of them can be classi-fied as part of the inbound processes (receiving and put away) and other two can be classiclassi-fied as outbound processes (order-picking and shipping).
Receiving is the first activity carried when an order from a supplier arrives at the warehouse, it includes unloading the products from the transporter, update the product quantity on the warehouse record and perform an inspection to see if there are inconsistencies in term of quantity, quality or even information.
The put-away operation refers to the process in which a storage position is assigned, or re-assigned, to a product which afterwards is moved to that position. Accordingly toBartholdi and Hackman(2014) the put away operation is extremely important because determines the future cost of retrieving the product, and also how quickly it will be to retrieve it. Additionally, every time a product is put-down it means it must be picked up again later, either by going to another put-away process or an order picking.
Order-picking, as the name indicates, is not only the activity of going to a position and retriev-ing a SKU to fulfill an order, it also includes the process of clusterretriev-ing and schedulretriev-ing pickretriev-ing tasks and updating the inventory. This is usually the most time consuming and labor intensive operation inside a warehouse.
The last operation that a product undergoes inside a warehouse is shipping, usually shipping is the inverse process of receiving, except that prior to loading the truck usually that is a packing stage where products are consolidated into fewer containers (cases, pallets).
3.3
Layout
The layout design inside a warehouse has two sub-problems (de Koster et al.(2007)): the layout of the facility containing the order-picking system and the layout within the order-picking.
The first sub-problem, usually called as the facility layout problem, concerns with where to locate various areas of the warehouse and the objective is commonly to minimize the total han-dling cost. Frequently, the problem’s objective is represented as a linear function of the traveling distance. Heragu et al.(2005) proposed an approach to solve this problem using a mathematical
3.4 Picking policies 17
model that outputs for each zone the area needed as well as the flow (cross-docking, forwards-reserve, forward) that each product as to be allocated.
The second sub-problem is called as the internal layout design or aisle configuration problem. It concerns the determination of the number of blocks and the number, length and width of the aisles in each block. Similar to the last problem the objective function usually is to minimize the travel distance. Caron et al.(2000) presents an analytical approach to this problem in a low-level picker-to-parts warehouse (explained in section3.4) where the main system parameters are: aisle length, the number of picks per tour and the shape of the COI-based ABC curve.
3.4
Picking policies
de Koster et al. (2007) also reviews the most common objective of order-picking systems, the maximization of the service level provided by the warehouse subjected to its resource constraints. Taking in account a variety of factors as the order delivery time, order integrity and accuracy.
There are multiple order-picking methods which can be classified by whether the warehouse employs humans or not for the order-picking tasks (de Koster(2008)). Among the various methods the most common is the picker-to-parts system where the order picker walks or drives along the storage aisles to pick items. There are two types of picker-to-parts systems, low-level picking and high-level picking. In low-level picking systems the order picker travels along the storage aisles retrieving items from storage racks or bins. High-level picking system have the order picker traveling to picking positions on board of a lifting order-pick truck or crane and when in front of the picking position the order picker performs a pick1.
de Koster et al.(2007) further study alternative picking policies. When creating order-picking tasks it is needed to decide if all orders will be treated individually or not. The single order picking policy, as the name indicates, only deals with picking the products that are included in a single order on a picking tour. The main advantage of this policy is that it will reduce the picking errors that can occur when dealing with multiple orders at the same time, but this is done at the expense of increasing the total travel time. Usually, single order picking policy are only used when the orders that arrived are relatively large.
The opposite of the single order picking policy is order batching policy which is the method of grouping a set of orders into a number of sub-sets and each sub-set can be retrieved in a single picking tour. When creating a sub-set there are two main criteria for batching: proximity of picking positions or time windows. When performing proximity batching each sub-set of the batch is created based on the proximity of the SKUs to be picked. Time window batching is creating the sub-set of storage positions to be visited based on a time interval that can be, e.g. when were the orders placed or even the shipping time windows of the warehouse when it has more than one. To understand the effects that batching can have on the global performance of the warehousePetersen and Aase(2004) tested the multiple warehouse picking policies. The authors claim that batching has the largest impact on reducing total fulfillment time, especially when the
18 Warehouse Science
orders from customers are small. However, one important note is the assumption that even though the orders were batched it was possible to maintain the individual integrity of each one, if it was not the case the sorting operation need afterwards could make the saved time disappear on this extra operation.
3.5
Storage assignment
Storage assignment is the process of assigning incoming products to storage positions in storage departments or zones, it is very tightly related to the put-away operation. Gu et al.(2007) gives a good insight on how to understand the storage position assignment problem being that the main objective of this policy is trying to reduce material handling cost and improve space utilization. The authors divided this problem into three categories:
• Storage position assignment problem based on item information - assumed that complete information about arrival time and departure time of an individual product is known; • Storage position assignment problem based on product information - only product
informa-tion is known and usually storage posiinforma-tions are assigned within product classes;
• Storage position assignment problem based on missing information - no information is avail-able on the characteristics of arriving items.
de Koster et al. (2007) details storage assignment policies. The forward-reserve allocation where the bulk stock is separated from the pick stock creating a restricted picking area. Therefore, giving origin to a smaller picking area with lower expected travel times. The random storage where a product is assigned to a position from all eligible positions with equal probability. A method that is close to the random storage is the closest open storage position where the closest empty position that is encountered is used to store the products. The opposite method of the random storage method is the dedicated storage where every product has a fixed position even if it is out of stock. Gu et al.(2007) emphasizes the storage position assignment problem based on product infor-mation, often the more common scenario that is faced by a warehouse. At the arrival of a new product a product class is assigned based on its characteristics and storage positions are assigned to product classes. Usually inside a product class simple rules are applied to assign products to positions such as the nearest free position or random position. In the presence of product classes the assignment problem assigns a product to a class. Having storage classes defined now the need is to assign each class to a storage position. Chan and Chan(2011) studied the impact that some storage assignment policies can have and the authors found that an ABC horizontal class based storage can reduce the overall travel time to retrieve orders compared to a random storage policy. Petersen and Aase (2004) further claim that if batching cannot be considered ABC class-based storage requires significantly less picker travel than random storage, at the trade-off of possibly having more picker congestion within an aisle.
3.6 Zoning 19
To assign storage position to classes the three most frequent used criteria are (Gu et al.(2007)): popularity, maximum inventory and the Cube-Per-Order Index (COI).
Popularity of a given product is defined by number of storage or retrieval operations per unit of time. Classes with the highest popularity are assigned to the most desirable positions. One major issue with popularity is when there is a wide range of sizes and a product can be classified as popular when it just has a higher volume than other products and consequently more storage and retrieval operations.
The maximum inventory policy is defined according to the space that is required to allocated to a product class. Classes are ranked by increasing order of inventory space and classes with the lowest maximum inventory space are assigned to the best positions. The major drawback of this policy is when a class that will sell a large quantity but will also receive a large quantity can be assigned to a disadvantageous position.
The Cube-per-Order Index (COI), was first introduced in the work of Heskett (1963) and onHeskett(1964) is defined as the ratio between the maximum allocated storage space and the number of storage/retrieval operation per unit time. It is a combination of the last two policies because it takes into account the popularity and the space required. Using COI, classes are ranked by its increasing value and classes with the lowest COI are stored in the most desirable positions.
There is research that proves that the COI policy is optimal in minimizing the material handling cost, the first work on this matter wasKallina and Lynn(1976). The work ofCaron et al.(2000) presents a model that compares the average travel distance when doing an order picking task in a random storage policy or in COI-based ABC storage policy. The results show that as the number of picks increase on a task the benefits of a COI based policy increase as well.
3.6
Zoning
de Koster et al.(2007) andGu et al.(2007) provide a insight into the concept of zoning but both works claim that the literature regarding this subject is very limited. Zoning is an alternative to single order picking by dividing the order picking area into zones. Thus, in each zone a part of an order will be picked. The main advantage of zoning is the fact that each order picker has to traverse a smaller area. The main disadvantage of zoning is that the order needs to be split and need to be consolidated again before shipment to the customer. There are two approaches to complete an order when using zoning. The first is progressive assembly. On this approach one order picker starts on the order inside his zone and when he finishes, a different other picker continues with picking the order, this system usually is called as pick-and-pass. The second approach is parallel picking where a number of order pickers start working on one order each one inside a different zone. As soon as all of the parts of the order are finished they are merged.Le-Duc and de Koster (2005) present a model to define the optimal number of zones in a pick-and-pack order-picking system where the objective is to minimize the time that takes to fulfill an order when using the parallel approach.
20 Warehouse Science
3.7
Comparison
The warehouse subject of study of this work, as discussed in the previous chapter, classifies their SKUs in classes that are related both to the order picking method that is used inside each zone and the type of products that they belong, but inside each class the policy used is the nearest free position. The COI policy if used on a product level can be possible give good results to the each zone of SKUs because it only requires product information that is available at the time that a SKU enters the warehouse.
The warehouse under study in this work combines a mix of zoning and product based classes, this is mainly because zoning is used to divide the warehouse in smaller picking areas to reduce the average travel time, but it also contains characteristics of a product based classes as it was previously mentioned in the last section. The zoning method used on the warehouse is the parallel picking, because it is possible that an order could be picked in more than one zone at the same time. The additional effort to assemble because of the use of this method is performed by the case sorting machine.
Chapter 4
The SOS Methodology
In order to improve picking performance was developed a methodology that combines simulation and optimization. Each step has a main objective which is:
• First Simulation has the objective of validating the simulation model as well as characterize the picking parameters that are going to be used throughout the model;
• Optimization is used to assess how a new storage assignment policy would impact the aver-age time required to complete an order-picking task;
• Last Simulation has the purpose of testing the new storage assignment policy under uncer-tainty regarding SKU information.
4.1
Describe Warehouse Zones
To define the parameters that best describe the warehouse a simulation model that would reproduce the warehouse operations, that would be impacted with a change on the storage assignment policy, to the best was developed.
These operations are the storage assignment policy, the picking tasks, and the order-picking activity. Figure4.1gives a global overview of how those the simulation model work. The reason to only compare the time to complete all tasks instead of the actual productivity KPI, is because the quantity picked is always the same, hence only the simulated time will differ from the actual time.
There are two types of data fed into the simulation model, the first type are parameters that do not change throughout the simulation run. Such parameters are: the current zone being simulated, the point that a picker delivers the order-picking task after completion, the average travel speed of an order-picker, the fixed time that an order-picker takes to retrieve SKUs, the initial zone stock, the SKUs that are stored on each day, the position where each one is stored and also the order-picking tasks that were created by the WMS system. Table4.1 shows a brief explanation of all the inputs and the frequency that the simulation model reads each one from the database. On the
22 The SOS Methodology
Picker speed
Picking Time
Discrete Event Simulation
Order-picking tasks
Receptions
Current storage positions
Time to complete all tasks
Figure 4.1: Global overview of the first simulation model
end of each day the simulation model returns the time it took to complete all tasks with the tested picker speed and picking time.
Table 4.1: Inputs of the first simulation model
Input Characteristics Frequency
Zone Zone currently being simulated Startup
Drop point Place where the picking tasks end Startup
Picker speed Speed at which each picker travels Startup
Picking time Time to retrieve an item from a position Startup
Number of pickers Quantity of order-pickers Startup
Initial inventory SKUs and their initial stored quantity Startup SKUs received SKUs store and assigned storage position Daily
Tasks Order-picking tasks of each day Daily
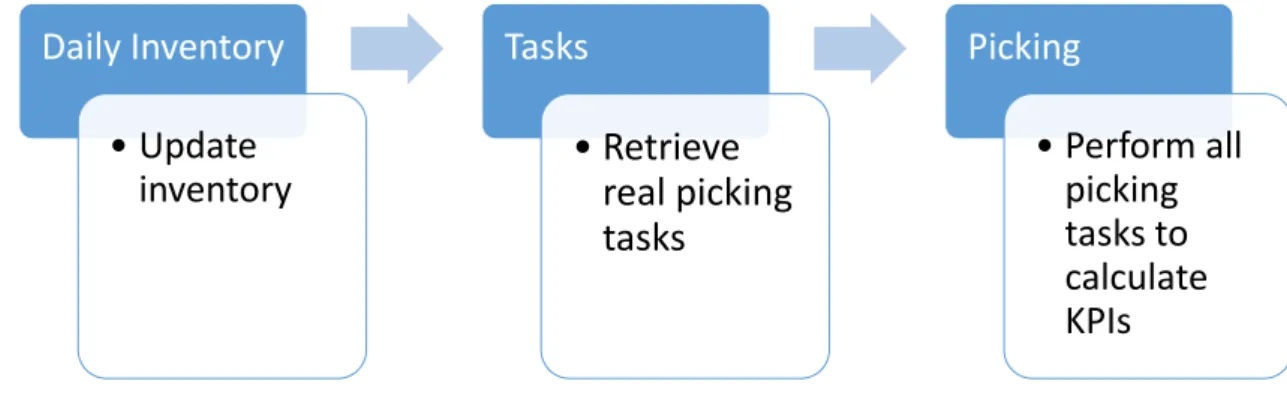
The simulation of a zone consists in 3 majors events per day. The first event is the reception, SKUs that have entered in the warehouse on each day are stored in the same position as the actual warehouse operation. The event that follows is to create the exact same order-picking tasks as the ones used on the warehouse. The final event is the execution of the order-picking tasks, this is the major task of the simulation model and the one that consumes more time. When the last task of the day is performed the total picking time for the day is stored on the database for comparison reasons.
When a new SKU enters the warehouse, in the simulation, one of the properties that it comes with is the storage position that it must go to, this applies for SKUs that go to storage positions or to those that go to reserve positions. Afterwards, when all products are in the correct storage
4.1 Describe Warehouse Zones 23
Daily Inventory
• Update
inventory
Tasks
• Retrieve
real picking
tasks
Picking
• Perform all
picking
tasks to
calculate
KPIs
Figure 4.2: Events that occur on each day of the simulation
position the order-picking task are read and start being performed. When an order-picking task is waiting to be picked it is on a queue and only leaves when there is an order-picker that is not performing other picking task. Now that the picking task has an order-picker associated to it, this worker will visit each picking position in the same order that is on the order-picking task taking also a small time on each position to retrieve the product. Finally when all the picking have been made the task goes to the drop point of the zone being simulated and when it arrives the order-picking task is ended and the time it took to be performed is added to the total daily time. The order-picker now starts a new task, if there is one, and the process is repeated for all tasks. A summary of this logic is shown on Figure4.3.
Go to SKU Location Pick SKU Is it the
last SKU? Go to drop point
Yes
No
24 The SOS Methodology
4.2
Optimizing Zone Layout
In order to select the best storage assignment policy an analytical model was developed to estimate the tasks travel time inside each zone based on: order size, storage assignment policy, zone con-figuration and picker capacity. The model output is based on the estimation of the travel distance inside the zone. This allows for a comparative analysis between alternative picking assignment policies.
Below the indexes, parameters, variables and different domains used in the model are intro-duced. c=1 c=2 c=3 c=4 c=5 c=6 c=7 c=8 c=9 c=10 k=1 k=2 k=3 k=4 a=1 a=2 a=3 a=4 a=5 a=6 a=7 a=8 a=9 a=10 a=11 a=12 a=13 a=14 a=15 a=16 a=17 a=18 a=19 a=20 a=24 a=23 a=22 a=21 a=25 a=26 a=27 a=28 a=32 a=31 a=30 a=29 a=33 a=34 a=35 a=36 a=40 a=39 a=38 a=37 𝑙 𝑒
Figure 4.4: An example of a layout
Indices
a aisle: a ∈ {1, . . . , A}
c group of aisles: c = {1, . . . ,C} k level of an aisle: k = {1, . . . , K} t task number
Figure4.4depicts the layout used in the model. A given aisle a is defined by a group of aisle c and a level k. It is possible to see in the figure that all aisles that belong to domain D have a
4.2 Optimizing Zone Layout 25
Variables
T full length of the picking tour (in meters)
Ra number of SKUs retrieved on a given task when reaching aisle a time total travel time (in seconds)
Parameters
p(Ea) probability of a picking operation being performed in aisle a
C number of group of aisles
K number of levels
l length of an aisle (in meters)
e distance between group of aisles (in meters) v average speed of a picker (in m/s)
N size of the task in number of SKUs
Order number of SKUs not yet retrieved in a order-picking task Cap picker capacity in number of SKUs
pick time required to retrieve a product from a picking position (in seconds) Domains
D every a that belongs to a group of aisles c: c is odd I every a that belongs to a group of aisles c: c is even
similar order-picker flow and on domain I are all the aisles that flow on the opposite direction, as the arrows on the end of each aisle group represent.
The main objective of this model is to perform an effective analysis on the expected travel time (or distance) for a given task of size N with an area of picking of C group of aisles with K levels and estimate how different picking assignment policies perform. To do so, a storage assignment policy is defined by the proportion of picking operations that will take place in each aisle a. Note that the tour of the picking tasks follows the order of the aisles depicted in Figure4.4.
The picking assignment policies comparison is based on the expected tour length for each alternative. To calculate the expected tour length the first step is to calculate the probability of visiting an aisle. To this purpose consider Ea to be the event of a picker performing at least one picking operation in aisle a, Va to be the event associated with entering aisle a and not doing any picking operation, because a is the part of the shortest path to the next aisle with a picking operation, and finally, Sawhich is the event of visit aisle a. This means that Sa can be split into two cases: having to do at least a picking operation on the aisle Eaor despite no picking operation occurs in the aisle, it is part of the shortest path to the next aisle with a picking operation Va.
P(Sa) = P(Ea) + P(Va) (4.1)
Equation (4.1) defines the probability of a given task passing trough a aisle by summing the probability of the task having at least one picking operation on that aisle and the probability of
26 The SOS Methodology
entering the aisle even without having a pick. The next step is to understand how to define these probabilities. Because of the antagonistic relation between Eaand Vathe latter will be defined by the first one. With this in my mind the next logical step is to defined how likely a given task is of having at least one pick on an aisle.
P(Ea) = 1 − [1 − p(Ea)]N (4.2)
Equation (4.2) defines the probability of the aisle a having at least one item among the N items of the task. With P(Ea) defined is also possible to determine the probability of entering the aisle even without having a pick. Recall that when no picking occurs in the aisle, it is only transversed if it is part of the shortest path to the next aisle with a pick. Therefore, consider P(Ea, Ea0) to be
the probability of going directly from aisle a to aisle a0, in other others the probability of having the next picking operation in aisle a0given that the last occurred in aisle a.
P(Ea, Ea0) = a0−1 ∏ j=a+1 P(Ej) · P(Ea0) if a < a0 0 otherwise (4.3)
Equation (4.3) specifies the probability of after performing a picking operation in aisle a the next picking operation being in aisle a0. The only case when the picker moves from aisle a to aisle a0 to perform a picking operation is if all aisles in between a and a0, not including both of them, do not have a product on the current order-picking task and a0has a product that has to be picked. Looking at Figure 4.4can help to understand the reasoning behind this equation. If a = 11 and a0= 14 this means that both aisles 12 and 13 do not have to be visited on this order-picking task and aisle 14 has.
To fully define P(Va) there are multiple scenarios which have to be considered and whose distance has to be taken in account. As previously mentioned, each aisle has only one way that the order-picker can travel, because of this fact, and as it will be explained below, the second part of equation (4.1) needs to be split since the conditions of when an aisle is visited (because it is part of the shortest path) when it does not have an order-picking task are related to the flow of the last aisle with a pick, also to the aisle that needs to be traversed and, finally, to the flow of the aisle where the next product of the task is. Hence, it is needed to differentiate between group of aisles because the conditions for passing inside an aisle are different depending the way of the aisle is transversed.
P(Va) = Pdd(Va) + Pid(Va) + Psd(Va) , ∀ a ∈ D (4.4) Equation (4.4) divides P(Va) into three cases where you can pass in aisle a, when a is an aisle that belongs to D, without having an item to be picked. The three cases will be explained below.
Pdd(Va) =
∑
m∈D : m<a k<k0 c=c0 P(Em)[∑
( j∈D ∧ k>k0∧ c≥c0) ∨ ( j∈I ∧ k≥k0∧ c>c0) P(Em, Ej)] (4.5)4.2 Optimizing Zone Layout 27 c=1 c=2 c=3 c=4 c=5 c=6 c=7 c=8 c=9 c=10 k=1 k=2 k=3 k=4 a=1 a=2 a=3 a=4 a=5 a=6 a=7 a=8 a=9 a=10 a=11 a=12 a=13 a=14 a=15 a=16 a=17 a=18 a=19 a=20 a=24 a=23 a=22 a=21 a=25 a=26 a=27 a=28 a=32 a=31 a=30 a=29 a=33 a=34 a=35 a=36 a=40 a=39 a=38 a=37
Figure 4.5: 3 different cases where an aisle can be visited when it does not have an order-picking task and belongs to domain D
The previous equation defines the probability of passing in aisle a when the previous pick was in an aisle that belongs to D on a lower level and on the same aisle group as a and the next item is on an aisle that belongs to D on a higher level than the aisle a or it is on an aisle that belongs to I on an equal or higher level on a next group of aisles. Figure4.5 shows an example of this situation when aisle 11 can be transversed without having a picking operation to be perform there are depicted. Two situations are presented: (1) the previous picking operation was on aisle 10, and afterwards the order-picking task travels to aisle 20 which belongs to domain D which is on a higher level than 11 (green path); (2) the next picking operation is on an aisle of domain I on an equal or higher level on a next group of aisles which is illustrated by the order-picking task going to aisle 13 after 10 (red path).
Pid(Va) =
∑
m∈I : m<a k≤k0 c=c0−1 P(Em)[∑
( j∈D ∧ k>k0∧ c=c0) ∨ ( j∈I ∧ k≥k0∧ c=c0+1) P(Em, Ej)] (4.6)Equation (4.6) defines the probability of crossing aisle a when the previous pick was on an aisle that is on domain I and in the previous aisle group. The next aisle to be visited is an aisle that is of higher level than a, when a belongs to D, or it is an aisle that belongs to I and must be