LUCAS FINAMOR
QUALITY OF EDUCATION AND HUMAN CAPITAL DECISIONS:
EXPERIMENTAL EVIDENCE FROM BRAZIL
S ˜AO PAULO 2017
LUCAS FINAMOR
QUALITY OF EDUCATION AND HUMAN CAPITAL DECISIONS:
EXPERIMENTAL EVIDENCE FROM BRAZIL
Dissertac¸˜ao apresentada `a Escola de Economia de S˜ao Paulo da Fundac¸˜ao Getulio Vargas como requisito para obtenc¸˜ao do t´ıtulo de Mestre em Economia de Empresas
Campo de Conhecimento:
Microeconometria – Economia da educac¸˜ao Orientador: Prof. Dr. Bruno Ferman
Coorientador: Prof. Dr. Andr´e Portela Fernandes de Souza
S ˜AO PAULO 2017
Finamor, Lucas.
Quality of education and human capital decisions : experimental evidence from Brazil / Lucas Finamor. - 2017.
56 f.
Orientadores: Bruno Ferman, André Portela Fernandes de Souza Dissertação (mestrado) - Escola de Economia de São Paulo.
1. Escolas - Organização e administração. 2. Eficácia no ensino. 3. Capital humano. I. Ferman, Bruno. II. Souza, André Portela Fernandes de. III.
Dissertação (mestrado) - Escola de Economia de São Paulo. IV. Título.
QUALITY OF EDUCATION AND HUMAN CAPITAL DECISIONS:
EXPERIMENTAL EVIDENCE FROM BRAZIL
Dissertac¸˜ao apresentada `a Escola de Economia de S˜ao Paulo da Fundac¸˜ao Getulio Vargas como requisito para obtenc¸˜ao do t´ıtulo de Mestre em Economia de Empresas
Campo de Conhecimento:
Microeconometria – Economia da educac¸˜ao Data de aprovac¸˜ao
/ /
Banca Examinadora:
Prof. Dr. Bruno Ferman (Orientador) FGV-EESP
Prof. Dr. Andr´e Portela Fernandes de Souza (Coorientador)
FGV-EESP
Prof. Dr. Vladimir Ponczek FGV-EESP
Prof. Dr. Ricardo Paes de Barros Insper
S ˜AO PAULO 2017
A minha fam´ılia, por n˜ao medir esforc¸os para me apoiar em meu caminho. Tudo que sou ´e grac¸as a vocˆes.
A Ana Carolina, por todo o suporte, amor, carinho e forc¸a nesta e nas pr´oximas jornadas. A meus orientadores, Bruno Ferman e Andr´e Portela, pela dedicac¸˜ao e orientac¸˜ao cuidodosa. Obrigado por todo o conhecimento compartilhado comigo.
A Ricardo Paes de Barros e ao Instituto Unibanco pela geneorisade em compartilhar comigo os dados do experimento e ao INEP pela cooperac¸˜ao com os seus dados.
A meus amigos que sempre estiveram ao meu lado, em especial a Lycia Lima, Vinicius Lima, Eduardo Ferraz, Dalila Figueiredo, Victor Chagas, Lara Vilela e Sammara Cavalcanti.
This study makes use of the “Jovem de Futuro” program, an experimental intervention in Brazilian public high schools, to estimate the impact of quality of education on college and labor market en-try. Our results indicate that high school students respond with more and better college enrollment after an increase in the quality of high school education. A better high school environment boosts the probability of students (i) to attend college, (ii) to be accepted into public colleges and into high quality and selective majors, (iii) and to be studying full time. These effects seem to be inter-mediated with admission through affirmative action policies (quotas). A reduction in working and only working (not studying) status is also detected. These results can be interpreted as suggestive evidence of the existence of credit constraints or heterogeneity in the returns to schooling function. Key-words: Quality of education, human capital investment, college attendance, labor market decisions
Este estudo utilizar o programa “Jovem de Futuro”, uma intervenc¸˜ao experimental em escolas bra-sileiras de ensino m´edio, para estimar o impacto da qualidade da educac¸˜ao no acesso ao ensino superior e ao mercado de trabalho formal. Nossos resultados indicam que os alunos de ensino m´edio respondem com mais e melhores matr´ıculas no ensino superior ap´os um aumento na qua-lidade da educac¸˜ao no ensino m´edio. Um ambiente escolar melhor aumenta a probabiqua-lidade dos estudantes em (i) ir para o ensino superior, (ii) ser aceito em universidades p´ublicas e em cursos de alta qualidade e seletivos, (iii) de estarem estudando em tempo-integral. Estes efeitos parecem ser intermediados pela admiss˜ao ao ensino superior atrav´es de pol´ıticas de ac¸˜oes afirmativas (cotas). Uma reduac¸˜ao nas opc¸˜oes de trabalhar e apenas trabalhar (n˜ao estudar) tamb´em s˜ao detectadas. Estes resultados podem ser interpretados como evidˆencias sugestivas da existˆencia de restric¸˜ao `a cr´edito ou de heterogeneidade nos returnos `a educac¸˜ao.
Palavras-chave: Qualidade da educac¸˜ao, investimentos em capital humano, acesso ao ensino superior, decis˜oes de mercado de trabalho
1 ENEM’s test scores at school level (baseline year) . . . 20 2 Quality-selectiveness measure distribution — Public x Privates (2015) . . . 35 3 Datasets . . . 49
2.1 Randomization and Non-compliance . . . 17
2.2 Baseline balance . . . 19
3.1 ENEM’s enrollment . . . 22
3.2 Descriptive Statistics . . . 24
3.3 Selection . . . 26
4.1 ENEM’s test scores . . . 29
4.2 School-labor decisions — PNAD 2011 . . . 30
4.3 College and Labor access . . . 31
4.4 College effect by each year after high school completion . . . 32
4.5 College administration and selection process . . . 33
4.6 Measure of quality and selectiveness of college-majors . . . 35
4.7 College quality and selectiveness . . . 36
5.1 Main effects - Heterogeneity by baseline proficiency (Prova Brasil) [1] . . . 39
5.2 Main effects - Heterogeneity by baseline proficiency (Prova Brasil) [2] . . . 40
B.1 Main effects - Heterogeneity by gender [1] . . . 50
B.2 Main effects - Heterogeneity by gender [2] . . . 51
C.1 Baseline balance [1] . . . 52
C.2 Baseline balance [2] . . . 52
D.1 Main effects - Alternative dataset (ENEM) [1] . . . 53
D.2 Main effects - Alternative dataset (ENEM) [2] . . . 53
D.3 Main effects - Alternative dataset (ENEM) [3] - Heterogeneity by baseline proficiency 54 E.1 Main effects - Alternative dataset (SP) [2] . . . 55
E.2 Main effects - Alternative dataset (SP) [2] . . . 55 E.3 Main effects - Alternative dataset (SP) [3] - Heterogeneity by baseline proficiency . 56
1 Introduction 13
2 “Jovem de Futuro” Program 16
3 Data and Econometric Strategy 21
3.1 Data . . . 21
3.2 Empirical Strategy . . . 25
4 Results 28 4.1 ENEM’s test scores . . . 28
4.2 College and Labor Market access . . . 29
4.3 University category and admission process . . . 31
4.4 College quality and selectiveness . . . 34
5 Heterogeneity 38 5.1 Baseline Proficiency . . . 38 5.2 Gender . . . 41 6 Additional Exercises 42 7 Conclusion 44 A Appendix A Datasets 49 B Appendix B Heterogeneity by Gender 50 C Appendix C
Baseline balance — Prova Brasil 2009 - RJ, SP and VP areas 52 D Appendix D
E Appendix E
1 Introduction
The relationship between returns to education and schooling decisions is a cornerstone for the field of labor economics. The theoretical models looking for a rationalization of human capital investments were first developed in the sixties and seventies with Becker (1962), Ben-Porath (1967) and Mincer (1974), whose contributions are highly influential until today. In these approaches, schooling decisions were typically considered as the years of formal education acquired by an individual and, in general, no measure of education quality was not taken into account. Behrman e Birdsall (1983) made one of the first theoretical attempts to include quality of education in the mincerian equation. Based on the heterogeneity of quality across regions, their model predicts that the rate of returns to education is conditional on school quality, both being positively correlated. Moreover, in equilibrium, individuals who perceive higher returns to education also choose more years of schooling.
Several studies have tried to empirically estimate the causal impacts of a better schooling envi-ronment. The most common challenges these studies have to overcome are, in general, (i) to obtain an objective measure of education quality, (ii) to find a clear identification with a credible exoge-nous variation of schooling quality and (iii) to link adult outcomes with data on education. In this research, we try to overcome these challenges by using a randomized control trial (RCT) in Brazil called “Jovem de Futuro”(Youth of the Future). The program has been running since 2008, aiming at improving the quality of education in public high schools through improving management practices and allocating grants to the treated schools. Given the significant impacts on students’ proficiency uncovered by several previous evaluations (SILVA, 2010; BARROS et al., 2012; OLIVA, 2014) and the RCT structure of the program, we consider it as an exogenous shock of educational quality on those beneficiary schools and investigate the effects on students’ labor market outcomes and higher education decisions.
The existent literature faced these challenges with different strategies. Some works used the experimental evidence from the STAR experiment1, and positive effects of reduction in class size
were found in the probability of students (i) to take a college-entrance exam (KRUEGER; WHIT-MORE, 2001), (ii) to attend college and high-quality colleges (CHETTY et al., 2011), and (iii) to attend college, entering college on time and to earn a college degree (DYNARSKI; HYMAN; SCHANZENBACH, 2013). Other authors also made use of class size as a measure of educational
1Details can be found in Krueger e Whitmore (2001), Chetty et al. (2011) and Dynarski, Hyman e Schanzenbach
quality and encountered positive effects on the decision to remain in school beyond the age of 16 (DUSTMANN; RAJAH; SOEST, 2003) and on increasing the years of completed education (FREDRIKSSON; ¨OCKERT; OOSTERBEEK, 2013). Moving the focus to teachers rather than schools’ inputs, Dearden, Ferri e Meghir (2002) use the pupil-teacher ratio in England to assess its impact on adult outcomes and only find effect on wages at age 33, whereas no effect on human cap-ital decisions is detected. Chetty, Friedman e Rockoff (2014), using a measure of value-added by teachers, reveal impacts of quality of education in college attendance and wages. Lavy (2016) ex-plores experimental data on teachers’ incentives and finds positive impacts of a teachers’ incentive mechanism on years of schooling, enrollment in university, employment and earnings.
Other researchers took advantage of the high-quality American charter schools that used student lotteries to determine which students were admitted in oversubscription situations. The estimated effects are increasing the quality, but not necessarily the quantity of college attendance (DOBBIE; JR, 2015; ANGRIST et al., 2016), increasing student proficiency, the probability of taking SAT and students shifting from 2-years to 4-years college (ANGRIST et al., 2016). Deming et al. (2014) also use high-quality schools with oversubscription and lotteries to reveal impacts of higher quality schools on the probability of high school graduation, post secondary attendance and degree com-pletion.2With our strategy, we are closer to these last works, however instead of assigning students
to better schools, we exploit an exogenous shock at school level.This way, we contribute to the literature estimating the effects of increasing quality in a given set of schools. While confound fac-tors such as peer composition and geographical changes could be associated with the literature’s previous results, our findings are closer to an exogenous quality shock for the students attending the same schools with the same peers. The evidence on improving the quality of schools is clearly distinct from the impact of assigning students to high-quality schools. The differences are relevant from both the Economics and policy perspectives.
We are also adding to the literature evidence on a developing country, where the labor-college decision has a much more importance than in developed countries. Barro e Lee (2013), using edu-cational data from 146 countries, point out how higher education enrollment is much lower in the developed countries: in average 10.5% of the population over 15 years old, while in the developed countries this average is more than three times higher: 32.2%. Using the Brazilian household sur-vey (PNAD) in 2014 we can also picture this argument in the country: among the adults aged 30 to 35 that completed high school, who are likely to have already finished the schooling investments, almost 59% did not progress to college. No more than 28% earned a college degree. The decision to simultaneously work and study is also very common. Among the individuals studying, more
2There is also experimental evidence from programs that combine education, health and other interventions such as
the Head Start and Perry school programs. Since we are exclusively trying to estimate the causal impacts of quality of education we are not relating to this literature.
than 27% aged 15-18 (high school) study and also work. Considering the students expected to be in college, aged 19-22, this proportion reaches more than 40% (from PNAD 2014).
Lastly we have a highly diverse sample. The schools within the experiment are located in several different Brazilian municipalities and states. The initial quality-level is also very diverse, the sample comprises schools ranked along the entire distribution of proficiency in the National Exam of Upper Education (ENEM), which reduces the concerns about the external validity of our results.
In this paper we can assess how high school students in developing countries respond to the decision of continuing to invest in formal human capital (attending college), going directly to the labor market or acquiring both education and market experience at the same time. We find that freshman high school students in the initial year of the program, that are supposed to receive three years of treatment, are more likely to attend college. The effect is more than 3 percentage points (hereinafter pp), and significant for at least the first three years after high school completion. This corresponds to 7.5% increase in college attendance. The probability of being admitted to public col-leges3(1.8 pp), to only study (1.7 pp) and to attend high-quality colleges (3.6 pp) are also increased. This effect of access on higher education seems to be enabled through the use of affirmative actions such as quotas to public school students (1.4 pp). A reduction in the probability of only working individuals is also detected, specially for men (-4.5 pp).
Therefore, students in Brazilian public schools are responding with more and better college enrollment after an increase in the quality of high school education. This is in line with the pre-vious findings and the theoretical predictions. With this results we also commune with Angrist et al. (2016) and Lavy (2016) regarding how interventions in high school may produce positive effects and be cost effective. Reasonably, high schools interventions may not be too late. Addition-ally, these results could be driven by the expansion of the returns to schooling function or by the existence of credit constraints.
The next sections explore the details of the Program Jovem de Futuro (section 2) and present the data and econometric strategy (section 3). Section 4 presents the results on college and labor decisions, college admission and selectiveness while section 5 explores heterogeneity in the results by baseline proficiency and gender. Section 6 assess the sensitiveness of the results with alternative datasets and brief comments on the main findings conclude the article (section 7).
3As will be detailed later, in Brazil, public colleges are associated with an overall better reputation than the private
2 “Jovem de Futuro” Program
Jovem de Futuro is an initiative of the Instituto Unibanco1 (Unibanco Institute) that has been implemented in Brazilian public schools since 2008 in partnership with the states’ secretariat of education. The aim is to improve the quality of education and to reduce the school dropout rates in high school. The intervention is three years-long, which is exactly the expected time for a student to complete high school. So, in each school there is a cohort that receives the full treatment for three years.
The program can be characterized by two pillars: (i) conditional cash transfers and (ii) tech-nical support for school management. Each treated school receives an amount of R$ 100.00 (US$ 48.00) per student-year2 as a conditional cash transfer. The conditions are to improve the students’ proficiency in a standard-based exam applied by the Institute at the end of each school year and to implement a participatory budget process in the school (BARROS et al., 2012). The expenditures are a discretionary choice of the school’s principal, but the resources allocation has to follow some rules: no more than 40% can be used in infrastructure and at least 20% should be used in incentive mechanisms to teachers and students (20% for each group) (ROSA, 2015). The second element of the program is the focus on school management: there is a transfer of management technologies3 and the participation of students, students’ parents and all school staff is stimulated. Agents from the Instituto Unibanco supervise the implementation of these new technologies and keep track of schools once a week.
The first phase of the program took place in the states of Minas Gerais (MG) and Rio Grande do Sul (RS). The treated schools received the program in 2008-2010 while the control group re-ceived the treatment immediately after the treatment group: 2011-2013. The second phase selected schools from two different states: Rio de Janeiro (RJ) and S˜ao Paulo. In the latter the program was implemented in two different areas: the metropolitan region of S˜ao Paulo (SP) and Vale do Para´ıba (VP). The second phase intervention started in 2010 for the treated schools and in 2013 for the control group. Hereinafter we will refer to these localities (MG, RS, RJ, SP and VP) as the five areas where the experiment was implemented.
1The Instituto Unibanco is a private organization founded in 1982 whose goal is to improve the quality of public
education in Brazil.
2The rule that determined the amount of resources had a slight change from phase 1 to phase 2, in the first the
number of students considered was the total number of students in school, meanwhile in the second phase only the number of students at high-school was considered but a minimum transfer of R$ 100,000 yearly was guaranteed for all schools. For details please check Rosa (2015).
At each locality, state public schools could freely subscribe to the program, knowing in advance the programs’ structure and also its experimental design4. The assignment to treatment and control
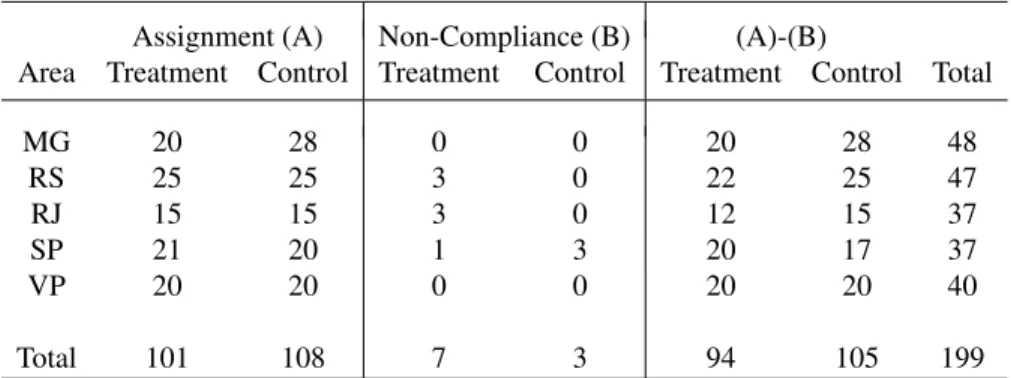
was completely at random, using pairwise randomization, with stratification at school localization, number of students and proportion of students in high school. In the state of Minas Gerais the randomization procedure had minor differences: in this state the number of control schools was larger than that of treatment schools, henceforth, strata with few schools were created instead of pairs5. The number of schools in each group and area are presented in Table 2.1 below.
Table 2.1: Randomization and Non-compliance Assignment (A) Non-Compliance (B) (A)-(B)
Area Treatment Control Treatment Control Treatment Control Total
MG 20 28 0 0 20 28 48 RS 25 25 3 0 22 25 47 RJ 15 15 3 0 12 15 37 SP 21 20 1 3 20 17 37 VP 20 20 0 0 20 20 40 Total 101 108 7 3 94 105 199
Source: Administrative data — Instituto Unibanco.
As we can see in Table 2.1 there were problems with compliance on the treatment and control groups. There were two main problems in schools that did not comply with the assignment to treat-ment: (i) insufficient documentation or other bureaucratic problems, or (ii) insufficient performance of students in the program’s intermediary evaluations. On the control group the main problem was that some schools ended up receiving the treatment by the Federal Ministry of Education. To avoid problems with selection regarding the schools’ decisions to comply, we will focus only on the treatment assignment, limiting us to only identifying the intention to treatment (ITT) effect.
In the state of S˜ao Paulo (SP and VP areas) the program was intended to be implemented in 2009 but it only happened late in September and for more than 40% of the schools in November. Therefore, the Instituto Unibanco decided to consider 2010 as the initial year for the program in these areas. When assessing the baseline balance in 2009, the treatment and control groups were not balanced in terms of the Prova Brasil6 student proficiency. The details will be explored in the section 6, however, in order to preserve our estimations, SP and VP were dropped from our
4Rosa (2015) states how in S˜ao Paulo the secretariat of education established that only the schools with the lowest
performance in the state educational evaluation would be eligible for the program.
5The variables used in the stratification procedure were: school’s location, number of enrolled students, proportion
of high school students in the total number of students and proficiency of students in the senior year of high school.
6National exam for the 5th and 9th grades applied in all Brazilian public schools, every odd years since 2005—
analysis7.
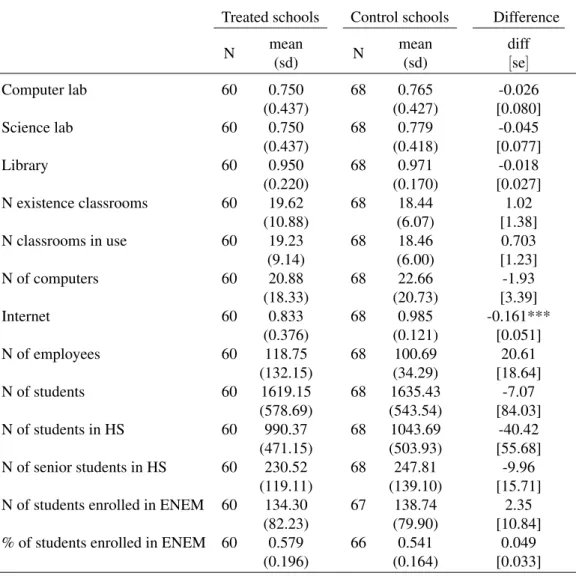
Table 2.2 presents the balance between treatment and control groups for several infrastructure and school features. Information comes from the School Census and ENEM datasets, which will be presented in the data section. As we can see, we cannot reject the equality of means for both groups for all variables except for the presence of Internet at schools. This does not raise our concern since it seems to be totally at random and it goes in the opposite direction of our findings (control group displays a higher proportion of schools with Internet connection). Important characteristics such as the number of students enrolled in school, in high school, in the senior year of high school and enrollment in the national exam (ENEM) are balanced among the schools in the experiment.
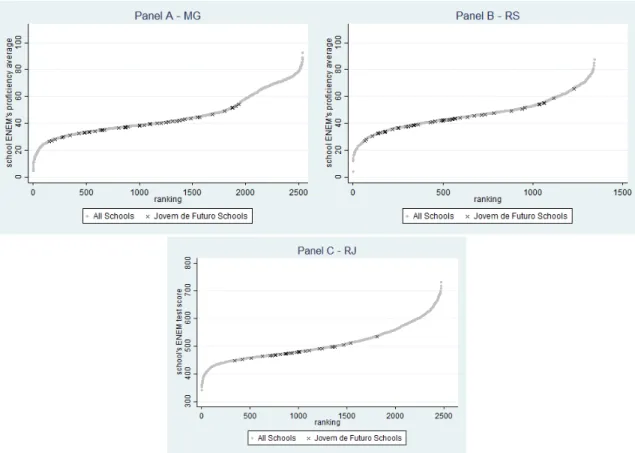
Using the average test score in ENEM as a measure of school quality we can assess whether the schools selected in the experiment are a representative subset of the non-selected schools in the state. Figure 1 displays ENEM’s average at school level in the baseline year (2007 and 2009) and its ranking in the grade’s distribution within each state, for all schools in the states of MG, RS and RJ. Schools participating in the experiment are evidenced with the X marker. It is possible to see that the schools are well dispersed along the grades distribution. This, added to the fact that the experiment takes place in 3 different states, several cities and covering almost 130 schools, gives substantial external validity to our results.
7As a robustness check, we reestimate our main results including these areas and the results are qualitatively the
Table 2.2: Baseline balance
Treated schools Control schools Difference
N mean (sd) N mean (sd) diff [se] Computer lab 60 0.750 68 0.765 -0.026 (0.437) (0.427) [0.080] Science lab 60 0.750 68 0.779 -0.045 (0.437) (0.418) [0.077] Library 60 0.950 68 0.971 -0.018 (0.220) (0.170) [0.027] N existence classrooms 60 19.62 68 18.44 1.02 (10.88) (6.07) [1.38] N classrooms in use 60 19.23 68 18.46 0.703 (9.14) (6.00) [1.23] N of computers 60 20.88 68 22.66 -1.93 (18.33) (20.73) [3.39] Internet 60 0.833 68 0.985 -0.161*** (0.376) (0.121) [0.051] N of employees 60 118.75 68 100.69 20.61 (132.15) (34.29) [18.64] N of students 60 1619.15 68 1635.43 -7.07 (578.69) (543.54) [84.03] N of students in HS 60 990.37 68 1043.69 -40.42 (471.15) (503.93) [55.68] N of senior students in HS 60 230.52 68 247.81 -9.96 (119.11) (139.10) [15.71]
N of students enrolled in ENEM 60 134.30 67 138.74 2.35
(82.23) (79.90) [10.84]
% of students enrolled in ENEM 60 0.579 66 0.541 0.049
(0.196) (0.164) [0.033]
Source: ENEM and School Census (2007 and 2009) — INEP. NOTE — The first two columns display respectively, the number of treated schools and the mean and standard deviation (in parenthesis) for each variable. Columns 3 and 4 exhibit the same for the control group. The fifth column displays the coefficient and standard error for the treatment variable in the following regression: Yjs= α + βTjs+ ηs+ εjs, where
Figure 1: ENEM’s test scores at school level (baseline year)
Source: ENEM 2007 and 2009 — INEP. NOTE — Each point displays the school average (vertical axis) and its position in the ENEM’s test score state ranking (horizontal axis). Panel A displays all schools from MG state and the schools participating in the PJF experiments are evidenced with the X marker. The same applies for RS state (panel B) and RJ (panel C). Since the exam changed its scale in 2009, the vertical axis are not the same. The writing exam is not considered.
3 Data and Econometric Strategy
3.1 Data
The School Census is an annual census survey of students enrolled in Brazilian schools from kindergarten until high school produced by INEP (Instituto Nacional de Estudos e Pesquisas Edu-cacionais An´ısio Teixeira), a research agency linked to the Ministry of Education. For every student-year observation it is possible to establish its enrollment status, grade and school. Using this dataset, we can generate the list of high school freshman students in the initial year of the intervention at each participant school. All students in this list are considered as the experiment participants with treatment status being defined by the school status in the randomization. This enables us to identify all individuals belonging to the three-years experiment cohort.
There is also a similar version of the School Census for higher education, the Higher Education Census, which is available since 2007 and comprises all students enrolled at any higher education college. The dataset allows us to observe the students’ enrollment status, type of selection exam, funding, major and college information.
The Brazilian Ministry of Labor produces the Labor’s Annual Social Information Report, the RAIS dataset, which contains administrative records of all formal labor contracts in the country. Every observation is a formal labor contract between a worker and a firm in a given year, which specifies the contract status at the end of the year (active or inactive), the duration of the work agreement, wage and the amount of contracted hours. Other information like workers’ gender, age, educational attainment and other job-related characteristics are also available. The confiden-tial identified dataset of RAIS spans 2002-2013. It is clear that when using RAIS, we are losing an important side of the labor market: the informal workers, in other words, those that do not have a legal working contract. However, due to their intrinsic nature, it is impossible to have administra-tive data on the informal contracts1. Using only secondary data, it is unconceivable to incorporate informal jobs into the analysis.
Unfortunately, there is not a direct link between the School Census and the datasets after com-pulsory schooling: Higher Educational Census and RAIS. The existing identification number (stu-dent ID) in the School Census is limited to the mandatory education informations such as the
1There is data such as the Brazilian demographic census or surveys such as PNAD that allow the estimation of the
relative size of the informal market, the wage distribution, duration of work and other features of this important side of the labor market. Some information can be found in Dix-Carneiro e Kovak (2016).
School Census and some standardized national exams. Higher Educational Census and RAIS use the individual social security number2as the primary identification key. However, in the end of high
school students can take a National Exam called “ National Exam of Upper Secondary Education” (ENEM), in which students have to fill their social security number to complete the enrollment. For almost all students enrolled in the exam, INEP is able to assemble the student unique student ID3. This enable us to link the formal education information with higher education and labor market datasets.
ENEM has four objective exams based on the Item Response Theory (IRT): natural sciences, human sciences, language and mathematics as well as a writing exam. The exam was created in 1998 in order to evaluate the high school quality in Brazil, but had a completely different structure. In the course of time the exam started to be used as a part of the college admission process and culminated as being nowadays the main process to select students to public universities, to select beneficiaries for public scholarships in private colleges (Prouni) and also to choose students that can access the public funding systems that distributed loans to students in private colleges (FIES). Other public programs such as scholarships for academic exchanges also rely on the student score in ENEM. Students older than the ideal age to finish high school, can also obtain a high school degree if they achieve a minimum score in the exam.
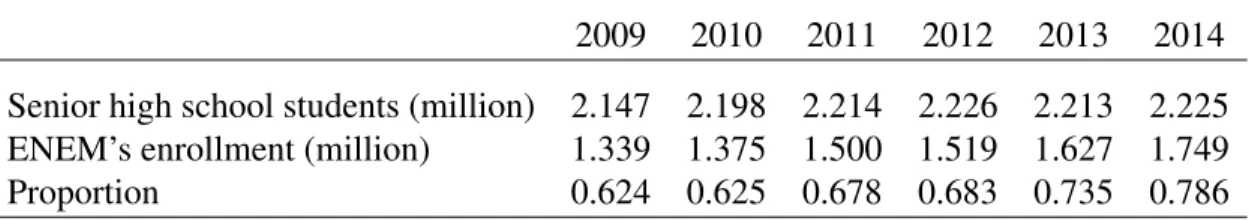
Therefore, students have several incentives to participate in the national exam. As we can see on table 3.1, more than 60% of the students in the senior year of high school are enrolled in ENEM. The proportion is continuously increasing over time, reaching almost 80% of participation in 2014. We will use data from the exams of the years 2009-2014 and scores are available for the 5 components: natural sciences, human sciences, language, mathematics and writing.
Table 3.1: ENEM’s enrollment
2009 2010 2011 2012 2013 2014 Senior high school students (million) 2.147 2.198 2.214 2.226 2.213 2.225 ENEM’s enrollment (million) 1.339 1.375 1.500 1.519 1.627 1.749
Proportion 0.624 0.625 0.678 0.683 0.735 0.786
Source: ENEM and School Census 2009-2014 — INEP. NOTE — Number of high school students is given by the School Census. ENEM’s enrollment is restrict to senior high school students. Proportion of students enrolled in the senior year of high school that takes ENEM.
From the list of freshman students of high school we retrieve 56,166 students. It is important to state that this approach reinforces our “intention to treat” strategy since our sample relies on
2Cadastro de Pessoa F´ısica- CPF
the students’ initial treatment status despite their schooling future decisions such as to complete high school, to drop out or to change school. Using their student ID number we look for them in the ENEM’s dataset from 2009-2014 in order to obtain their social security number. The success in this procedure defines whether each student is present in our final sample (selected) or is considered as attrition (not selected). We are able to identify 14,216 students or 25.3% of our sample4. We have three sources of attrition: (a) students that dropout after the first year of high school, (b) students that do not take ENEM, and (c) students that do not have INEP’s code in the ENEM dataset. While (c) is arguably random, (a) and (b) are likely to be affected by treatment and this will be considered in our empirical strategy.
We have information on access and characteristics of higher education for all selected students from 2011 to 2015. For labor market information we have data from 2011 through 2013. For phase 1 students (MG and RS areas) we will have 5 years of higher education information and 3 years of formal labor market information after expected high school completion (2010). Analogously, for phase 2 students (RJ area), higher education information will be available for 3 years after high school graduation (2013-2015) and 1 year (2013) for formal labor market.
Since 2005, in every odd year in Brazil there is a large national exam applied in every primary public school in the 5th and 9th grades5 called Prova Brasil (Brazil’s exam). Starting in 2009, identified individual data is available. Therefore, we can assess phase 2 students’ proficiency with the aid of this exam. This information enables us to carry out some heterogeneity exercises on the students’ proficiency prior to the program. Figure 3 in the appendix A details all the datasets, links and sources of attrition.
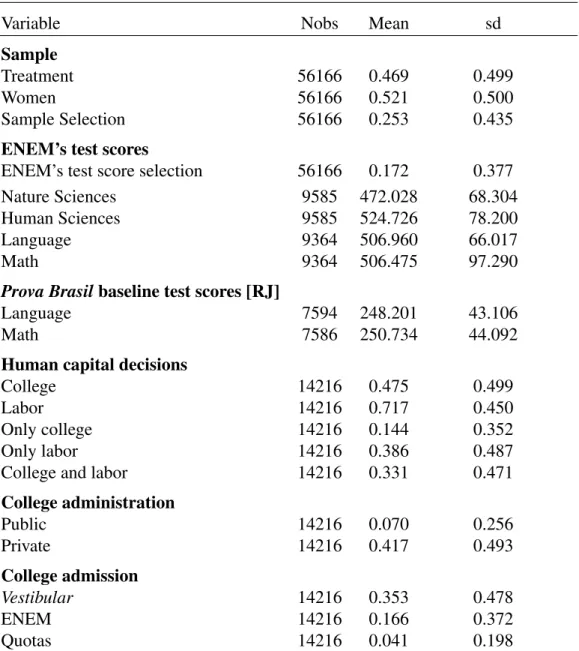
Table 3.2 below presents some descriptive statistics on the main variables. Our initial sample, that is, the list of freshman students in the first year of the program, is composed by 56,166 individu-als. Selection indicator equals one if we can identify a student’s social security number, we identify 25.3% of our sample. Approximately 46.9% of the students are in treated schools and 52.1% are women. For 17.2% (9,660) we have data on the ENEM’s tests scores in the expected senior high school year6. For the RJ sample we have data on the Prova Brasil 2009 proficiency (language and
math) for more than 7,500 students.
Considering the human capital decisions, 47.5% of the individuals enroll in any college-major
4It is important to state that we execute the analysis with an alternative data (with only senior students) where
attri-tion is significantly lower (selecattri-tion is above 75%) and the results are qualitatively the same. We chose as benchmark the data with freshman students since it exhibits less layers of attrition that could be affected by the treatment. Details will be given in section 6.
5Brazilian educational system is organized in 9 years of elementary school, through grades 1st to 9th, and in 3 years
of high school (10th to 12th grades).
6For this assessment, we lose some students that were enrolled but did not take the exam and those students that
Table 3.2: Descriptive Statistics
Variable Nobs Mean sd
Sample
Treatment 56166 0.469 0.499
Women 56166 0.521 0.500
Sample Selection 56166 0.253 0.435
ENEM’s test scores
ENEM’s test score selection 56166 0.172 0.377
Nature Sciences 9585 472.028 68.304
Human Sciences 9585 524.726 78.200
Language 9364 506.960 66.017
Math 9364 506.475 97.290
Prova Brasil baseline test scores [RJ]
Language 7594 248.201 43.106
Math 7586 250.734 44.092
Human capital decisions
College 14216 0.475 0.499
Labor 14216 0.717 0.450
Only college 14216 0.144 0.352
Only labor 14216 0.386 0.487
College and labor 14216 0.331 0.471
College administration Public 14216 0.070 0.256 Private 14216 0.417 0.493 College admission Vestibular 14216 0.353 0.478 ENEM 14216 0.166 0.372 Quotas 14216 0.041 0.198
NOTE — Descriptive statistics. ENEM’s test scores are from the expected senior year of high school (2010 in MG and RS and 2012 in RJ). Prova Brasil test scores are from 2009, only for RJ area. College indicator equals 1 if an individual is enrolled in any college-major in the analyzed period, Labor equals one if an individual has a formal work agreement during the analyzed period, Only college equals 1 if an individual is enrolled in a college-major and do not have an work agreement, the same holds for Only labor. College and Labor equals 1 if a individual is enrolled and have a formal work agreement. College administration and college admission can sum proportions higher than the proportion of students in college, because a student can be enrolled in more of one college-major during the analyzed period.
in the analyzed period, among which 14.4% only study, i.e., do not have a formal work agreement and 33.1% study and work in the period. 71.7% have a formal work agreement in the period, among which 38.6% only work (do not enroll in any higher education major). It is worthy remembering
that we have two more years of information on higher education than on the work agreements (RAIS). 7% of the students are enrolled in a public college while 41.7% are enrolled in private ones. Assessing the admission process, 35.3% use regular university entry exams (vestibular) and 16.6% use ENEM. 4.1% of students use quotas to dispute for a place (this does not exclude the ENEM and vestibular options)7.
3.2 Empirical Strategy
Given the random assignment of treatment and control, our preliminary results rely on a simple regression controlling for strata:
Yijs = α + βtreatjs+ ηs+ εijs (1)
Where ijs indexes an individual i, in school j and strata s. Yijs is the outcome of interest and
treatjsis a dummy variable for treatment status. The fixed effect of strata, ηsis considered and all
estimations are clustered at school level.
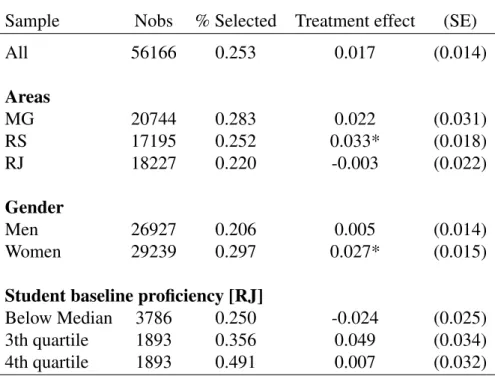
As addressed in the previous paragraphs, we only have data on the outcomes of interest for the students that have taken ENEM’s exam and the probability of a student to enroll in the exam is likely to be affected by treatment. Table 3.3 below displays the selection average and also the effect of treatment on selection. The estimated treatment effect on selection is positive (1.7 pp) but we cannot reject the null hypothesis of a zero effect. Splitting the sample in the three areas of the experiment, we can reject the null-effect hypothesis only for RS, while the RJ exhibits a zero effect on average. Considering the gender, women seem to have a positive effect while men do not.
Despite the small and not significant treatment effect on selection, we also call upon a partial identification solution using Lee (2009), whose bounds estimators have desirable properties to be applied in this scenario. The procedure yields upper and lower bounds for the desired treatment ef-fect, requiring mainly two assumptions: (i) independence of the potential outcomes from treatment, and (ii) monotonic effect of treatment on selection for all individuals. At each area (i) is directly verified given the random assignment of the treatment status. The second assumption cannot be tested, but it is strongly plausible — it is hard to think of a channel through which the treatment would discourage students to enroll in the national exam.
Since the randomization procedure in the first area (MG) was different from the remaining areas (not pairwised) and given the assumption (i) above, we apply the estimator separately in
7College administration and college admission can sum proportions higher than the proportion of students in
Table 3.3: Selection
Sample Nobs % Selected Treatment effect (SE) All 56166 0.253 0.017 (0.014) Areas MG 20744 0.283 0.022 (0.031) RS 17195 0.252 0.033* (0.018) RJ 18227 0.220 -0.003 (0.022) Gender Men 26927 0.206 0.005 (0.014) Women 29239 0.297 0.027* (0.015)
Student baseline proficiency [RJ]
Below Median 3786 0.250 -0.024 (0.025) 3th quartile 1893 0.356 0.049 (0.034) 4th quartile 1893 0.491 0.007 (0.032)
NOTE — Proportion of selected observation and treatment effect on selection for different samples. The treatment effect comes from the following regres-sion: Sijs= α + βTjs+ ηs+ εijs, where Sijsis an indicator variable whether
student i in school j and strata s is selected. T is the treatment indicator and ηsstrata fixed effects. Cluster at school level is considered. The student
base-line proficiency is only available for RJ area. * significant at 10% level, ** significant at 5% level and *** significant at 1% level.
each area and then integrate the results using as weights the number of selected observations in the control group for each area. In order to use clusters at school level in the standard errors estimation bootstrap with 500 replications was used in the bounds procedure. We are not able to include strata’s dummies in Lee’s procedure, therefore in exceptional cases the bounds’ estimation does not contain the point wise identification estimation8.
Accounting for selection, the point estimated effect cannot be determined, but upper and lower bounds can be provided. The bounds can also help us to characterize our interpretation given some assumptions. For instance, assume that there is heterogeneity in the students’ ability which is corre-lated with students’ proficiency, probability of taking ENEM and attending college. The additional selected students that we can see among treated students are the compliers, that is, those that would not have taken ENEM without treatment but did it once having received treatment. If these
compli-8The regression including strata fixed effect can differ from the regression excluding them if the treatment effect is
heterogeneous and also the proportion of treated individuals is different among strata, what is likely to be true in our setup.
ers are among the high-ability individuals, then our point estimation is overestimated and the true effect is near the lower bound. Nevertheless, if the compliers are the low-ability students, than the point estimation is underestimated and the real effect comes closer the upper bound.
As stated before, for the RJ we have data on the students’ proficiency in the Prova Brasil exam, one year before the treatment. On the one hand we can use this information to assess the plausibility of both scenarios relating to the compliers. On the other, as we can see in table 3.3, in RJ treatment seems to not affect selection. Even so, in the last part of table 3.3 we estimate the differential selection for students below median and in the 3rd and 4th quartiles9. For neither of them, treatment
has a significant effect and the signal and magnitude do not exhibit a clear pattern. In addition, treatment effect on the upper quartile is essentially zero, which is interesting for two reasons: (i) it will be extremely useful for reaching tight bounds for this subsample, and (ii) it reduces the concerns of overestimating the effects due to selection of high-ability individuals. This is also logically plausible since it is difficult to picture how the marginal students that are induced to enroll in ENEM would be in the upper tail of the baseline proficiency distribution.
9As will be explained in section 5, this division was chosen in order to increase the sample size in the lower tail
4 Results
4.1 ENEM’s test scores
Previous researches have already established the positive and significant effects of the program on student’s proficiency. Silva (2010), Barros et al. (2012) and Oliva (2014) present the effects using as a measure of students’ proficiency an exam created and annually implemented by the Instituto Unibanco in the participant schools. The estimated effects are strikingly positive in all studies for all years and areas analyzed. But this measure of proficiency has two weaknesses. First, even though the exam was designed following the structure and scale of Brazilian standard exams, it is an exam created by the institute and therefore could be biased in any direction that could benefit the treated schools. The second vulnerability is due to the selection of a subsample of students to participate in the exam, that could generate some bias in the students’ selection by the schools’ principals. For example, one might imagine that stakes were higher for treated schools.
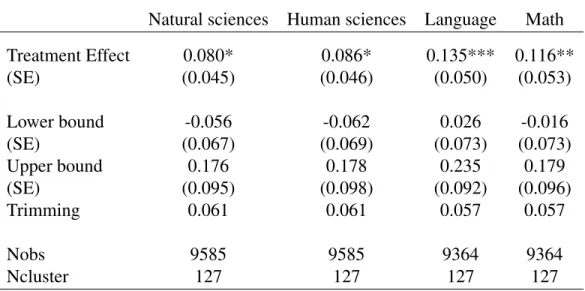
In order to avoid the two weaknesses mentioned above, Rosa (2015) uses ENEM to assess the program effects on students’ proficiency. The results are very similar to the ones previously mentioned: the average effect on language and math scores are around 15% of standard error of the outcome variable. All the previous evaluations used only the pairs (or strata) where all schools com-plied with the assignment. Since we want to avoid any assumptions on the probability of schools not complying, and given the fact that we do have data for all the schools in ENEM’s exam, we follow Rosa’s strategy to assess the ENEM test scores but, in turn, we consider all schools in the ex-periment1. Our estimation is also different from Rosa (2015) since we consider all students from the first year of high school and not from the senior year2. Furthermore, we present bound estimations for the treatment effect. Table 4.1 below presents the results.
As we can see, the average intention to treat effect is positive and significant for all four ob-jective exams. All the dependent variables are standardized by the grade distribution on the control group3. The effects for language and mathematics scores are approximately 12.5% standard devi-ation of the distribution of the outcome, around 3 and 4 percentage points less than the average treatment effects found in the literature. For natural and human sciences the magnitudes of the
1All schools in the MG, RS and RJ areas.
2Only students that were expected to receive the full treatment (three years) were considered in our estimations. 3127 school are used in the analysis. One school is lost (from RS area) because it doesn’t display desegregated
information of students enrollment in the high school. Therefore, it was impossible to retrieve the list of freshman students for this school.
Table 4.1: ENEM’s test scores
Natural sciences Human sciences Language Math
Treatment Effect 0.080* 0.086* 0.135*** 0.116** (SE) (0.045) (0.046) (0.050) (0.053) Lower bound -0.056 -0.062 0.026 -0.016 (SE) (0.067) (0.069) (0.073) (0.073) Upper bound 0.176 0.178 0.235 0.179 (SE) (0.095) (0.098) (0.092) (0.096) Trimming 0.061 0.061 0.057 0.057 Nobs 9585 9585 9364 9364 Ncluster 127 127 127 127
NOTE — The outcomes are normalized by the mean and variance of the control group. First line presents the linear regression estimates, standard error estimation takes into account cluster at school level. Lower and upper bound estimations follow Lee (2009), trimming proportion is also displayed, standard errors are computed by bootstrap with 500 replications and cluster at school level. * significant at 10% level, ** significant at 5% level and *** significant at 1% level.
estimated treatment effect are smaller but still significant. Analyzing the estimated bounds, for lan-guage the estimated lower bound is positive. That is, even if all students selected only by virtue of the treatment were the students with the highest scores in the treatment group and are dropped from the sample, treatment would continue to have a positive effect on language scores. Trimming proportion display the percentage of observations that are dropped (trimmed) in the Lee’s bounds procedure. For mathematics, we can not discard negative effects with the lower bound, however any effect lower than -1.6% is statistically ruled out. As we analyzed in section 3, it is likely to be the case that the true effect is far from the lower bound estimation.
4.2 College and Labor Market access
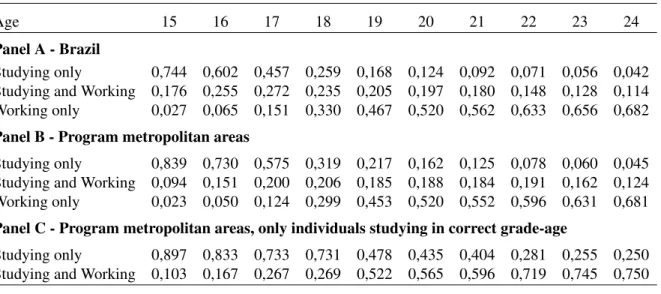
In developing countries the labor market participation decision is fundamental after high school graduation, given the low access to college. Also, a large share of individuals study and work simul-taneously. Using data from a Brazilian household survey (PNAD), table 4.2 presents the proportion of individuals in the categories: only studying, studying and working and only working, by age. When we consider the individuals aged trough 15 to 18 years, who were expected to be at high school, more than 20% study and work at the same time. Less than 30% of the individuals aged 20-22 are studying, among whom more than 60% share their time between college and labor. In panel
B, we restrict the sample to the metropolitan areas where the program took place, the scenario is slightly better but not systematically different. One concern is that students that are simultaneously studying and working, may coincide with those students that are not in the expected grade, that is, entered into the school system lately, have dropped out at any point in its educational path or were retained in some grade. In panel C we restrict our statistics to those individuals studying in the expected grade for their age. Even though, more than 18% of high school students and more than half of college ones decide to study and work at the same time.
Table 4.2: School-labor decisions — PNAD 2011
Age 15 16 17 18 19 20 21 22 23 24
Panel A - Brazil
Studying only 0,744 0,602 0,457 0,259 0,168 0,124 0,092 0,071 0,056 0,042
Studying and Working 0,176 0,255 0,272 0,235 0,205 0,197 0,180 0,148 0,128 0,114
Working only 0,027 0,065 0,151 0,330 0,467 0,520 0,562 0,633 0,656 0,682
Panel B - Program metropolitan areas
Studying only 0,839 0,730 0,575 0,319 0,217 0,162 0,125 0,078 0,060 0,045
Studying and Working 0,094 0,151 0,200 0,206 0,185 0,188 0,184 0,191 0,162 0,124
Working only 0,023 0,050 0,124 0,299 0,453 0,520 0,552 0,596 0,631 0,681
Panel C - Program metropolitan areas, only individuals studying in correct grade-age
Studying only 0,897 0,833 0,733 0,731 0,478 0,435 0,404 0,281 0,255 0,250
Studying and Working 0,103 0,167 0,267 0,269 0,522 0,565 0,596 0,719 0,745 0,750
Source: PNAD 2011 (IBGE). NOTE — Proportion of individuals only studying, studying and working and only working by each age. Panel A present the results for all Brazil, meanwhile panel B is restricted to metropolitan areas of Belo Horizonte (MG), Porto Alegre (RS) and Rio de Janeiro (RS), where the program was applied. Panel C is also restricted for all individuals that are studying in the expected grade.
Therefore, the college-labor decision in developing countries such as Brazil seems to be an important decision after high school completion. Individuals face the options of: (i) continuing to exclusively invest in formal human capital going to college, (ii) acquiring both formal education and job experience or (iii) going directly to the labor market. Taking the traditional human capital models4, some possible explanations to the existence of these cases are: (a) there is heterogeneity of individuals and for some of them the marginal return of only-studying is lower than the composite studying-working marginal return, or (b) some individuals are credit-constrained and can only study as long as they work to finance it.
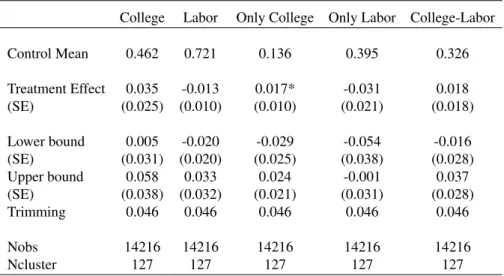
Table 4.3 presents the results regarding the college-labor decisions. In the control group 46% of individuals are enrolled in higher education in any analyzed period, only 14% are exclusively studying while 32% study and work at the same time. Treatment increases the probability of going to college by 3.5 pp. This result is not statistically significant at the standard confidence levels,
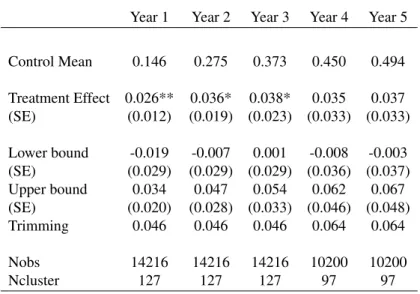
but is highly consistent across different exercises and databases. Taking into account the control mean, 46.2%, this effect represents an impact of 7.6%. Table 4.4 explores this effect for each year after the expected high school completion. In the first years, treatment boosts in 2.6 pp (17.8%) the probability of a student being enrolled in any college-major. The effect increases to 3.6pp (13.0%) in the second year and remains stable until the fifth year. For the first three years the null hypothesis can be rejected at the standard coefficient levels. Considering the bounds estimations, even if all students induced by the treatment to take ENEM went directly to college, treatment would have a positive effect on college entrance. In the annual results, the lower bounds for almost all years are negative but small.
Table 4.3: College and Labor access
College Labor Only College Only Labor College-Labor
Control Mean 0.462 0.721 0.136 0.395 0.326 Treatment Effect 0.035 -0.013 0.017* -0.031 0.018 (SE) (0.025) (0.010) (0.010) (0.021) (0.018) Lower bound 0.005 -0.020 -0.029 -0.054 -0.016 (SE) (0.031) (0.020) (0.025) (0.038) (0.028) Upper bound 0.058 0.033 0.024 -0.001 0.037 (SE) (0.038) (0.032) (0.021) (0.031) (0.028) Trimming 0.046 0.046 0.046 0.046 0.046 Nobs 14216 14216 14216 14216 14216 Ncluster 127 127 127 127 127
NOTE — First line presents the control mean for each variable, second line exhibits linear re-gression estimates, standard error estimation takes into account cluster at school level. Lower and upper bound estimations follow Lee (2009), trimming proportion is also displayed, standard errors are computed by bootstrap with 500 replications and cluster at school level.* significant at 10% level, ** significant at 5% level and *** significant at 1% level.
The effect on college attendance is divided equally among studying exclusively and work-study. The effects are respectively 1.7 pp (significant) and 1.8 pp (not significant). The treatment effect on the proportion of individuals who work exclusively is negative (-3.1 pp) and marginally significant. Positive effects are also statistically ruled out by the upper bound estimation.
4.3 University category and admission process
It is important to state that admission in Brazil is college-major specific (henceforth, we will use the term “major” instead of “college-major”) . Students must choose a major within college before attending classes and the selectiveness vary not only among colleges, but also across ma-jors. With our data we can assess the selected major, type of admission process and university’s
Table 4.4: College effect by each year after high school completion
Year 1 Year 2 Year 3 Year 4 Year 5
Control Mean 0.146 0.275 0.373 0.450 0.494 Treatment Effect 0.026** 0.036* 0.038* 0.035 0.037 (SE) (0.012) (0.019) (0.023) (0.033) (0.033) Lower bound -0.019 -0.007 0.001 -0.008 -0.003 (SE) (0.029) (0.029) (0.029) (0.036) (0.037) Upper bound 0.034 0.047 0.054 0.062 0.067 (SE) (0.020) (0.028) (0.033) (0.046) (0.048) Trimming 0.046 0.046 0.046 0.064 0.064 Nobs 14216 14216 14216 10200 10200 Ncluster 127 127 127 97 97
NOTE — First line presents the control mean for each variable, second line ex-hibits linear regression estimates, standard error estimation takes into account cluster at school level. Lower and upper bound estimations follow Lee (2009), trimming proportion is also displayed, standard errors are computed by boot-strap with 500 replications and cluster at school level. Years 4 and 5 only have data for the MG and RS areas. * significant at 10% level, ** significant at 5% level and *** significant at 1% level.
funding sources (public or private). In this subsection we will explore the treatment effects in these dimensions.
Brazil has mainly two types of universities: the public ones, where all courses are completely free of charge (there is no tuition), and the private ones, where tuitions are charged and in only a minority of them few students can be awarded with scholarships. In general, private colleges have an overall lower reputation than their public counterparts. Therefore, the attractiveness and consequentially the selectiveness of public universities are higher than that of private colleges. In fact, Binelli, Meghir e Menezes-Filho (2008) computed that, in 2003, there were on average 9 applicants for each place in public universities, while there were only 1.5 applicants for each place in private colleges.
In table 4.5 we estimate treatment effects on the university category and on the nature of the selection process. The effects are positive for both public and private universities’ attendance, but is significant and large for the public ones: treatment boosts the probability of an individual to attend public courses in 1.8 pp, what represents more than 28.5% of effect. Given the higher quality and selectiveness of these courses, this is a strikingly positive effect. The estimated effect for private colleges is 2 pp or 4.8%, where we cannot reject the null hypothesis of zero effect. Since the pro-portion of students in public universities is quite small (6.3%), the bounds estimate is particularly conservative. To compute the lower bound the trimming procedure drops almost all students in
pub-lic universities (4.6% of pubpub-lic college students are trimmed). This negative effect would be true in the unlikely event that all students that took ENEM only by virtue of the treatment were enrolled in public universities.
Table 4.5: College administration and selection process
University Selection process
Public Private Vestibular ENEM Quotas
Control Mean 0.063 0.410 0.349 0.155 0.035 Treatment Effect 0.018*** 0.020 0.018 0.029* 0.014*** (SE) (0.007) (0.021) (0.020) (0.015) (0.004) Lower bound -0.029 -0.011 -0.017 -0.011 -0.017 (SE) (0.016) (0.028) (0.029) (0.029) (0.010) Upper bound 0.022 0.043 0.036 0.043 0.016 (SE) (0.013) (0.032) (0.031) (0.022) (0.008) Trimming 0.046 0.046 0.046 0.046 0.046 Nobs 14216 14216 14216 14216 14216 Ncluster 127 127 127 127 127
NOTE —First line presents the control mean for each variable, second line exhibits linear regression estimates, standard error estimation takes into account cluster at school level. Lower and upper bound estimations follow Lee (2009), trimming propor-tion is also displayed, standard errors are computed by bootstrap with 500 replicapropor-tions and cluster at school level. * significant at 10% level, ** significant at 5% level and *** significant at 1% level.
College admission process is evaluated in two different dimensions: (a) type of admission exam, and (b) use of quotas, as part as affirmative actions. Nowadays universities can mainly use two kind of exams in order to rank applicant students: traditional entrance exams (vestibular) or ENEM. Prior to 2009, all universities had their own admission exam and applying students used to do several different exams in order to be eligible to more than one university. However in 2009, ENEM was reformulated and public universities were stimulated to use the national exam in their admission process, as a phase or even as the only test taken into account. This stimulus was also increased in the next year by the launching of SISU (“Sistema de Selec¸˜ao Unificada”), a unified system that centralizes the selection of students in the public universities. Li (2016) documents this transition and also the importance of SISU and ENEM’s selection in public, specially federal universities, in the last years. According to the author, in 2014, almost 25% of the students used ENEM to access college, among the public universities this number increased to almost 50%. In 2015, 57 public universities offered all places through SISU and other 51 used it partially in the selection process.
Affirmative actions in Brazil started in 2002 in few public universities as quotas that benefit black and public school students5. These actions increased over time and in 2012 a federal law
was approved, the “Quotas Law”, that establishes that 50% of all places in public universities administrated by the federal government should be reserved to public school students6(LI, 2016).
Therefore the analyzed period (2011-2015) is marked by the increasing importance of public school quotas and ENEM as a college admission process. We also analyzed the treatment effects on the process of entrance for the admitted students. As we can see in table 4.5, the estimated effect of treatment is positive for all admission processes, but is larger and significant for ENEM (2.9 pp) and quotas (1.4 pp). The effect of admissions through quotas is remarkably large: an increase of 40% (from 3.5% to 4.9%). Since all students in the experiment, treated and control, are eligible to use quotas, the differential effect can be explained by a higher interest in college (public colleges) by the treated students and/or by higher ENEM’s scores, since it is this grade that ranks students in order to compete for places in several public universities (with or without quotas).
4.4 College quality and selectiveness
The evidence above indicates that treatment increased the amount of students attending college, and this increase is associated to both private and public universities. It is then important to eval-uate how good this placement in terms of college-major quality is. We follow Moreira (2016) and construct a measure of quality and selectiveness of majors using freshmen ENEM’s test scores. For each course we use use the average score of freshman students in all four subjects of ENEM. Since a student can take the exam in several years we only used the last score available prior to the uni-versity admission7. Therefore, for every college-major-year we have an average score and are able
to rank all majors in Brazil in terms of this score. We will use the percentile of this distribution as a measure of major quality and selectiveness. In order to use representative measures, we eliminate all majors in which only less than 10% of students have available grades.8
In table 4.6 we display how many college-majors and students in the higher education are covered by the proposed measure. According to this measure it is possible to assess more than 55% of college-majors in the country. When we take into account the number of students enrolled in
5While the higher education system is characterized by the higher quality of public universities, in the basic
educa-tion and high school, the scenario is exactly the opposite. Private schools outperform public schools. For more details please check Binelli, Meghir e Menezes-Filho (2008) and Assunc¸˜ao e Ferman (2015).
6The implementation was gradual. Details please check Li (2016). 7We only use ENEM’s data starting in 2009.
8We choose not to use ENADE (Student Proficiency National Exam) as measure of quality because of (i) the
unavailability of annual data, (ii) the non existent evaluation for several courses, (iii) the lack of incentives to students execute the exam and (iv) the widely known criticism and boycott from several important Brazilian universities.
majors for which the measure is available, 82.8% are covered in 2010, reaching more than 99% in 2015. The number of students in higher education that took the ENEM exam also increased continuously over the years: in 2015 more than 60% of higher education students had previously taken the exam. We can also use this measure to assess whether the prior believe that public colleges are more selective than the private holds. In the figure 2 below we display kernel density estimations for the quality measure, by type of administration. As expected the public majors exhibit a higher mean (more than 70), while the private distribution is almost uniform in the 5-70 range.
Table 4.6: Measure of quality and selectiveness of college-majors
Year 2010 2011 2012 2013 2014 2015
N of college-majors 21,456 24,312 25,830 26,464 27,265 28,303
% with quality-measure 0.527 0.559 0.589 0.578 0.563 0.563
N of students in higher eduation 2,508,223 2,642,891 2,873,971 3,080,674 3,313,852 3,123,011
% with ENEM’s test scores 0.284 0.392 0.450 0.481 0.531 0.603
% of students with quality-measure 0.828 0.939 0.974 0.984 0.989 0.992
Source: Higher Educational Census (2010-2015), ENEM (2009-2014) — INEP. NOTE — Number of college-majors in Brazil and number of students in higher education. Proportion of majors with available quality-selectiveness measure and proportion of students studying in majors with available quality-selectiveness measure. Quality-selectiveness measure based on Moreira (2016).
Figure 2: Quality-selectiveness measure distribution — Public x Privates (2015)
Source: ENEM 2009-2014 and Higher Education Census 2015— INEP. NOTE — Kernel density estimate of the quality measure (in percentiles of the score ranking) for public and private colleges.
In table 4.7, we present the treatment effect on the probability of a student being admitted in a major in several percentiles of the quality-selectiveness distribution. Since we already know that treatment impacted positively ENEM’s scores and the measure is comprised exclusively by these grades, we use a lag of the quality measure in order to avoid a mechanical effect on increasing
Table 4.7: College quality and selectiveness
Below Median Above Median Above 70th Above 80th Above 90th
Control Mean 0.156 0.276 0.143 0.075 0.033 Treatment Effect 0.003 0.039* 0.036** 0.026*** 0.010** (SE) (0.007) (0.022) (0.014) (0.008) (0.005) Lower bound -0.041 -0.001 -0.008 -0.023 -0.023 (SE) (0.031) (0.031) (0.03) (0.022) (0.01) Upper bound 0.013 0.053 0.045 0.03 0.014 (SE) (0.019) (0.033) (0.023) (0.016) (0.008) Trimming 0.046 0.046 0.046 0.046 0.046 Nobs 14216 14216 14216 14216 14216 Ncluster 127 127 127 127 127
NOTE — First line presents the control mean for each variable, second line exhibits linear regression estimates, standard error estimation takes into account cluster at school level. Lower and upper bound estimations follow Lee (2009), trimming proportion is also displayed, standard errors are computed by bootstrap with 500 replica-tions and cluster at school level.* significant at 10% level, ** significant at 5% level and *** significant at 1% level.
the majors quality-selectiveness. Treatment does not impact admission in below-median majors, the point estimated is 0.3 pp, which is not statistically significant. The effect seems to be totally driven by above-median majors, where the effect is 3.9 pp, thus almost 15%. Our conservative estimation of the lower bound delivers a virtually zero effect estimation, increasing the confidence of a positive effect. Even in the highly selective majors, above the percentiles 70th, 80th and 90th the effects are positive and statistically significant, respectively 3.6 pp (25.4%), 2.6 pp (34.4%) and 1.0 pp (29.7%). Again, when we move upwards in the distribution the proportion of enrolled students falls significantly and the trimming in the lower bound estimation is more harmful. Take, for instance, the 90th percentile, there are 4.3% enrolled students among the treated, the trimming procedure will drop 4.6% of the highest observations, that is, all of the enrolled students.
Summing up all effects exhibited, we can see that treatment shifts students away from the “only working” status towards college, both in “studying exclusively” and “simultaneously studying and working” status. The increase in the number of students is partially split among public and pri-vate colleges, but almost all associated with majors ranked above the 50th percentile in the majors’ quality-selectiveness measure. There is a positive effect on the admission throughout the use of quotas (1.4 pp). The magnitude of the admission effect in public universities (1.8 pp) almost co-incides with the effects on the only studying status (1.7 pp). The same occurs with the effects on private colleges (2.0 pp) and the college-labor status (1.8 pp). Given the fact the public universities do not charge any tuition, we can argue that these students are able to exclusively dedicate to study,
while the students attending private colleges have to work to be able to pay their fees. This can pic-ture a scenario where credit constraints are present, but with the available data we cannot conclude for any direction in the credit constraint versus heterogeneity in returns to education debate.
5 Heterogeneity
5.1 Baseline Proficiency
For RJ we have data on students that took the Prova Brazil in the 9th grade in 2009, one year before the intervention. Proficiency is missing for students that were not enrolled in the 9th grade in 2009 (were out of school or were retained in 10th grade), were enrolled in private schools or have missed the exam. We can use this student baseline proficiency to assess heterogeneous effects along the proficiency dimension, as a proxy for unobserved individual ability and quality.
The proportion of students that enroll in ENEM is increasing in the Prova Brazil scores distri-bution: high-ability individuals are more likely to enroll in ENEM than the low-ability students. Therefore, the proportion of selected students is higher for the students in the 3rd and 4th quartiles than for those in the 1st and 2nd quartile of the Prova Brazil scores’ distribution. To perform the heterogeneity exercise we split the sample in quartiles, but to avoid estimations with a lower num-ber of observations in the first quartile we pull it together with the second quartile1. The 4th quartile
will be specially useful, since it is a subsample with the high-ability of individuals from treatment and control, where the proportion of attrition is small and the differential attrition is non-existent. The bound estimations for this quartile are particularly tight and informative.
Table 5.1 exhibits the main results by heterogeneity of initial proficiency. Panel A presents treatment effects for the below-median individuals, the point estimations are smaller in magnitude and we cannot reject the null hypothesis of zero effect for any variable. The estimated effect for college attendance is 1.3 pp (5.3%), which seems to be entirely coming from individuals choosing to simultaneously study and work (1.1 pp). Panel B display the results for students in the 3rd quartile of the distribution, the effects are greater in magnitude but again the null hypothesis cannot be rejected. The effect of higher education attendance is estimated in 3.5 pp (8.9%), concentrated in the study-work status (3.2 pp). Furthermore, a small negative effect for the only-labor status is also estimated, -1.3 pp. In this subsample the trimming proportion is very high leading to wide bounds estimations. Lastly, in Panel C, effects for the 4th quartile are presented. The college stock effect is 3.1 pp (5.8%), but there is a shift from the study-labor status (-2.2 pp) to the only study (5.3 pp) option. This indicates that there are effects in the extensive margin, namely that more students are attending college, but also in the intensive margin: students already in college but moving to
1Results are robust to the estimation with the original four quartile, or even terciles and quintiles. The results are
Table 5.1: Main effects - Heterogeneity by baseline proficiency (Prova Brasil) [1]
College Labor Only College Only Labor College-Labor
PANEL A - Below median
Control mean 0.252 0.435 0.143 0.326 0.109 Treatment 0.013 0.001 0.002 -0.010 0.011 (SE) (0.024) (0.015) (0.014) (0.017) (0.017) Lower bound -0.011 -0.030 -0.015 -0.034 0.001 (SE) (0.049) (0.061) (0.030) (0.047) (0.029) Upper bound 0.089 0.069 0.087 0.067 0.102 (SE) (0.069) (0.063) (0.051) (0.080) (0.038) Trimming 0.090 0.090 0.090 0.090 0.090 Nobs 946 946 946 946 946 Ncluster 30 30 30 30 30 PANEL B - 3rd quartile Control mean 0.388 0.428 0.226 0.266 0.162 Treatment 0.035 0.019 0.003 -0.013 0.032 (SE) (0.033) (0.043) (0.029) (0.020) (0.033) Lower bound -0.071 -0.060 -0.132 -0.121 -0.108 (SE) (0.038) (0.065) (0.053) (0.083) (0.061) Upper bound 0.098 0.109 0.039 0.049 0.063 (SE) (0.080) (0.053) (0.059) (0.034) (0.036) Trimming 0.143 0.143 0.143 0.143 0.143 Nobs 673 673 673 673 673 Nclusters 29 29 29 29 29 PANEL C - 4th quartile Control mean 0.530 0.438 0.294 0.201 0.237 Treatment 0.031 -0.021 0.053** 0.001 -0.022 (SE) (0.022) (0.027) (0.024) (0.025) (0.017) Lower bound 0.007 -0.023 0.037 0.006 -0.032 (SE) (0.045) (0.040) (0.039) (0.037) (0.031) Upper bound 0.024 -0.006 0.055 0.025 -0.014 (SE) (0.038) (0.043) (0.040) (0.048) (0.039) Trimming 0.017 0.017 0.017 0.017 0.017 Nobs 929 929 929 929 929 Ncluster 30 30 30 30 30
NOTE — In each panel, first line presents the control mean for each variable, second line exhibits linear regression estimates, standard error estimation takes into account cluster at school level. Lower and upper bound estimations follow Lee (2009), trimming proportion is also displayed, standard errors are computed by bootstrap with 500 replications and cluster at school level. Panel A presents the effects for the below median students in the Prova Brasil distrubUtion, while panel B is restricted to students in th 3rd quartile and panel C for students in the 4th quartile. This baseline distribution is derived by the scores in Prova Brasil in 2009 for the RJ area. * significant at 10% level, ** significant at 5% level and *** significant at 1% level.