University Institute of Lisbon
Department of Information Science and TechnologyAutomatization of Incident Resolution
Jorge Tafarel Morais Costa
A Dissertation presented in partial fulfillment of the Requirements
for the Degree of
Master in Computer Engineering – Information Systems and
Knowledge Management
Supervisor:
Dr. Rúben Filipe de Sousa Pereira, Assistant Professor ISCTE-IUL
Co-Supervisor:
Dr. Ricardo Daniel Santos Faro Marques Ribeiro, Assistant Professor ISCTE-IUL
ii
Resumo
A G estão de incidentes é um subprocesso chave da Gestão de Serviços de TI em todas as organizações como uma forma de lidar com o volume atual de tickets criados todos os anos. Atualmente, o processo de resolução ainda exige muito trabalho humano. Um grande número de incidentes não são de um problema novo, nunca visto antes, eles já foram resolvidos no passado e sua respetiva resolução foi previamente armazenada em um Sistema de Ticket de Incidentes. A automação de tarefas repetíveis em TI é um elemento importante do Gestão de Serviços e pode ter um impacto considerável em uma organização.
Usando um grande conjunto de dados reais de tickets de incidentes, esta dissertação explora um método para propor automaticamente uma resolução adequada para um novo ticket usando textos de resolução de tickets anteriores. Em sua essência, o método usa aprendizado de máquina, análise de linguagem natural, recuperação de informações e mineração. O método proposto explora modelos de aprendizagem automática como SVM, Regressão Logística, arquitetura de algumas redes neurais e mais, para prever uma categoria de resolução de incidentes para um novo ticket e um módulo para extrair automaticamente ações de resolução de tickets usando padrões de classes gramaticais.
Nas experiências realizados, 31% a 41% dos tickets de um conjunto de testes foram considerados como resolvidos pelo método proposto, que considerando o volume anual de tickets representa uma quantidade significativa de mão de obra e recursos que poderiam ser economizados.
Palavras-chave: Gestão de Incidentes, Aprendizagem Automática, Processamento da Língua Natural, Processamento de Texto, Recuperação de Informação
iv
Abstract
Incident management is a key IT Service Management sub process in every organization as a way to deal with the current volume of tickets created every year. Currently, the resolution process is still extremely human labor intensive. A large number of incidents are not from a new, never seen before problem, they have already been solved in the past and their respective resolution have been previously stored in an Incident Ticket System. Automation of repeatable tasks in IT is an important element of service management and can have a considerable impact in an organization.
Using a large real-world database of incident tickets, this dissertation explores a method to automatically propose a suitable resolution for a new ticket using previous tickets’ resolution texts. At its core, the method uses machine learning, natural language parsing, information retrieval and mining. The proposed method explores machine learning models like SVM, Logistic Regression, some neural networks architecture and more, to predict an incident resolution category for a new ticket and a module to automatically retrieve resolution action phrases from tickets using part-of-speech pattern matching.
In the experiments performed, 31% to 41% of the tickets from a test set was considered as solved by the proposed method, which considering the yearly volume of tickets represents a significant amount of manpower and resources that could be saved.
Keywords: Incident Management, Machine Leaning, Natural Language Processing, Text Mining, Information Retrieval
vi
Acknowledgements
I would like to express my deepest appreciation to my supervisors Rúben Pereira and Ricardo Ribeiro for their patience and amazing support and guidance during this last year. Also, I would like to thank my family, my dog, friends and colleagues that directly or indirectly emotionally supported and gave me encouragement throughout this journey.
viii
Contents
Resumo ... ii Abstract ... iv Acknowledgements ... vi Contents ... viii List of Tables ... xList of Figures ... xii
Abbreviations ... xiv
Chapter 1 – Introduction ... 1
1.1. Motivation ... 2
1.2. Research methodology ... 3
1.2.1. Problem Identification and Motivation ... 4
1.2.2. Define the Objective for a Solution ... 4
1.2.3. Design ... 4
1.2.3.1. The ticket fields ... 4
1.2.3.2. Short and Full Description ... 5
1.2.3.3. Ticket Language ... 6
1.2.3.4. Incident and Resolution Category ... 6
1.2.3.5. Ticket Resolution ... 8
1.2.4. Development and Demonstration ... 8
1.2.5. Evaluation and Communication ... 9
1.3. Structure ... 9
Chapter 2 – Theoretical Background ... 11
2.1. IT Service Management... 11
2.2. Incident Management ... 12
2.3. Data and Text Mining ... 13
2.4. Text Classification ... 14
Chapter 3 – Related work ... 17
3.1. Text Categorization in Incident Management ... 17
3.2. Resolution Recommendation in Incident Management... 18
Chapter 4 – Incident Resolution Category Prediction ... 25
4.1. Design ... 25
4.1.1. Data Selection and Preparation ... 25
4.1.1.1. Language and Ticket Selection ... 25
4.1.1.2. Entries with Empty Fields ... 26
ix
4.1.1.4. Document Representation ... 27
4.1.2. Categorization Proposal ... 27
4.2. Development and Demonstration ... 29
Chapter 5 – Incident Resolution Recommendation ... 33
5.1. Design ... 33
5.2. Development ... 34
5.2.1. Step 2 - Incident Tickets Similarity ... 34
5.2.2. Step 3 - Resolution Actions Extraction ... 35
5.3. Demonstration ... 36 Chapter 6 – Evaluation ... 39 Chapter 7 – Conclusion ... 41 7.1. Research Limitation ... 42 7.2. Future Work ... 43 Bibliography ... 45
x
List of Tables
Table 1 - Dataset ticket fields ... 5
Table 2 - Word and character count for short and full description ... 5
Table 3 – Dataset language distribution ... 6
Table 4 - Incident Category distribution... 7
Table 5 - Resolution Category distribution ... 7
Table 6 - Word and character count for the resolution field ... 8
Table 7 - IM processes by ITIL ... 13
Table 8 - Studies Index ... 19
Table 9 - Studies Concept Matrix ... 20
Table 10 - Prediction results between nominal attribute vs short vs full description ... 30
Table 11 - Prediction results with stop-words removal ... 31
Table 12 - Prediction results with application of lemmatization ... 31
Table 13 - Prediction results with stop-words removal and application of lemmatization ... 32
Table 14 - Sample of actions POS patterns ... 36
Table 15 - Experiment accuracy results for solving tickets with the actions extraction module ... 37
Table 16 - Resolution time comparation between manual and proposed method by accuracy ... 39
xii
List of Figures
Figure 1 - Design science research process (DSRP) model example (Peffers et al., 2006)
... 3
Figure 2 - Applied DSR guidelines (adapted from Figure 1) ... 3
Figure 3 - Occurrence correlation heatmap between the Incident Category and Incident Resolution Category ... 7
Figure 4 - Proposed approach workflow for automating the IM process ... 9
Figure 5 - Flowchart of the text classification process with the state-of-the-art elements (Mirończuk & Protasiewicz, 2018). ... 14
Figure 6 - Data Selection and Preparation Workflow ... 25
Figure 7 - Categorization Proposal Workflow ... 28
Figure 8 - Resolution Actions Extraction WorkFlow ... 33
xiv
Abbreviations
CBR – Case-Based Reasoning CI – Configuration Item
CNN – Convolutional Neural Network DM – Data Mining
DSR – Design Science Research IE – Information Extraction IM – Incident Management IS – Information Systems IT – Information Technology
ITIL – Information Technology Infrastructure Library ITS – Incident Ticket System
ITSM – Information Technology Service Management LSTM – Long Short-Term Memory
ML – Machine Learning
MNN Multinomial Naïve Bayes
NLP – Information Technology Infrastructure Library NN – Neural Network
POS – Part-Of-Speech
SNN – Softmax Neural Network
TF-IDF – Term Frequency – Inverse Document Frequency TM – Text Mining
1
Chapter 1 – Introduction
Currently, organizations spend a great amount of resources to keep their IT resources incident free and running, since there are very few areas that do not depend directly or indirectly on software systems. Therefore, they rely on IT service management (ITSM) processes to quickly detect, process and resolve incoming incidents to achieve that goal. Implementing a set of ITSM uniform processes (such as Incident Management (IM), Change Management, etc.) allows the delivery of IT services consistently within a single IT organization and also across many IT organizations (Huttermann, 2012)
Several IT frameworks exist to guide and support organizations during ITSM implementation. The Information Technology Infrastructure Library (ITIL), one of the most widely adopted (Iden & Eikebrokk, 2013; Jan & Li, 2016), is the standard for best practices in managing IT services that provides infrastructure, development, and operations for identifying, planning, delivering, and supporting the IT services to a business, and IM is one of the main process it provides (Salah, Maciá-Fernández, Díaz-Verdejo, & Sánchez-Casado, 2016).
The IM process is responsible for restoring the normal service and operations as quickly and effective as possible and minimize the impact of incidents on the corporation as a whole (Yun, Lan, & Han, 2017). Organizations are adopting software tools called Incident Ticket System (ITS) to support the teams responsible for the IM process. An ITS that follows the ITIL framework practices provides a positive effect on the efficiency of the IM process, which in turn improves and increases companies revenue (Silva, Pereira, & Ribeiro, 2018).
Timely resolution of incoming tickets is essential to achieve availability objectives (Gupta, Prasad, & Mohania, 2008b). This has created the desire for the IT industries to automate their processes and workloads, and the application of machine learning (ML) algorithms allows the automation of the repeated tasks performed in the IT industry, and by adopting it, it is possible to benefit from reduced costs and resources in delivering the IT services (Krishnan & Ravindran, 2017).
2
1.1. Motivation
Problem resolution is a key issue in the IT service industry (Chen, Tao, Yan, Anerousis, & Shao, 2010) and it is still difficult for large enterprises to guarantee the service quality of IM process because of the difficulty in handling frequent incidents timely, even though ITSM standard process have already been established (Zhao & Yang, 2013).
Conventionally, the IM process is largely manual, error prone and time consuming, especially in the resolution step (Gupta, Prasad, & Mohania, 2008a). For every ticket generated the process is to have someone analyze and try to resolve the incident through personal expertise and it is the same to the next incoming tickets. However, in many cases this process is not entirely systematic and may be incoherent and inefficient (Salah et al., 2016).
It is critical for effective IM to identify tickets which are redundant or potentially have the same root cause (Ghiţ, Iosup, & Epema, 2013). Many incidents are not new – they involve dealing with something that has happened before and may as well happen again or might appear in groups addressing the same problem with the creation of multiple tickets that are related to the same incident (Salah et al., 2016).
Usually a database of historic incidents, stored as tickets on the ITS, and their corresponding resolutions actions are maintained. The search for the correlation between tickets to find the common solution for an issue is an expensive process in terms of manual labor and productivity (Ghiţ et al., 2013).
The objective of this work to is attempt to move to an automatic system that generates a resolution using the similarity of the incoming incident to other tickets by analyzing the data associated with the tickets. The nature of the tickets containing unstructured data in the form of free text such as the incident and resolution description demands the use of appropriate technologies to achieve the goal of automation. Information Extraction (IE), Text Mining (TM) and Natural Language Processing (NLP) are the tools that allows the processing, analysis and knowledge extraction of the tickets textual data (C. C. Aggarwal & Zhai, 2012), and coupled with machine learning (ML) techniques, that knowledge can be further used for pattern recognition (“Pattern Recognition and Machine Learning,” 2007) and to implement an incident prediction model that helps achieve the optimization of the resolution process.
3
1.2. Research methodology
For this project, the Design Science Research (DSR) was adopted as research methodology (Peffers et al., 2006). DSR methodology is an outcome-based IT research methodology and according to Vaishnavi et al. (2004) it provides a set of synthetic, analytical techniques and perspectives (complementing positivist, interpretive, and critical perspectives) for performing research in IS. It is used to create and evaluate IT artifacts intended to solve identified organizational problems (Peffers, Tuunanen, Rothenberger, & Chatterjee, 2007). Peffers et al. (2006) described the DSR process model consisting of six activities in a nominal sequence described and presented in Figure 1.
Figure 1 - Design science research process (DSRP) model example (Peffers et al., 2006)
Figure 2 presents the steps to follow along this dissertation.
4
1.2.1. Problem Identification and Motivation
The response to incidents are mostly operated manually which is time consuming, and it is of too much dependency when relying only on the subjective personal experience of a service agent (Yun et al., 2017). It should also be considered the high volume of incoming incidents, and the incorrect assignments to a resolver group, which affects the incident route negatively that demands more resources, and leads to wasted time (Shao, Chen, Tao, Yan, & Anerousis, 2008).
In addition, a lot of incidents are not originated from a new, never seen problem, making a resolver spend time investigating on a repeating problem which solution is already known in the ITS knowledge base.
Considering all this together, the incident resolution process is time expensive and can be optimized and adding some automation to these processes results in reduced waste of time and resources.
1.2.2. Define the Objective for a Solution
Grounded on the previous statements, this research aims to explore a method to automatically extract and propose suitable resolution actions for new incident tickets using ML algorithms, IE and NLP techniques.
1.2.3. Design
For this study it is used a real dataset provided by an IT department from a real multinational company that due to privacy questions cannot be mentioned along the work. The IT department is responsible for supporting and managing the global IT resources of the entire organization that are used by more than 350k employee and their incident management system is responsible for the handling of all types of tickets from all the departments inside of the organization so the data contains a diverse range of knowledge domains.
1.2.3.1. The ticket fields
The dataset under study contains 1.2 million incident tickets covering the 2018 year. It contains a large number of fields, with 24 attributes associated such as incident category, subcategory, short description and description, type, assignment group, contact source, department, location, resolution category, etc. The incident short description, full
5
description and resolution stand out as the only ones that are in the form of unstructured text and the rest being categorical. From the categorical ones, most are redundant and remain unused in the IM process. In Table 1 it is possible to find all the fields in the dataset.
Table 1 - Dataset ticket fields
Tickets fields Unstructured
Short Description Resolution Notes Full Description
Structured
Number User Category
State Business Duration
Created By User Scope
Created On Department
Assigned To Location
Assignment Group Severity Incident Category Contact Source Incident Sub-Category User Impact
Incident Type Resolution Category Resolved By Resolved At
Resolver Group
1.2.3.2. Short and Full Description
The short description and full description are two of the most important fields in the tickets. Essentially, the full description is a longer and more detailed description about the incident containing a more throughout explanation about the problem, whereas the short description is a short summary about the incident. Table 2 shows the minimum, maximum and average word count and character count for the short and full description. There are tickets with only one word in one of the descriptions. Concerning the maximum word count for the full description, a few tickets had whole emails conversations or other forms of external reports that were pasted to the field.
Table 2 - Word and character count for short and full description
Short Description Full Description Characters Words Characters Words
Minimum 1 1 1 1
Maximum 160 35 31953 5020
6
1.2.3.3. Ticket Language
Since the company is a multinational, the dataset contains tickets in a variety of languages, such as English, Portuguese, German, Spanish, French, etc., and since there is no with the language of the ticket so it was necessary to use an additional tool to automatically detect the ticket language. Table 3 presents the dataset language distribution results from the automatic language detection process.
Table 3 – Dataset language distribution
Language English 82.5% German 8.8% Portuguese 2.9% Spanish 1.04% French 0.5% Others 4.26%
1.2.3.4. Incident and Resolution Category
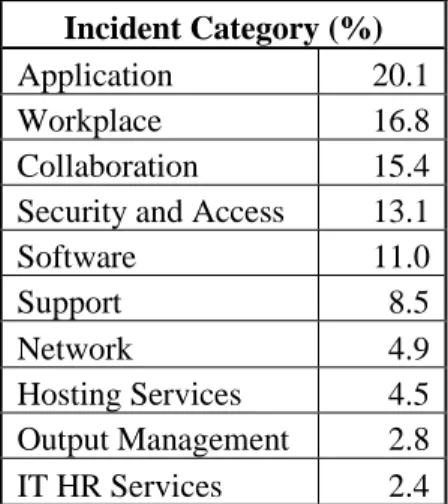
The incident category refers to the problem domain inside of the organization, is selected by the user or the support staff in the ticket creation process and it is used for routing, to deliver the ticket to the service agent with the correct knowledge expertise for the ticket problem.
Once a service agent has solved the incident, he selects the resolution category. In the IM, process this category is mostly used for reporting and statistics. Table 4 and Table 5 shows the categories distribution in the dataset, and as it is possible to see, the data is heavily imbalanced. Figure 3 shows the occurrence correlation between the two categories. The presented values are normalized. The correlation is not strong and does not show a clear separation between the categories, and, as expected, the most common resolution categories (“Information/Advice”, ”Request” and “Configuration”) are the ones with a stronger presence across the dataset.
The “Security and Access” incident category and the “Request” resolution category presents the stronger correlation in the dataset which is not surprising since the request for access of any type, especially in the IT environment (request for password, access to a system or software, etc.), is a common occurrence inside of an organization. The “Information/Advice”, the most frequent resolution category, not surprisingly share a
7
relatively stronger correlation with most frequent incident category which can be credited to the simple fact that it has more samples.
The rest of the categories have a fairly uniform distribution.
Table 4 - Incident Category distribution
Incident Category (%)
Application 20.1
Workplace 16.8
Collaboration 15.4
Security and Access 13.1
Software 11.0 Support 8.5 Network 4.9 Hosting Services 4.5 Output Management 2.8 IT HR Services 2.4
Table 5 - Resolution Category distribution
Resolution category (%) Information/Advice given 35.5 Request 29.2 Configuration 17.4 Installation 5.1 Other 3.8 Security 2.3 Complaint 1.9 Hardware 1.6 Software 1.6 Data 1.2
Figure 3 - Occurrence correlation heatmap between the Incident Category and Incident Resolution Category
8
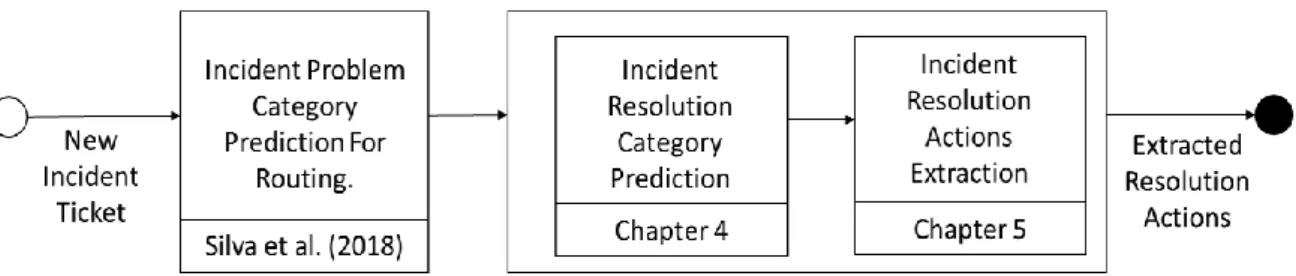
Silva et al. (2018) has already approached the incident category by creating a system predict the incident category for tickets routing assignments. This research will focus only on the incident resolution category since it is the one covering the resolution domain.
1.2.3.5. Ticket Resolution
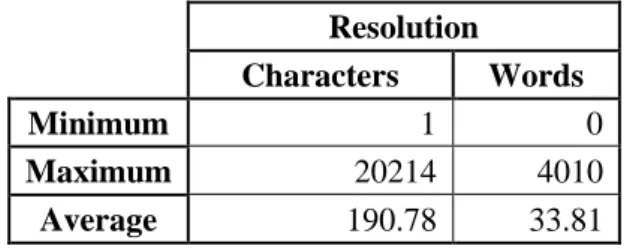
The resolution field is also a natural language text field registered by the service agent in the end of the incident lifecycle containing information about the incident resolution such as the action’s steps taken, additional information about the problem or both. This field presents a high amount of noise, since it is the last to field to be filled by the agents, they mostly do it in a rush and carelessly. Table 6 presents the minimum, maximum and average word count and character count for the resolution field. Few tickets from the dataset did not contain the resolution but not in a significant number. Similar to the short and full description, some tickets present entire email conversations or reports that were pasted by the agent to the field.
Table 6 - Word and character count for the resolution field
Resolution
Characters Words
Minimum 1 0
Maximum 20214 4010
Average 190.78 33.81
1.2.4. Development and Demonstration
To achieve the goal of this study, this research proposes the development of a method capable to automatically propose a suitable resolution for new incoming incidents. To design the artifact, this research follows the two steps bellows:
• First, it is necessary to predict the resolution category. For this, text pre-processing techniques and feature selection should be applied to the dataset to then obtain the best classifier for the resolution category. Here, different ML and TM techniques combinations will be tested and presented, and the one that best predicts the resolution category will be selected. This research will not focus on the prediction of the incident category since it was previously approached by Silva et al. (2018) on a similar dataset.
9
• Next, this research will then explore the use of Information Extraction (IE) techniques to extract the most suitable resolution actions from the dataset for the new incident ticket.
As presented in Figure 4, with these two steps, and with the research from Silva et al. (2018), the IM is covered as whole.
Figure 4 - Proposed approach workflow for automating the IM process
1.2.5. Evaluation and Communication
Regarding research communication, part of this research is presented in one published paper and the whole research is represented by this document.
1.3. Structure
The remainder of this dissertation consists of 6 chapters that are structured as follows. The second chapter presents the related work, studies related with automating, improving and optimizing the IM process. It describes which approaches and ML algorithms are implemented, and which are the results obtained with the respective approaches.
In the third chapter, is presented the related work with studies about categorization in incident management and the resolution recommendation approaches.
In the fourth chapter, it is presented the design, development and demonstration phase for the incident resolution category prediction.
In the fifth chapter, it is presented the design, development and demonstration phase for the incident resolution recommendation.
In the sixth chapter, it is presented the evaluation of the proposed method. The seventh chapter is the conclusion of this dissertation document.
11
Chapter 2 –Theoretical Background
This chapter presents relevant concepts and definitions related to this research. The literature here discussed represents and serves as a guideline to the research development and in order to achieve the defined goals.
2.1. IT Service Management
ITSM is a subset of Service Science that focuses on IT operations such as service delivery and service support (Kang & Zaslavsky, 2010). It refers to the entirety of activities: directed by policies, organized and structured in processes and supporting procedures – that are performed by an organization to design, plan, deliver, operate and control IT services offered to customers and meets the needs of the business. It must be carried out effectively and efficiently and from the business perspective enables organizational high performance and value creation (Kosasi, Prabowo, & Budiastuti, 2017).
Strategic values given by ITSM can be in the form of service deliveries and support effectiveness and efficiency. IT service providers should prioritize IT service quality based on the consumers’ expectations. This quality is, therefore, the agreement between IT service providers and the consumers (Lepmets, Cater-Steel, Gacenga, & Ras, 2012). It has two important elements: services support and deliveries. The former refers to ways to gain access of information service availability quickly and completely, while the latter presents services to fulfill managerial needs of the stakeholders in decision making (J. Wan, Zhang, & Wan, 2011).
Referring to ITIL, service supports consist of IM, problem management, change management, exemption management, and configuration management. Service deliveries, on the other hand, include management service levels, finance management, IT continuance management, capacity management, and availability management(S. H. C. Wan & Chan, 2007).
A well-defined ITSM framework results in a better monitoring of processes so that organizations can reach a higher maturity levels enabling a global understanding and a better vision of processes. When the efficiency and productivity of process activities are improved, the organization can develop, maintain and deliver higher quality services, meet business objectives and obtain a higher customer satisfaction (Orta & Ruiz, 2019).
12
By establishing a set of uniform processes (IM, Change Management, etc.), ITSM enables the delivery of IT services consistently and optimize tactical and strategic IT asset use within a sole IT organization as well as across many IT organizations (multi-nationals, outsourcers, etc.) (Galup, Dattero, Quan, & Conger, 2009).
2.2. Incident Management
The IM process is responsible for managing the lifecycle of all incidents, including any event that disrupts, or could disrupt a service. This includes events which are communicated directly by users, either through the Service Desk or through an interface from Event Management to IM tools (Marcu et al., 2009) .
An incident is defined by ITIL as an unplanned interruption to an IT service or a reduction in the quality of an IT service and is reported by humans or automatically detected and generated by a monitoring system (IBM Tivoli Enterprise Console). The recording of an incident and its nature is saved as a ticket in an ITS, which is a primary tool used by management for tracking and report of ongoing and resolved incidents (Salah, Maciá-Fernández, & Díaz-Verdejo, 2019).
As a key process, IM provides data record of each step-in incident resolution process, verifies resource configuration, management process and its operation quality to achieve service objectives, and provides data for developing service report, service plan, cost accounting as well as service workload assessment (OGC, 2007). Thereafter, IM is involved in the whole lifecycle of ITSM.
Once established, effective IM value is highly visible to the business, and it is therefore easier to demonstrate its value than most areas in Service Operation (OGC, 2007). It has the ability to optimize costs and expenders reducing unplanned labor due to the incidents detection and resolution, resulting in lower downtime for the business. It also aligns the IT activity to the business priorities by highlighting other areas that need attention and potential improvements to services and dynamically allocate resources to provide for to the business needs (Marcu et al., 2009).
13
Table 7 - IM processes by ITIL
Activity Description
Incident detection and recording
All incidents must be promptly fully logged with all the information about its nature before they have an impact on users
Classification and initial report
The incident must be assigned to the correct category, so the exact type of incident is documented with the appropriate priority (high, medium, low).
Investigation and diagnosis
An initial evaluation and diagnosis are done to the incident and the proper escalation is applied until the incident is routed to the right analyst able to solve it.
Resolution and recovery When a potential resolution has been identified, it
should be applied and tested.
Closure and tracking
At this point, the resolution is completed and confirmed, the incident is considered closed and the incident process ends.
This study focuses on the resolution process of IM included in the fourth activity.
2.3. Data and Text Mining
The term Data Mining (DM) is a diverse and broadly diversified. Gorunescu (2011) describes it as the science of extracting useful data from large databases. Additionally, DM also deals with analyzing and structuring these data, i.e. preparing them in a meaningful way. It relies on the application of machine learning, pattern recognition, statistics, databases and visualization to solve the problem of information extraction from the databases (Sharma, Sharma, & Dwivedi, 2017). The data can be available in different forms, for example numbers, time or date information or in text form.
One variant and important sub-area of DM is called Text Mining (TM). TM is the discovery and extraction of interesting, non-trivial and high-quality knowledge from text data (Zhong, Li, & Wu, 2012). Typical TM involves tasks and processes such as information retrieval, text classification, clustering, entity relation and event extraction (Kao & Poteet, 2007). Text analysis involves information retrieval, lexical analysis to study word frequency distributions, pattern recognition, tagging/annotation, information extraction, data mining techniques including link and association analysis, visualization, and predictive analytics. The main objective is, basically, to turn text into data for analysis, via application of Natural Language Processing (NLP) and analytical methods (Agnihotri, Verma, & Tripathi, 2014; Han, Kamber, & Pei, 2012). The TM tasks on which this work mainly focuses are text classification and information retrieval.
14
2.4. Text Classification
As previously stated, text classification is an important task in TM and predictive analysis with many applications. It the process of automatically classify natural language texts or documents that are unlabeled into a predefined set of semantic categories or classes (Pang & Lee, 2008) by using classifiers. After the text of said documents has been transformed, text classification is done by feeding that data into machine learning algorithms. With exponential growth in the volume of the unstructured data in the Internet, automatic text classification has become more and more important as it helps categorize and organize various mixed documents into different labels of interest with known properties, therefore making the search and retrieval of information a much more efficient process.
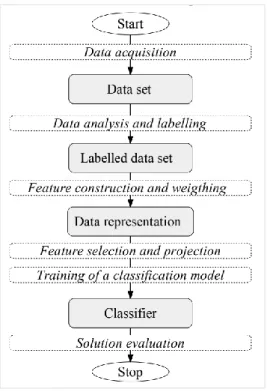
Figure 5 - Flowchart of the text classification process with the state-of-the-art elements (Mirończuk & Protasiewicz, 2018).
Text classification can utilize two groups of learning algorithms: supervised learning and unsupervised learning. In supervised learning, the ML algorithm learns from data comprising of examples (that have already been correctly labeled) that have both input and output values (Bari, Chaouchi, & Jung, 2014), and unsupervised learning in which, by contrast, the data used does not contain any information regarding the output.
Since the dataset is composed of labelled ticket data, this research will only approach supervised learning classification.
15
Figure 5 presents the six elements included in the classification baseline process identified by Mirończuk and Protasiewicz (2018).
After developing a classifier, it is always necessary to measure the classifier performance by using classification evaluation metrics. In general, an evaluation metric can be described as the tool that measures the performance of classifier. “Different metrics evaluate different characteristics of the classifier induced by the classification algorithm” (Hossin & Sulaiman, 2015). The performance measure mostly used for classification problems is the overall accuracy or, equivalently, the total error.
The four most common metrics are the following (Hossin & Sulaiman, 2015): • Accuracy: It measures the ratio of correct predictions over the total number of
instances evaluated.
• Precision: It is the number of correct positive results divided by the number of positive results predicted by the classifier.
(2) 𝑃𝑟𝑒𝑐𝑖𝑠𝑖𝑜𝑛 = 𝑇𝑃 𝑇𝑃+𝐹𝑃
• Recall: It is the number of correct positive results divided by the number of all relevant samples. It is used to measure the fraction of positive patterns that are correctly classified.
(3) 𝑅𝑒𝑐𝑎𝑙𝑙 = 𝑇𝑃 𝑇𝑃+𝐹𝑁
• F-Score: It is the harmonic average of precision and recall.
One aspect to consider when choosing a metric is the data balance nature. Classification problems with imbalanced distributions between classes can raise issues and are considered difficult problems (Daskalaki, Kopanas, & Avouris, 2006), however, they are not uncommon in data mining projects. Problems like fraud detection (Ngai, Hu, Wong, Chen, & Sun, 2011) and the diagnosis of rare diseases (Laurikkala, 2001) are
(4) 𝐹 − 𝑠𝑐𝑜𝑟𝑒 = 2 × 𝑃𝑟𝑒𝑐𝑖𝑠𝑖𝑜𝑛 ×𝑅𝑒𝑐𝑎𝑙𝑙 𝑃𝑟𝑒𝑐𝑖𝑠𝑖𝑜𝑛+𝑅𝑒𝑐𝑎𝑙𝑙 (1) 𝐴𝑐𝑐𝑢𝑟𝑎𝑐𝑦 = 𝑇𝑟𝑢𝑒 𝑃𝑜𝑠𝑖𝑡𝑖𝑣𝑒𝑠 (𝑇𝑃)+𝑇𝑟𝑢𝑒 𝑁𝑒𝑔𝑎𝑡𝑖𝑣𝑒𝑠 (𝑇𝑁)
16
typical examples. In these cases, is not wise to rely strictly on accuracy (Hossin & Sulaiman, 2015).
It is also important to considerate the training approach. Previous researches (Weiss & Provost, 2001) have shown that training with the “natural” distribution does not always result in the best classifier; hence, new training datasets should be constructed to assist the training process. Especially when the minority cases are rare, a training set “enriched” with minority examples is needed in order for the induction algorithms to create classifiers with strong predictive capabilities for all classes by either eliminating cases in the majority classes until the desired distribution in achieved (under-sampling) or by artificially duplicating the cases in the minority distribution (oversampling) (Daskalaki et al., 2006).
17
Chapter 3 – Related work
This chapter details some of the approaches found among the literature that relates to this study. It is divided in two sub sections related to the two previously identified tasks in this study: Text Categorization in Incident Management, related to the prediction of the resolution category and the literature approaching incident resolution recommendation.
3.1. Text Categorization in Incident Management
There have been some studies about the use of classification in the domain of incident tickets. Although these studies are using machine learning to perform classification, all of them are related to the prediction of the incident category of domain used for routing purposes. The most common used algorithms were Naïve Bayes, SVM, K-Nearest Neighbours (KNN), and logistic regression (logit). Following, is a more detailed analysis of some of these studies. No studies were found with the intention to predict a category related to the ticket resolution similar to this research.
Silva et al. (2018) introduces a module to automatically categorize incident tickets turning the responsible teams for incident management more productive and reducing the time wasted on incident ticket route and reducing the amount of errors on incident categorization. The authors compared results between SVM and KNN classifiers applied to the ticket description that were represented by using term frequency-inverse document frequency (TF-IDF). The accuracy results obtained was of 89%, approximately, on a dataset similar to the one used by this study.
Son et al. (2014) also approached the incident ticket category classification by resorting to two algorithms such as Multinomial Naïve Bayes (MNB) and Softmax Regression Neural Network (SNN). On both approaches, ticket subjects were used to create an input word list along with a manual word group list to enhance accuracy. The text mining algorithms used the input word list to select input words in the tickets. The implementations were tested with a dataset composed of 7042 for training tickets and 717 reserved for testing. MNB achieved slightly better results with the best overall accuracy at 85.8% than SNN at 84%.
Altintas & Tantug (2014) proposes an extension to ITS for auto-addressing the incident ticket to the relevant expert in support team consisting of a two phase classification process. The first phase intent is to detect the related category of the ticket which is
18
directly related to the department of the issue, whereas the second phase tries to determine the related subcategory or unit under the specified category based on a pre-defined threshold. In the feature extraction step, the authors adopted the bag of word approach using TF-IDF. The experiments were conducted on a dataset consisting of approximately ten thousand issue tickets in Turkish by exploring four algorithms, namely SVM, KNN, decision trees (DT) and Naïve Bayes. The performance varied directly related to the machine learning algorithm, the weighting method and the dataset, achieving the best accuracy of 86% with the SVM.
Al-Hawari & Barham (2019) introduce a help desk system that acts as a single point of contact between users and the IT staff that utilizes an accurate ticket classification machine learning model to associate a help desk ticket with its correct service from the start. The experimental results showed that including the ticket comments and description in the training data was one of the main factors that enhanced the model prediction accuracy. The J48 (Tree-based), Decision Table (Rule-based), NaiveBayes (Bayes-based) and SMO (SVM-based) algorithm were used. Applying the TF-IDF feature vectorization, the best results were achieved by SMO reaching an accuracy value of 81.4%.
3.2. Resolution Recommendation in Incident Management
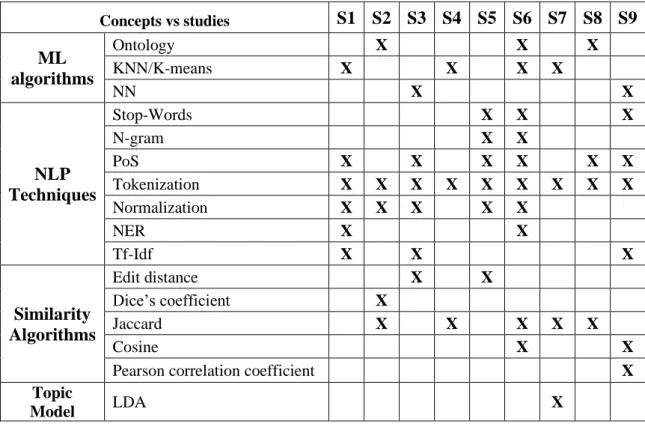
Over the years, there have been different attempts to automate the IM resolution process, with different techniques applied. Table 8 and
Table 9 presents a summary about of the approaches followed by a more detailed explanation about each study. Most of the attempts were based on clustering and correlation algorithms to provide the closest ticket based on similarity.
In the task of analyzing the raw textual ticket data written in natural language, some studies attempt to create and process the knowledge domain base using ontology extraction (S8, S2, S6). Some (S1, S9) have used TF-IDF to create the knowledge domain by extracting the word frequency score for each domain. The frequency of specific words may offer precious information about a specific domain, so mapping and using the weight of the most frequent terms might help the discovery of important keywords for the individual domains. Some authors applied PoS tagging to extract the nouns in the ticket. It was identified that the most important words that contain the most information about a ticket were in the form of nouns (e.g. disk, card, laptop, etc.). The use of normalization
19
and n-grams (S1, S5, S6) to tackle the ambiguity problem showed positive results in the extraction of semantic domain knowledge.
Table 8 - Studies Index
Studies Index Quadrille Country Year
(Gupta et al., 2008a) S1 B - ERA
A2 - Qualis India 2008
(Kang & Zaslavsky, 2010) S2 B - ERA
A1 - Qualis China 2010
(Li & Zhan, 2012) S3 A - ERA
B1 - Qualis China 2012
(Tang, Li, Shwartz, &
Grabarnik, 2013) S4 B1 - Qualis USA 2013
(V. Aggarwal, Agarwal, Dasgupta, Sridhara, & Vijay, 2016)
S5 A - ERA B1 - Qualis
Australia/
USA 2016
(Roy, Yan, Budhiraja, & Lim,
2016) S6
A - ERA B1 - Qualis
India/South
Korea 2016
(Zhou et al., 2016) S7 Q1 - Scimagojr USA 2016
(Wang et al., 2017) S8 A - ERA
B1 - Qualis USA 2017
(Yun et al., 2017) S9 - China 2017
The KNN algorithm was mostly used to obtain the correlation of new incoming tickets to their closest possible solution (S4, S1, S6, S7). In (S4) the authors compare the result from tradition KNN, weighted KNN and their divide and fusion algorithms based on KNN. Their algorithms achieved a higher accuracy than traditional KNN with a lower average penalty for false resolution. They tested 3 datasets where they reached accuracy up to 83%.
Other studies experimented Neural Networks for the task. In (S9) a back propagation neural network algorithm (BP NN) is used to develop a classifier. It uses the learning mechanism of the backward propagation to correct the weights in the neural network, and finally achieve the goal of output the correct result. By varying the number of results presented as possible solution they were able to achieve 93% accuracy. The authors in (S3) compare their BP NN to the Mixed-Integer Programming (MIP) approach. The classification accuracy of their NN is fluctuant but it gradually increases with the growing training set and achieve a higher accuracy than the MIP approach, achieving up to 88% accuracy.
20
Table 9 - Studies Concept Matrix
Concepts vs studies S1 S2 S3 S4 S5 S6 S7 S8 S9 ML algorithms Ontology X X X KNN/K-means X X X X NN X X NLP Techniques Stop-Words X X X N-gram X X PoS X X X X X X Tokenization X X X X X X X X X Normalization X X X X X NER X X Tf-Idf X X X Similarity Algorithms Edit distance X X Dice’s coefficient X Jaccard X X X X X Cosine X X
Pearson correlation coefficient X
Topic
Model LDA X
Wang et al (2017) proposed a framework where the knowledge base is modeled using an ontology to attempt problem inference by processing ticketing information. It outlines an integrated solution that uses obtained knowledge to optimize problem resolution in a learning-loop system and addresses the problem with unstructured fields and the ambiguity brought by the free-form text on the tickets. The framework is based on a phrase extraction stage (information retrieval, NLP and TM), knowledge construction using an ontology model and a recommendation/ticket resolution stage where incoming ticket is first processed by a Class Tagger module of an information inference component. By inputting the tagged ticket, the recommendation component provides the list of the most relevant resolutions. The ticket is then archived into the historical ticket database, and the newly obtained domain expertise can be used to enrich the knowledge base. They tested the framework on 22,423 tickets from IBM Global Services that consists of both structured fields and unstructured free-form text field covering a 3-month period. The test set was manually tagged by experts to build the ground truth that was then compared to the framework solution. Precision, recall, F1 score, and accuracy were close to 1 but it was due to the small number of instances of the test set.
21
Tang et al. (2013) studies the possibility to run a modern service infrastructure management in a fully automated operation environment with automatic monitoring software systems that capture and generate incident tickets working together with automated problem resolution. The authors suggest a recommendation systems approach to the resolution of event tickets and propose two resolution recommendation algorithms (“Divide” and “Fusion”) based on the weighted KNN algorithm framework with additional penalty incorporated to avoid misleading resolutions. The authors experimented with tickets captured by IBM Tivoli Monitoring and their algorithms outperform the traditional KNN and weighted KNN in all their case studies.
Gupta et al. (2008) presented a technique to identify a failing component by integrating text specified in the problem ticket with structured data stored in CMDB database along with incident classification. The scope was reduced to customer reported incidents only. They implemented a component with an automatic identification of keywords with part-of-speech filtering and word normalization, search over CMDB using search context, and limiting the search scope using directed navigation. The dataset used consisted of 192,000 objects and more than 150,000 relationships among them in an IBM network.
Yun et al. (2017) aim to use data mining technology to build an automatic decision-making model in order to automate the IM process. The model created is composed by two parts: a machine learning classifier used to predict the classification of the input incident and provide context to search similar historical incident; a search engine used to search the historical incidents similar to the input incidents using similarity algorithms and NN. When receiving an incident request, the framework can identify the possible failing CIs based on historical data, and predict the incident classification, and then retrieve the knowledge base of incidents to return the results of reference value. They used the Symian (Bartolini, Stefanelli, & Tortonesi, 2008) tool to construct a training dataset of 2000 incidents and test dataset of 1000 incidents in the simulation process, based on an enterprise real historical data. Their proposed method improved the accuracy rate by 67% achieving up to 93% accuracy in one of the tests.
Kang et al. (2010) proposes a knowledge-rich similarity measure for improving the ITSM resolution process. Based on their similarity measure, the most k-top similar tickets are retrieved for a new one, and then the solutions contained in the retrieved tickets can be used to help to generate the appropriate solution for the new incident. The measure considers the classification, workgroup and description of the ticket exploiting semantic
22
knowledge described in taxonomies that represent the relationships among the entries. The final measure value is a union of the similarity measure of those three components similarity. For the study, they compare four similarity measures using different taxonomies combinations. Evaluation was performed using a real dataset based on off-line analysis using precision and recall focusing on empirical evaluation on the returns of relevant and irrelevant incident cases. Three PhD students with strong background of IT were used for assessment and relevance judgments by comparing solution descriptions between a query ticket and each of k-top incident cases retrieved and the best results were obtained by using all three taxonomies.
Aggarwal et al. (2016) presented a system called ReAct which help the service agents to identify set of possible actions and resolve the ticket issue and uses visualization to help user choose the most suitable option. The authors implemented a NLP engine for action extraction, semantic similarity calculations, summarizing verbose resolution text into brief action phrases and sequence mining on action sequences. The resulting data was used to build a knowledge database. The next step was a series of prediction services based on action-set, next action and attribute prediction. They also built a UI layer for interactive navigation through the whole pipeline in a step by step manner and displays the constructed action sequence, recommended set of actions and attributes.
Roy et el. (2016) propose an automated method based on historic incident knowledge for recovering resolutions for new incident based on ontology-driven clustering of tickets, unsupervised learning and KNN search. They used the incident description to extract and build an ontology augmented with concepts from WordNet. This ontology drives the clustering of incidents using unsupervised learning in which a ticket is modeled as a feature vector of keywords/concepts. Once a new ticket appears, it is parsed and mapped to the set of concepts in the ontology created beforehand, and thus generating the feature vector for it based on these concepts. The authors then compute the similarity distance of the new incident to the dataset and then place it with its closest cluster. By using KNN, a couple of nearest tickets are chosen, and their corresponding resolutions are published as the recovered resolutions for the new ticket. The approach was tested on tickets for and application maintenance system of Infosys, Ltd on the retail business. In evaluation they compared each of the proposed resolutions with the actual resolution and compute the semantic similarity between them and if most similar resolution exceeds a predefined
23
threshold then it is considered a matching resolution. Overall there was an average of 48% between the suggestions and the actual resolution.
Li et al. (2012), propose a complete solution to automate incident management process with the incident description as the start and measuring the most similar incidents as the end. The system is divided into five components: Keyword Extraction and Normalization, CI Indexing, Deploy Architecture Calculation, Training Element Signature, and Machine Learning. The keyword extractor automatically extracts the normalized keywords from the new ticket description that are then used to search the CI by the CI indexing and the deploy architecture calculation component is responsible for extracting the architecture influenced by incident. All the results will be fed to the ML component after signing. The learning process is based on BP NN. For evaluation, the authors chose 1000 incident pairs as test set, and after training the NN, they compared the results with manmade feedback to obtain accuracy.
Zhou et al. (2016), tried to improve the similarity measure used in KNN by utilizing both the incident and resolution information in historical tickets via a topic-level feature extraction using the LDA (Latent Dirichlet Allocation) model, which can extract hidden topics and then encode monitoring tickets using topic levels features. When resolution categories are available, they propose to learn a more effective similarity measure using metric learning. They authors used Inference feature vectors using the trained LDA model for both incoming events and historical monitoring tickets and then monitoring tickets can be encoded as feature vectors and the cosine similarity can then be applied to measure their similarities. For evaluation they used 1000 labeled tickets with resolution categories from IBM Global Services and their algorithm achieved better results compared to the KNN and weight KNN approach.
25
Chapter 4 – Incident Resolution Category Prediction
This chapter presents the design, development and demonstration sections to create the artifact for the prediction of the incident resolution category.
4.1. Design
This section is divided as follows:
• Section 4.1.1: Describes the combinations of all the necessary steps to prepare and clean the data to build the final dataset, including the text preprocessing methods applied.
• Section 4.1.2: Describes the proposed categorization approach
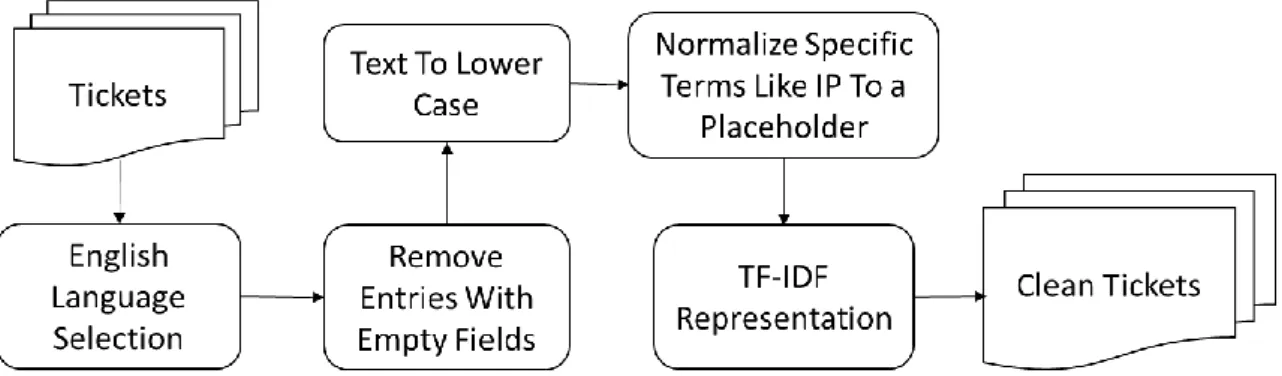
4.1.1. Data Selection and Preparation
Because of the size and nature of the dataset and in order to achieve better classification results, it is necessary to apply preprocessing and data selection. The process workflow is presented in Figure 6.
Figure 6 - Data Selection and Preparation Workflow
4.1.1.1. Language and Ticket Selection
As previously stated, several languages were identified in the dataset ticket records. It was decided that only tickets in the English language will be used since it is the most common language composing 82,5% of the dataset.
This step was also used to filter out the tickets created and closed by the automatic monitoring system. This system is responsible to create tickets when it detects failures and problems in another supervised system, like a failure in the network, for example.
26
These types of tickets have no contribution for this study, so they are discarded. Their resolutions are generally a highly technical, automatic generated report placed by the automatic system.
After this step, the dataset ends up with 850 thousand incident tickets in the dataset. 4.1.1.2. Entries with Empty Fields
In an initial analysis, several tickets presented empty values in some important fields especially the incident category and the resolution category as previously stated. For the incident category it was identified that 6,416 tickets did not have an incident category assigned, and for the resolution category, 463,034 tickets did not contain the field, which represents more than half of the dataset. Some employees of the organization were enquired about it, but they could not provide a specific explanation other than the possible neglect and hurry of the agent that closed the ticket, since assigning the resolution category is the last step of the resolution process. After also discarding the tickets with one of the categories missing and the ones where the short or full description were only one word, the resulting dataset contained 350,080 ticket records.
4.1.1.3. Text Preprocessing and Transformation
Text transformation is the conversion of the content of a text so that it can be recognized by a computer, allowing the machine to process and classify it (Man Lan, Chew Lim Tan, Jian Su, & Yue Lu, 2009). It is essential that all data are cleaned in the way that unnecessary complexity and corpus noise in the data does not have a negative influence on the final classification results. It is important to obtain a clean word stream which is better for the learning algorithms (Uysal & Gunal, 2014).
First, case information is removed by transforming all text into its lowercase form. The goal is to reduce the complexity in the data and the number of features that will be created later, since the vocabulary size is reduced in this process.
All IP address, MAC address, email and website URLs are replaced to a matching placeholder, the following are some examples:
192.142.23.12 → ipaddress 00:0a:95:9d:68:16 → macaddress
[email protected] → emailurl example.com → websiteurl
27
Additional cleaning is necessary to contractions in the texts by replacing them with their full form, for example: what’s→what is, ‘ve→have, n’t→ not, ‘re→are, etc. Any whitespace beyond one space between words and all non-alphanumeric characters including punctuation is removed. Tokenization is also applied, which means splitting the text into a sequence of tokens. This is necessary for the process of feature extraction.
4.1.1.4. Document Representation
After the data preprocessing process an important, step is document representation by representing each document as a feature vector, selecting the terms or tokens that are most relevant to identify a document and removing features that are irrelevant to the classification task, leading to dimensionality reduction of the dataset. Reducing the dimensionality can reduce the noise in the original text collection and thus provide better patterns. The bag of word model is widely used in text mining and information retrieval (Baeza-Yates & Ribeiro-Neto, 1999). Words order is not important, and each word corresponds to a dimension in the resulting data space represented by their frequency. Each document is then transformed into a vector consisting of non-negative values on each dimension.
One way of represent those words that is popular in information retrieval, data mining and in the related work as presented in Chapter 3 –is with term frequency-inverse document frequency (TF-IDF) (Kotu & Deshpande, 2015). TF-IDF weights the frequency of a word or term t in a document d with a factor that discounts its importance with its appearance in the whole document collection (Huang, 2008). The weight increases with the number of times the term occurs but is counterbalance by the frequency of the term in the corpus. The TF-IDF formula is the following:
(5) 𝑡𝑓 − 𝑖𝑑𝑓(𝑑, 𝑡) = 𝑡𝑓(𝑑, 𝑡) × 𝑙𝑜𝑔 ( |𝐷|
𝑑𝑓(𝑡) )
Where 𝑑𝑓(𝑡), is the total number of documents in which the term 𝑡 appears. To create the input data for the classifiers, this work mainly uses TF-IDF vector space and embedding layers for the NN as the standard approach for feature extraction and dimensionality reduction.
4.1.2. Categorization Proposal
For the categorization, this work uses two algorithms. First, using algorithms presented in the related work, more specifically Multinomial Naïve Bayes, Logistic Regression
28
(LR), SVM and KNN, and second, a neural based approach by using neural networks models such as Long Short Term Memory (LSTM), Bidirectional LSTM (BiLSTM) and Convolutional Neural Networks (CNN) for the classification task. The purpose is to compare the algorithms and models’ performance using different TM techniques and verifying which one produces better results. The process workflow is presented in Figure 7.
Figure 7 - Categorization Proposal Workflow
The research starts by evaluating which attributes are the most relevant for the prediction of the resolution category, by comparing the performance between considering only the nominal and text categories.
After assessing the importance of the textual data, the authors also evaluate the use of the short description versus full description to confirm which description provides better prediction results. Since one cannot be sure if the preprocessing steps actually improve or harm the performance of the ML models, some preprocessing techniques were
Nominal Attributes Short Description Full Description
Best Description
Stop Words Removal Lemmatization Stop Words Removal + Lemmatization Best Approach Attributes Determination Text Pre-Processing Classification
29
investigated. This research explores the impact of the removal of stop-words and normalization, specifically lemmatization to the classification results.
As previously shown, the dataset is highly imbalanced, so for both approaches the dataset was under sampled to 6000 incidents for each resolution category in an attempt to reduce the risk of bias in the classification. For the same reason, since accuracy might not be enough to evaluate the models’ performance as previously stated, this research also uses the F1-Score as evaluation metric. The training process is based on 5-Fold cross-validation dedicating 80% for training and 20% for testing. The goal of cross-cross-validation is to test a model’s ability to predict new data that was not used in the training process, in order to flag problems like overfitting or selection bias (Cawley & Talbot, 2010).
In the neural-based approach, for the networks first layer, an embedding layer is used that takes sequence of tokens as input to generate their representations. For this, the ticket text is divided in tokens in a tokenization process at word level transforming in each text entry into a token vector. Each vector is then transformed to a sequence of integers where each word is represented by a unique integer number and it is ensured that the sequences have the same size. This is achieved by adding padding until each sequence has the same length as a predefined selected length. The sequences are then used as input to the networks. The last layer of each NN architecture is the output layer, that maps the previous layer output to the corresponding classification label. The process is achieved by a densely connected layer with the number of neurons equivalent to the number of possible categories. This dense layer uses a softmax activation function to identify the class with the highest probability and categorical cross entropy as the loss function to obtain the classification result.
To implement the algorithms and NN models, this work used the Python programming language (Rossum & Drake, 1995) with the libraries Scikit-learn (Pedregosa et al., 2011) for the linear algorithms and Keras (Chollet, 2015) for the NN.
4.2. Development and Demonstration
This section presents all the results after applying the steps described in the Design section.
As previously stated, first the performance between using the nominal attributes versus the textual attributes will be assessed. The TM techniques applied to the textual data in this step were only the ones presented in the data preparation section.
30
The nominal attributes to use are the are the following: Department, Assignment Group, Incident Category, Incident Sub-category, Severity, and Location. Table 11 presents the achieved results with the application of the nominal attributes against the text attributes. It is possible to observe the importance of the textual attributes for the prediction. In all models, using the short or full description provides a better performance compared to the nominal attributes. It is also possible to observe that the full description presents better results than the short description. This might be related to the difference in size between them. The richer vocabulary and bigger word dimension of the full description provides better patterns and representation of the resolution domain compared to the short description. Overall the neural networks presented a better performance over the rest of the models, with the CNN achieving the best results with an accuracy of 56.45% and f1-score of 56.8%. Out of the neural networks the best model is SVM with an accuracy of 54.38% and F1-score of 53.79%.
Table 10 - Prediction results between nominal attribute vs short vs full description
Nominal attributes Short description Full description Accuracy (%) F1-Score (%) Accuracy (%) F1-Score (%) Accuracy (%) F1-Score (%) MNB 30.05 29.96 39.64 38.2 44.02 44.11 DT 30.59 29.80 39.87 39.7 41.72 40.66 LR 32.31 31.80 41.91 40.48 50.28 50.59 KNN 31.94 30.02 40.45 39.48 40.46 39.77 SVM 31.96 32.59 44.09 43.38 54.38 53.79 LSTM 34.18 33.59 47.41 47.95 56.03 56.28 Bi-LSTM 34.35 33.97 47.50 47.81 55.84 55.96 CNN 36.19 35.81 48.06 47.20 56.45 56.80
As next step this research analyses the impact of the removal of stop-words from the description’s corpus. Stop words removal consists on the elimination of common words , called stop-words, that are not meaningful and are commonly used to connect speech like propositions (Kotu, Deshpande, Kotu, & Deshpande, 2015). The results are presented in Table 11. Again, the neural networks models presented overall better results. The removal of stop-words offered no improvements in most of the models’ performance except for the CNN model that showed a 1% accuracy increase over the baseline performance.
31
Table 11 - Prediction results with stop-words removal
Short description Full description Accuracy (%) F1-Score (%) Accuracy (%) F1-Score (%) MNB 39.30 38.76 44.19 43.43 DT 40.06 39.21 40.77 40.63 LR 41.65 40.02 49.01 48.46 KNN 40.03 39.51 41.89 41.21 SVM 44.51 43.01 53.40 53.03 LSTM 47.20 46.72 56.09 55.78 Bi-LSTM 47.24 46.21 56.20 55.65 CNN 47.16 47.12 57.20 57.56
This work also explores the use of normalization which attempts to identify the root of a term and reduces words to their base form (Son et al., 2014). Similar to the removal of stop-words, it is applied in an attempt to reduce the number of features and noise. Especially, lemmatization is used which according to Balakrishnan and Ethel (2014) “is the process of grouping together the different inflected forms of a word so they can be analyzed as a single item”. Table 12 shows the achieved prediction results with the application of lemmatization to the tickets descriptions field and at last, Table 13 presents the results of the combination of stop-words removal and lemmatization. Again, the impact was minimal across most of the models and presented similar values to the one of previous experiments. The CNN presented another performance increase, the best results were 58.63% accuracy and 58.51% F1-score with the combination of stop-words removal and lemmatization.
Table 12 - Prediction results with application of lemmatization
Short description Full description Accuracy (%) F1-Score (%) Accuracy (%) F1-Score (%) MNB 39.94 39.04 43.45 42.88 DT 39.73 39.41 40.22 40.21 LR 42.37 40.90 49.38 48.90 KNN 41.77 40.82 39.66 39.31 SVM 45.36 44.39 54.42 54.10 LSTM 46.74 45.85 56.58 56.24 Bi-LSTM 47.14 46.80 55.22 55.40 CNN 47.60 47.86 58.18 58.00
32
Table 13 - Prediction results with stop-words removal and application of lemmatization
Short description Full description Accuracy (%) F1-Score (%) Accuracy (%) F1-Score (%) MNB 39.66 38.22 43.42 42.46 DT 40.81 40.13 40.58 40.40 LR 41.92 40.50 48.36 47.68 KNN 40.82 39.90 42.46 41.66 SVM 44.97 43.66 53.02 52.59 LSTM 47.30% 46.34 56.37 56,02 Bi-LSTM 47.61% 46.12 56.62 56.17 CNN 48.06% 47.64 58.63 58.51
Overall the results were considerably similar across the models and experiments but taking into account the volume of the data of a million ticket even a 2% difference in the accuracy has a big impact. Considering 1 million tickets, it might be the difference in correctly or incorrectly predicting 20,000 tickets.