13
Geospatial database generation from
digital newspapers: Use case for risk
and disaster domains.
Julio César Preciado López
Geospatial database generation from
digital newspapers: Use case for risk
and disaster domains.
By Julio Preciado
Supervised by
Rafael Berlanga Llavori PhD
Dept. Lenguajes y Sistemas Informaticos Universitat Jaume I, Castellón, Spain.
Cosupervised by
Carsten Keßler PhD
Institute for Geoinformatics Westfälische Wilhelms-Universität, Münster, Germany.
and
Miguel Neto PhD
Instituto Superior de Estatística e Gestão da Informação Universidade Nova de Lisboa, Lisbon, Portugal.
To my family
Maria Elena, mecama, Laura, lugerarma, and
GP.
Aknowledgements:
I wish thank Prof. Dr. Werner Kuhn and Dr. Christoph Brox of the Institute for Geoinformatics, University of Münster, Germany; Prof. Dr. Joaquín Huerta and Dr. Michael Gould, of the Dept. Information Systems, University Jaume I, Spain; and, Dr. Marco Painho and Prof. Dr. Fernando Bação, ISEGI, Universidade Nova de Lisboa, Portugal; for granted me with the Erasmus Mundus Scholarship.
My special gratitude goes out to Dr. Rafael Rafael Berlanga Llavori of the Temporal Knowledge Bases Group, University Jaume I , for his steadiness, guidance and most of the technical implementation of this work.
Also I wish thank my co-supervisors Carsten Keßler and Miguel Neto for their com-ments and suggestions.
I specially acknowledge to Dr. Oralia Oropeza of the Institute of Geography, of the University of Mexico (UNAM), for discussing ideas about the application domain.
Also I would like to thanks Arturo Torres of the National Commission for the Knowl-edge and Use of Biodiversity and Laura Díaz of the Interactive Visualization Center, University Jaume I, for their comments, suggestions and ideas regarding geospatial services and technologies.
I wish to thank all his my friends at home for being an important part of my life, and my master partners for make the program so pleasant; specially Mateu Aragó.
Acronyms and Abbreviations
BBC British Broadcast Company
DGA - Dependency Grammar Analysis
GeoFeed - Web Feeds tagged with geographical information.
GIE - Geographic Information Extraction
GIR - Geographic Information Retrieval
IE - Information Extraction
IR - Information Retrieval
NER - Named Entity Recognition
NGF - National Geostatistical Framework
NLP - Natural Language Processing
RE - Regular Expressions
RSS - Really Simply Syndication
TDB - Thematic Database
XML - eXtensible Markup Language
Abstract
The generation of geospatial databases is expensive in terms of time and money. Many geospatial users still lack spatial data. Geographic Information Extraction and Retrieval systems can alleviate this problem. This work proposes a method to populate spatial databases automati-cally from the Web. It applies the approach to the risk and disaster do-main taking digital newspapers as a data source. News stories on dig-ital newspapers contain rich thematic information that can be attached to places. The use case of automating spatial database generation is applied to Mexico using placenames. In Mexico, small and medium disasters occur most years. The facts about these are frequently men-tioned in newspapers but rarely stored as records in national databases. Therefore, it is difficult to estimate human and material losses of those events.
This work present two ways to extract information from digital news using natural languages techniques for distilling the text, and the na-tional gazetteer codes to achieve placename-attribute disambiguation. Two outputs are presented; a general one that exposes highly relevant news, and another that attaches attributes of interest to placenames. The later achieved a 75% rate of thematic relevance under qualitative analysis.
Key words: Geographic information extraction and retrieval; natural language processing; digital newspapers; risk and disaster domains.
CONTENTS CONTENTS
Contents
1 Introduction 1
1.1 Motivation . . . 1
1.2 Problem statement and use case . . . 3
1.3 Context . . . 4
1.4 Objectives . . . 5
1.5 Thesis outline . . . 5
2 Related work 6 2.1 Domain concepts . . . 6
2.2 GIR and GIE terminology . . . 7
2.3 GIR and GIE experiments . . . 9
2.4 Web Feeds and GIR/GIE . . . 13
2.4.1 Atom . . . 13
2.4.2 RSS . . . 16
2.4.3 Atom and RSS differences . . . 18
2.4.4 GeoFeed examples . . . 19
3 Methodology 22 3.1 Architecture . . . 22
3.2 Data Model . . . 23
3.3 News analysis . . . 29
3.3.1 Geo-NER . . . 32
3.3.2 Dependency grammar analysis . . . 36
4 Results and discussion 40
5 Conclusions and future work 44
A Appendix: Placename disambiguation 47
B References 51
C Online sources 56
LIST OF FIGURES LIST OF FIGURES
List of Figures
1 An Atom 1.0 document . . . 15
2 RSS 2.0 simple . . . 16
3 RSS 2.0 extended . . . 17
4 A GeoFeed . . . 20
5 BBC feeds in a map . . . 20
6 System architecture . . . 23
7 Data model . . . 24
8 Mexican divisions . . . 25
9 Chaos in Europe . . . 30
10 Process work-flow . . . 31
11 Grounded newspaper . . . 32
12 Geo-NER sample output . . . 35
13 Dependency tree . . . 37
14 Image of a dependency tree . . . 38
15 Output list from dependency tree . . . 40
16 Complex story . . . 43
17 Complex story II . . . 43
18 Tuples sample output . . . 49
LIST OF TABLES LIST OF TABLES
List of Tables
1 NGF code forming. . . 26
2 Place table . . . 26
3 Event table . . . 27
4 Disaster table . . . 27
5 Thematic framework . . . 28
6 Information types . . . 31
7 Regular expressions . . . 33
8 General evaluation . . . 40
9 Qualitative news ranking . . . 42
10 Database filled from Geo-NER output . . . 50
LIST OF ALGORITHMS LIST OF ALGORITHMS
List of Algorithms
1 Geo-disambiguation by codes . . . 34 2 Dependency grammar disambiguation . . . 39
1 INTRODUCTION
1
Introduction
There are multiple lines of research that use geospatial data. A common problem faced by people study them, is the imperilment to find and acquire thematic infor-mation in different geographic scales (i.e., state, municipal, urban, district, etc.). Probably the worst case would be when such information does not exist. This oc-curs in many countries and Mexico lies among them.
Our scope is to crawl newspapers and extract relevant information for the disaster domain. No matter if the news describe a big, mid or minimum event, we would try to record it in a spatial database. We aim to cover whole the Mexican Republic. And we are focusing on tracking records for State granularity level when county and village levels turns highly ambiguous.
We also intend to make the thematic data base (TDB) as much precise as possible to be readily available to any user. Our scope is to generate the TDB ready to be accessible for any geoclient. Before filtering dynamically daily news, we start using a testing file to review the results and feasibility of further system implementation. Regarding the legal restrictions, once we advanced in developing of the system, we are prone to incorporate the most suitable license for open access to the TDB. In the technical context, we will experiment using Web feeds fro extract geo-information.
The next sub-section of the introduction explain further the reasons that moved the author to carry out this research. After, we state the problem statement and a use case to address, followed by the overall goal and specific objectives to accomplish this research. The last part of section we describe the outline of entire document.
1.1 Motivation
The present research is stimulated by the scarcity of thematic geoinformation re-lated to risks and disasters domains in Mexico. There, the impact of disasters caused by conditions of social vulnerability, environmental degradation and natu-ral hazards was over 10,000 people were killed and 10,390 US$ worth of damage within 1980-1990 [Bitrán 2000]). By that time period the estimated losses were about 700 US$ each year. The above figures are based on information mainly gathered from mid and large size hazardous events.
The number of losses keeps rising. The National Center for Disaster Prevention of Mexico (CENAPRED acronym in Spanish), reported in 2008 1,275 million US$ on materials losses and about 1.5 million victims. These damages were caused by mi-nor events. To highlight, 90% had an hydro-meteorological onset (rainfall, flooding and tropical cyclones) [CENAPRED 2009]. This fact suggest disasters caused by
1.1 Motivation 1 INTRODUCTION
minor events may be equal or even more expensive than those triggered by large-scale events.
Therefore, the occurrences of smaller scale events are a serious accumulative problem, with the damage mainly built in local areas. Small scale events are poorly recorded in national databases [IADB 2005]. Their identification may help to under-stand the spatial variability of risk.
Our motivation is to increase logs of different size hazardous events and supple-ment records onto risk-disaster databases.
The analysis of this type of information can lead to spatial patterns to recognize and reveal risk conditions in different places. This would be an opportunity for communities to prepare better before upcoming natural hazards. It would also en-courage stakeholders to make appropriate decisions on time. Better decisions and improved social organization could be translated on reduce lost of lives and goods.
The goal of this work is reinforced by contributions gathered from the Natural Dis-aster Hotspots Project (NDH). This initiative is led by the World Bank and other research centers [Margaret et al. 2006]. HDN developed an overall risk blueprint analysis dealing with multiple hazards. Some outcomes of their second report pre-sume scarcity on subnational data sets. Most spatial risk databases cover limited periods of time and are too generic. This prevent probability estimation of recurrent dangerous events. As the authors mention:
• "Geographic areas that are identified as hotspots at the global scale may have a highly variable spatial distribution of risk at finer scales” [...]
• “Scale affects data availability and quality, comprehensive, better quality data permit more complete, accurate, and reliable identification of hot spots multi-hazard at finer scales of resolution” [...]
• “Scale affects the utility of the results. Better data resolution and a richer set of variables contribute to results that are more local scale relevant for risk management planning "[...]
• “The global-and local-scale analyzes are complementary"[Margaret et al. 2006].
Thus, our work would be a complementary effort for data generation. Focused on thematic geoinformation for the risk study at different spatial scales. We think this information will be suitable to be integrated and combined along other relevant data sets. For instance, base layers such as transportation, water networks, socioeco-nomic, environmental and health variables may be considered when risk analysis is
1.2 Problem statement and use case 1 INTRODUCTION
performed. Most of those baseline layers are typically created by national mapping agencies however they are not completely devoted to producing thematic data-sets.
1.2 Problem statement and use case
A common problem for spatial data infrastructures (SDI) in developing countries is the lacking of data, its access constraints and its reliability [Masser 2007, Nebert 2004]. Hence, we formulated some research questions to be addressed on the develop-ment of this work.
The two main questions are: is it possible to automate the creation of thematic domain data bases from the Web? If so, how to ensure its reliability? In answering these questions we hope the resulting information will be useful in many use cases. One of them is described below.
Risk and disaster management are multidisciplinary by nature. These domains involve researches from social, environmental and earth sciences. And I expect the outputs derived from the current experiment are available for everyone. To name a few of potential users of the database are: students, researchers and public officials of several ministries (i.e water, electricity, planning and civil protection, etc.). In this work all of them are called “the user”.
Supposing the goal of a user is to create a risk index as described in the [IADB 2005] report. These kind of statements need to integrate data from more than one source at different temporal and geographic scales. As a minimum input for analyzing these data and creating new outputs, we should solve the questions of where, when,how andwhat disaster has happened.
To know the place where a disaster has happened may help us to answer fur-ther questions. Such as how far, dense or destructed are the surrounding roads committed to that place. This would improve the efficiency management in the im-mediately response in case of an emergency. Likewise, it would be useful in the reconstruction and preparedness phases. Similarly, when an impact occurs will
help to record and log that event. This information can be used to track specific hazards and alert people and authorities to a certain period of time more prone to hazards. For instance, during the rainy season.
How and what are parameters that may lead to the categorization of the hazard
and risk types. For example, certain phenomena are complex in nature. They can be formed by more than one threat. For instance, a tsunami striking the coast of a populated town may have its origins tens of kilometers away because a strong earthquake triggered it. Another example is to know the places where recurrent
1.3 Context 1 INTRODUCTION
floods and landslides occur and determine if they were triggered by heavy rains left by hurricane rain shields or any other specific factor.
We think most of these questions may be answered properly by providing access to thematic spatial data bases (TDB). TDB containing reliable and constantly updated information may be used to perform many series of analyzes. One problem in their creation is the high time and resource cost. Our alternative to overcome with this problem is the automatic TDB generation using online sources; specifically digital newspapers.
1.3 Context
Here, we briefly describe where our work is related with other data collection initia-tives for disaster management.
Most geodata users would agree that almost all spatial databases are thematic. The disaster theme concerned in this work has been studied by many institutions. One of the largest worldwide data set has been created by the Center for Research on the Epidemiology of Disasters (CRED). They have standardized and compiled the disaster Emergency Events Database [1] including records from the early 1900’s up to date. They offer free and open access to the database through their website. Another worldwide initiative is the hotspots project, driven by The Center For Haz-ards and Risk Research at Columbia University (CHRR) [2]. Their project aims to contribute to efforts to reduce disaster losses. Their research program is conduct-ing a global-scale, multi-hazard risk analysis focused on identifyconduct-ing key “hotspots” where the risks of natural disasters are particularly high.
Following the global level, under the umbrella of the International Strategy for Disas-ter Reduction (ISDR), the Hyogo Framework for Action is committed for achieving disaster resilience for vulnerable communities [3]. They provide links to national platforms that may contain disaster databases.
In the regional framework, a recent initiative is Redhum [4], a virtual tool that pro-vides easy access through the Internet to updated humanitarian information from Latin America, allowing better disaster preparation and response. A similar project, driven by the World Food Program, is the Risk Management and Early Warning for Central America [5].
Concerning the online mapping contribution for disaster reduction, some online interactive maps and geovisualization tool including risk geoinformation are: the Global Disease Alert Map [6] and the “explore our planet” project [7], just to name a few. Most of them only provide means for visualizing such spatial data.
1.4 Objectives 1 INTRODUCTION
At the regional level, one year ago (November 2008), the Pan-American Institute of History and Geography prepared the agreement for the creation of the Pan Amer-ican Laboratory for Natural Disaster Monitoring [8]. Among their main goals is to promote the development of spatial databases, in order to support decision making and more efficient early warning systems and improve disaster response.
In Mexico, the National Center for Disaster Prevention and other government agen-cies in conjunction with some domestic universities work together studying the con-ditions of risk in the country. Some databases, especially at national level, are available upon request.
This work intends to be a complementary to those works and would be able to be linked with most of the mentioned projects.
1.4 Objectives
The major goal of this work is to create an automatic thematic data base for its potential use in risk and disaster management. The specific goals are to:
• extract information from text files using text mining techniques taking the dig-ital newspapers as a source,
• store such information in a spatial data base and
• make it accessible for any geoclient.
1.5 Thesis outline
Section 2 points to related work from information retrieval and extraction. In the same part we introduce Web feeds followed by a series of examples. In section 3 we explain the development of our methodology. In section 4 we summarize the results to finally draw some conclusions and future improvements to this work (section 5).
2 RELATED WORK
2
Related work
This chapter starts with the explanation of common terms referred to through the work. Beyond the context described in the introduction this experiment is closely linked to information retrieval and extraction. Both use techniques of data mining to accomplish knowledge discovery. Hence, we also introduce some of the concepts dealing with them, along other concepts closer to geoinformation retrieval(GIR)and
extraction (GIE). Afterwards, we provide an overview of various works developed
on GIR and GIE. We then describe the data format we are going to use for our experiment, followed by an outline of some projects that have used them.
2.1 Domain concepts
The work presented here focuses on collecting data and information related to risk and disaster management for different periods of time. It is convenient to define the concepts related to those subjects to avoid confusion through the reading.
We consent to use the term risk defined as "the probability of harmful conse-quences or expected loss of lives, people injured, property, livelihoods, economic activity disrupted or environment damaged resulting from interactions between nat-ural or human-induced hazards and vulnerable conditions" [UNDP 2004]. Risk is
conventionally expressed by the combination of the hazard and vulnerability.
[Blaikie et al. 1994] definehazardas"those natural phenomena that can adversely affect different sites in different time scales, with varying degrees of intensity and severity". Among the most common threats or hazards are earthquakes, floods,
droughts and landslides. The same authors express the termvulnerabilityas "... a combination of the characteristics of a person or group, expressed in relation to exposure to the threat arising from social and economic status of the individ-ual or community concerned". The concept of vulnerability is intimately related to
social processes in disaster prone areas and is usually related to the fragility, sus-ceptibility or lack of resilience of the population when faced with different hazards [IADB 2005].
A named “natural disaster” is a serious disruption triggered by a natural hazard
causing human, material, economic or environmental losses, which exceed the ability of those affected to cope.
The previous four defined terms are used generically throughout the entire docu-ment. New ones may appear in later sections explaining issues about their specific context.
2.2 GIR and GIE terminology 2 RELATED WORK
2.2 GIR and GIE terminology
Our work is associated mainly with Information retrieval and information extraction. The first concerns to archiving and finding information automatically ([Rijsbergen 1979, Singhal 2001]).
Information extraction (IE) is a type of information retrieval (IR) , whose goal is to au-tomatically extract categorized, contextually and semantically well-defined data of a certain domain, from unstructured documents [40]. Information Extraction distillate pieces of information that are salient to the user’s needs [Sundheim 1995, 40].
Text documents are data and may become information if they are relevant for users. Text can be extracted from unstructured and structured documents. Conversely to unstructured text, structured blocks define logic structures and may be easily processed by machines. Thus, unstructured texts are more complex to handle but they are spread immensely on Internet (e.g., social networks ).
Text analysis has been carried since around half a century using electronic ma-chines [Singhal 2001]. Information retrieval and extraction use natural language processing (NLP) techniques to mine, in this case text patterns [Christopher et al. 2008] [Rijsbergen 1979]. Natural language processing includes other sub-tasks. One of them is named entity recognition. The goals of named entity recognition (NER)
are locate and identify entities in text and categorize them. To perform that ac-tions NER requires to be engaged on a series of predefined named categories of a given interest ([40] [Rijsbergen 1979]); for example, a predefined word would be ”Fonden”, which is the Spanish acronym of an aid budget for disaster recovery in Mexico. To categorize block of text, NER tokeinzes words. Tokens are also known as lexemes. Therefore, the lexical processor splits sequences of characters into tokens and re-categorize them according semantic rules [Christopher et al. 2008]. There is a wealth NLP and NER tools, see [43]for example.
NER techniques can be classified into three types:
• Knowledge-based Systems
• Systems based on machine learning models and
• Systems that combine both
Our experiment focuses on Knowledge-based Systems. Such systems use rules patterns and grammars to learned from an armed corpus of text built on heuris-tics [Sundheim 1995]. Methods to recognize capitalization, perform geographical searching in gazetteers or in extensive name lists also rely on that systems [18].
2.2 GIR and GIE terminology 2 RELATED WORK
NER techniques are also been used in other approaches for categorizing word-entities in texts.
Alike NER, other natural languages techniques are used to process text corpora. For instance, "part of the speech" (PoS), which aims for categorize each word ac-cording its own attributes and the ones of their neighbors, then reclassifies to assign them to the appropriate category. Other approach is syntactic analysis, this method is devoted to detect relationships between atomic entities through a sentence (i.e., words). Syntactic analysis operates upon grammar rules on sentences of a given language. One if its branches is dependency grammar, whose deals to reveal how several elements across the text are related each other but also how those relation-ships get focusing on syntactic units [Alfonseca 2007]. Syntactic analysis may be performed superficially (shallow, chunking, etc.) and deeply. The result accuracy of each method depends upon the language used. A brief review of the results performed by the used of different NLP techniques can be accessed on [46].
[Alfonseca 2007] recognizes that extracting textual relations, entity recognition and classification, and ontology population are fundamentally the same problem.
We consider geo information retrieval and extraction (GIR/GIE) when focus for gath-ering georeferenced information. This relies on the geographic information science (GISc). GIR/GIE community have coined terms frequently used. Some of them are described in the paragraphs below.
Toponyms are used to name places over earth surface. Another commonly referred terms are geoparsing [10]and geocoding [11]. The former refers to identifying
geographic content from unstructured content as documents containing text ex-pressed using natural language. The latter means to turn over geographical coordi-nates from geospatial entities. For instance, postal codes, streets and addresses. A third associated concept is geotagging. This refers the process of attaching
explicit space and time identification to various media such as photographs, video and other digital documents. The geotag notion has recently been formalized by [Keßler et al. 2009].
All the above concepts are closely related to each other. For instance, if we have a website and want to know the location of its contents, we may use NLP toparse
its text paragraphs and annotate geocontent on it. If the same text has entities where street names and ZIP codes can be identified, we may use a geocoding service to obtain their geographic coordinates (this service could be included in the geoparsing algorithm). Also, we may find whether the website emits alerts and check if they have attached geographic coordinates. If so, those files then became
geotagged and now are GeoFeeds [15]. Also the website may have geotagged
photographs ready to be displayed on a map (see for example [13]).
2.3 GIR and GIE experiments 2 RELATED WORK
Other terms coined by the GIR community are Geo and Non-Geo ambiguity.
Non-Geo ambiguity occurs when place names are the same as common words [Smith 2002]. This metonymy looms in the case of the word “Freeling”. This word can be used rather to refer a place in South Australia or to name of a computational linguistic library .
Geo ambiguity appears when the same term matches with more than one place [Smith and Crane 2001]. For instance, looking for “Las Vegas” in Geonames’ [14] service, returns a list of populated places in Cuba, Honduras, United States and Venezuela.
Most of GIR and GIE experiments uses gazetteersin some way. Gazetteers are
geographical dictionaries that list geographic placenames and earth features, such as rivers, lakes and roads, and their location. They were traditionally collected and managed by official mapping agencies. However, recently, "new actors" are work-ing actively in dowork-ing the job. Examples of them are private companies, academia and many people from the Web 2.0 community. These dictionaries may contain sta-tistical information attached to the geographic features as well as vernacular and deprecated toponyms.
2.3 GIR and GIE experiments
Early approaches in GIR and GIE can be traced back to the early 80’s [Farrar and Lerud 1982] [Vestavik 2003]. Nevertheless, since the early and mid nineties there have been many advances; especially for indexing geographic fea-tures. From that time to date many contributions have been made mixing methods for different purposes. We conducted a brief review of some of them and the main techniques they used.
The GIR/GIE objectives and the procedures vary widely. For example, once terms are disambiguated they are used to improve existing gazetteers or create new ones[Twaroch et al. 2008]. Or also to identify the "geospatial extension" on Web pages in accordance with their thematic context. Similarly, others center their at-tention on visualizing the geo-content of Web sites. Also, there have been some
in-sights into the use of ontologies ([Jones et al. 2002] [Badia et al. 2007, Borges et al. 2003]) and knowledge representation ([Sallaberry et al. 2007]) for dealing with GIR/GIE.
Several of the ideas mentioned in the above paragraph stem from cognitive and lan-guage spatial models ([Egenhofer et al. 1991], [Xu 2007, Egenhofer and Mark 1995]). For example those presented by [Egenhofer et al. 1998], which deal with the use of the language to refer to spatial notions of daily life and their differences when they are expressed to query computer programs, like geographic information systems (GIS).
2.3 GIR and GIE experiments 2 RELATED WORK
An early and noticeable contribution on GIR was made by [Woodruff and Plaunt 1994 ]. They developed what was called Georeferenced Information Processing SYstem (GIPSY). This system was capable of extracting
relevant key words and phrases from documents discussing geographic ideas. The parser was created using lexical constructors to handle spatial relationships in the text, and was also supported to looking up words in a sophisticated thesaurus. That work offered a way to understand the meaning contained in the documents. After parsing and extracting the text, this data was computed through some probabilist functions, ranked and indexed. Finally, polygon overlaying using the weights from the previous ranks was performed. Thus, the goal was to output the most relevant areas mentioned in a given document.
In the area of large-scale gazetteers there have been several contributions. For instance: Perseus Digital Library [18], Alexandria Digital Library [Hill 200], Getty [35] and Geonames [Wick and Becker 2007]. They were developed under different approaches and for different objectives; they are widely used and still studied for the GIR and GIE community.
[Hill 200] carried out pioneering work concerning digital gazetteers for the Alexan-dria Digital Library project. Specifically regarding georeferencing places with geo-graphic footprints. One of the main assets of the author’s work is the process of assigning type categories to places.
2.3 GIR and GIE experiments 2 RELATED WORK
As the Internet popularity started growing, the emerging number of websites also grew in parallel. Then, new forms of information retrieval were rooted from mul-tiple sources. For example, in the field of toponym disambiguation, a significant contribution was provided by [Smith and Crane 2001]. Their approach was to ripe a method for toponym-disambiguation and evaluate its performance. The tasks were conducted under Perseus Digital Library project (PDL) [18]. To handle disam-biguation, PDL algorithms were constructed frominternal and external evidence.
The first uses honorifics, generic geographic labels and linguistic environment. The second is backed on gazetteers, biographical information and other linguistic knowl-edge sources.
After [Smith and Crane 2001] many other approaches has been developed. For example, [Smith 2002] deployed long stand methods to identify and visualize historical events appearing in unstructured documents. For similar purposes, [Smith and Mann 2003] have made some effort towards toponym disambiguation for unmarked place names in historical corpus of texts .
In the same area [Hu and Ge 2007] have used supervised machine learning for to-ponym disambiguation. They applied geo name entity recognition (Geo-NER) tech-niques to a corpus of news collection grounded from a national newspaper. Their objective was to find"identical","similar" or"part of" geographical entities through
an administrative feature gazetteer. They added more functionality to the system to improve toponym identification and tag-ranking. Afterward, they applied statistical and probabilistic classification models to disambiguate all surplus toponyms. One of their experimental outputs produced an accuracy of around 85% for the national level dictionary.
[Leidner 2007] automate toponym resolution. The authors performed placenamed frequency on text to express foot print extension of refereed places based on the meaning of words.
Other ways to parse the Web for various purposes have been found in the literature. [Twaroch et al. 2008] have experimented using vernacular name extraction from social Web sites to increase the placename entries in traditional gazetteers. [Leidner et al. 2003] experimented grounding geospatial names focusing on ex-tracting spatial information under the question-answering approach. The authors also created a method to visualize the information retrieved.
[Jones et al. 2008]have employed Web scraping to extract and compute uncertainty between naive and official corpus of geographic terms. The goal of the authors was to enrich and improve the quality of gazetteer’s vernacular terminology.
2.3 GIR and GIE experiments 2 RELATED WORK
[Amitay et al 2004] have carried out some research for exploiting the Web. They im-plemented a system capable of geotagging Web content such as photographs. The resulting accuracy was up to 80%. The authors also have performed geographic focus identification on websites. After parsing a set of websites they could detect more than 90% of times the extent of those sites.
Other efforts have been made to geotag Web content such as photographs, Flickr [17] is an example. Likewise, [Ahern et al. 2007] showed how to apply heuristics to the photography domain. What they developed was a method to extract georef-erenced photographs and display them in their corresponding spatial context. The authors argue that geovisualization tools help users to understand data trends and features, specifically for this kind of media.
In the same line, [Popescu et al. 2009] have analyzed metadata of photographs to deduct time stay and travel paths of voyagers. The authors used a set of georefer-enced photographs to perform their analysis. Their major goal was to analyze time and location tags attached to online photographs and extract information related to trips. They compare their final outputs (trips) versus those added by users on travel planning websites [16].
On the other hand [Manov et al. 2003] have used spatial knowledge base (KB) and ontologies for Web sttrapping. Instead of using geographic gazetteers as a source, the authors implemented structured KB into an ontology. Among the advantages of having that ontology are the way of handling relationship between geographic en-tities for disambiguation and reasoning. As they state, using ontologies increases system flexibility and enable users to customize it That features and other func-tionality, such as automatic schematic annotation, indexing and retrieval of unstruc-tured and semi-strucunstruc-tured content are found in what they called Knowledge and Information Management (KIM). The authors agreed that performing correctness on spurious terms other systems perform better and therefore its precision value increases.
[Zubizarreta et al 2008] have use geoparsing and geocoding to establish a ge-ographic focus (geofocus) in Web sites. The geoparsing process points to an ontology-based gazetteer for place name disambiguation. Followed by a series of filters tailored to increase the precision of geocoding locations. One such filter rates placenames according to their appear frequency text. Finally, the next agent uses the previous values to determine the geofocus of the crawled websites. The results show high precision with 5% error.
[Turner 2008] claims that extracting passively collected information can provide in-sightful and powerful data-sets. Other approaches aiming ontology population for
geographic data are made by [Badia et al. 2007, Borges et al. 2003] and [Jones et al. 2002]. Similarly, the model used by [Sallaberry et al. 2007] uses semantics as backbone
2.4 Web Feedsand GIR/GIE 2 RELATED WORK
for extracting geo information from unstructured text; their results are suggestive.
As noted, much work has been done in the area of GIR and GIE. The application of NLP and mix of NER methods has yielded satisfactory results [SLINERC 2002]. In some cases the results have achieved almost hundred percent of accuracy (see [Sundheim 1995]). Other studies did not achieve the desired goals. Several of the techniques cited so far use NER in one of their processing step. [Stokes 2008] have performed measurements over different NER approaches on GIR performance to determine their accuracy. That can be taken as a bench mark when implementing future projects.
The next point give examples of studies carried out by fetching Web feeds for the same purpose.
2.4 Web Feeds and GIR/GIE
In this section we explain some works for GIR using Web feeds. To understand it better and since our experiment uses the same format, we started summarizing the features of Web feeds.
Web feed Web Feed is a data format used to give users frequently updated content. They are a simple way to read and write information on the Web [25]. Web feeds are usually automatically created by a Web content management system (CMS). Those systems are due to manage work flow in a collaborative environment. Specifically, Web CMS are able to simplify the publication of Web content; for instance, by using Web feeds. Those feeds can be accessed in a central way by using a feed reader, which is a Web client that aggregates feeds from different Internet sources[41].
Web feeds are XML documents, then they inherit all XML features such as security, structure, extensibility and namespace. There are two Web feed formats: Really Simply Syndication (RSS) and Atom. Both formats are referred to in this work as "Web feed" or simply as "feed". Their development can be tracked back to the late 90’s but Atom is more recent. Likewise, both share more than one version. At the time of this manuscript the Atom comes in its second edition (version 1.0). For RSS, the latest version is 2.0 but version 1.0 is still used in many websites. Below we give further explanation of each format.
2.4.1 Atom
Here we give an introduction about the Atom format. Since this a summary, we will briefly review its structure and highlight some of its common elements.
2.4 Web Feedsand GIR/GIE 2 RELATED WORK
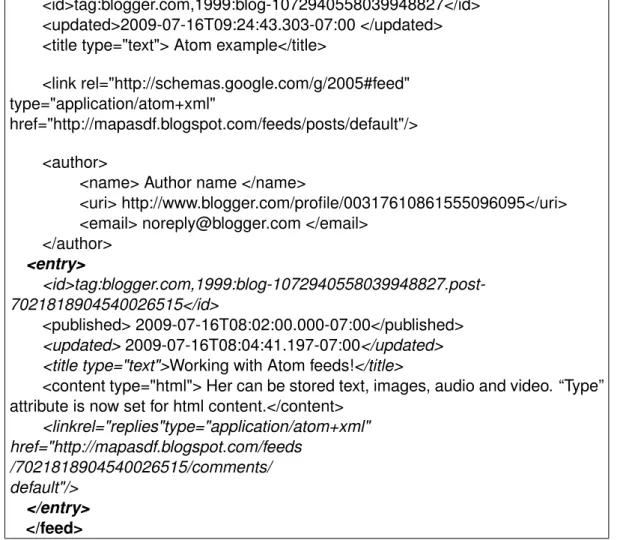
An Atom document is divided in two parts. The first one is the representation of the feed and includes all other member elements. This item is the root of any Atom document and can be identified with the “feed” element. On the other hand, the “entry” element represents exactly one entry. Inside a feed may be one or more “entry” elements containing the metadata. Figure 1 shows an example of an Atom version 1.0. Required elements at feed level are: <title>, <updated> and <id>. They first identify the feed’s title; the updated element is to determine the time when a feed is modified; id is a permanent universal unique identifier included in feed and entry elements.
Other recommended elements for the root level are: <author> and <link>. The former includes the name and contact address of the author. The link specifies a reference from the feed to a Web resource. This element also must be inside each entry in order to be valid under the World Wide Web Consortium(W3C)
specifica-tion. The document in Figure 1 was simplified for better understanding and may not be w3c valid.
2.4 Web Feedsand GIR/GIE 2 RELATED WORK
<?xml version="1.0" encoding="UTF-8"?>
<feedxmlns="http://www.w3.org/2005/Atom">
<id>tag:blogger.com,1999:blog-1072940558039948827</id> <updated>2009-07-16T09:24:43.303-07:00 </updated> <title type="text"> Atom example</title>
<link rel="http://schemas.google.com/g/2005#feed" type="application/atom+xml"
href="http://mapasdf.blogspot.com/feeds/posts/default"/>
<author>
<name> Author name </name>
<uri> http://www.blogger.com/profile/00317610861555096095</uri> <email> [email protected] </email>
</author> <entry>
<id>tag:blogger.com,1999:blog-1072940558039948827.post-7021818904540026515</id>
<published> 2009-07-16T08:02:00.000-07:00</published>
<updated>2009-07-16T08:04:41.197-07:00</updated> <title type="text">Working with Atom feeds!</title>
<content type="html"> Her can be stored text, images, audio and video. “Type” attribute is now set for html content.</content>
<linkrel="replies"type="application/atom+xml" href="http://mapasdf.blogspot.com/feeds
/7021818904540026515/comments/ default"/>
</entry>
</feed>
Figure 1: Sample structure and content of an Atom 1.0 document.
Mandatory Atom elements are emphasized in italics. The entry element (bold and italics) define the metadata of the feed. Every entry has a unique id, publishing and updating elements. The content element is hatched for storing text, audio, images, video or other any other media. The link element may have up to six different attributes. In our example (Figure 1) it is noticeable that the “href” attribute appears several times. This attribute is required, and points to a Internationalized Resource Identifier (IRI).
Another two important elements (which do not appear in the example) are “source” and “rights”. They define the legal issues and rights behind the feed.
One of the advantages of Atom format is that it can be extended. Also this version is accompanied by a protocol [26] for publishing and editing Web Resources. For all its features (security, extensibility, modularization, protocol, etc.), Atom is probably to become the universal standard for reading and writing information on the Web.
2.4 Web Feedsand GIR/GIE 2 RELATED WORK
However, it is still far from that level. This is our impression after reviewing that most online newspapers publish their content using RSS.
The first atom version was 0.3. Now this is disregarded and replaced by the version 1.0. Atom 1.0 has many of elements and features not mentioned in this document. They can be found in the original reference, see [25].
2.4.2 RSS
The next most popular Web feed format is known as Really Simple Syndication (RSS). It was the first Web feed designed to “feed” Web content. After all the modifications to previous versions 2.0.x is the one currently in use and undergoing progressing research. The last RSS published version is 2.0.11. The peculiarity of version 2.0 is that for first time namespaces were added to a RSS document. Also, new elements adding information [Ayers and Watt 2005 ], especially for authoring person and software feed’s. As in earlier versions, this one has a top level element named “rss” (bolds in Figure 2) . This item has nested an unique “channel”element (bolds and italics) . The channel is the metadata of the feed. All the rest of the elements are nested inside the channel. Some of these children elements are required and others are optional.
The RSS requires only three elements in the channel to be working and valid: title, link and description (Figure 2). The flexibility afforded by the optional elements can extend the feed enhancing its functionality .
<?xml version="1.0" encoding="UTF-8"?>
<rss version="2.0">
<channel>
<title>Here comes the title</title> <link>http://example.com</link>
<description> Here we describe the feed</description> </channel>
</rss>
Figure 2: RSS 2.0 document.
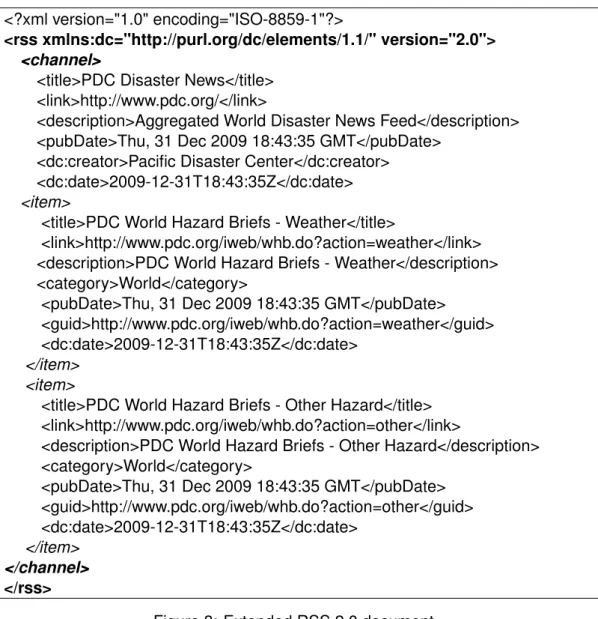
Inside a channel, an optional element named “item” can be included. There may be more than one item element per channel. An item may contain children elements such as: title, link, description, publication date and source (Figure 3). All elements of an item are optional but at least one of title or description must be present (for complete reference see[28]). The item element serves to represent the metadata
of an RSS.
2.4 Web Feedsand GIR/GIE 2 RELATED WORK
<?xml version="1.0" encoding="ISO-8859-1"?>
<rss xmlns:dc="http://purl.org/dc/elements/1.1/" version="2.0">
<channel>
<title>PDC Disaster News</title> <link>http://www.pdc.org/</link>
<description>Aggregated World Disaster News Feed</description> <pubDate>Thu, 31 Dec 2009 18:43:35 GMT</pubDate>
<dc:creator>Pacific Disaster Center</dc:creator> <dc:date>2009-12-31T18:43:35Z</dc:date>
<item>
<title>PDC World Hazard Briefs - Weather</title>
<link>http://www.pdc.org/iweb/whb.do?action=weather</link> <description>PDC World Hazard Briefs - Weather</description> <category>World</category>
<pubDate>Thu, 31 Dec 2009 18:43:35 GMT</pubDate> <guid>http://www.pdc.org/iweb/whb.do?action=weather</guid> <dc:date>2009-12-31T18:43:35Z</dc:date>
</item> <item>
<title>PDC World Hazard Briefs - Other Hazard</title> <link>http://www.pdc.org/iweb/whb.do?action=other</link>
<description>PDC World Hazard Briefs - Other Hazard</description> <category>World</category>
<pubDate>Thu, 31 Dec 2009 18:43:35 GMT</pubDate> <guid>http://www.pdc.org/iweb/whb.do?action=other</guid> <dc:date>2009-12-31T18:43:35Z</dc:date>
</item>
</channel>
</rss>
Figure 3: Extended RSS 2.0 document.
A summary of the RSS elements is listed below. All of them lie in the channel but may also be inside the item element.
• Description (<description>): Summary of full text of the story
• Link (<link>): Should contain an Universal resource Locator (URL). For chan-nel is the corresponding source. For the item is the URL where points to.
• Title (<title>): Title of the feed. Usually in newspapers, the title of the item is equivalent to the news headline.
• Category (<category>): Is the class, which the feed belong to (i.e, media, science, music, news, academia, etc.).
• Cloud (<cloud>): Is used to manage feeds through remote services using the RssCloud application programming interface (API).
2.4 Web Feedsand GIR/GIE 2 RELATED WORK
• Copyright (<copyright>): Feed’s copyright statement . If the statement does not appear, it should not be assumed that the feed is public.
• Generator (<generator>): Software used to create the feed.
• Image (<image>): Feed’s image.
• Language (<language>): Identifies the feed’s language based on the W3C for HTML specification. For example, Bolivian Spanish is “es-bo”.
• Publication date and time of the feed (<pubDate>): In the format: Sun, 10 Nov 2008 06:30:00 GMT.
• Skip (<skipDays> and <skipHours>) : Indicates the date (day and hour) when the feed is not updated.
2.4.3 Atom and RSS differences
The feed’s user community is discussing, which of the two formats is the best. Here, we highlight some differences, most of them taken and slightly modified from [29].
Atom 1.0 is described in the request for comments (RFC) document 4287 [25] (last updated: December 2005), approved by the Internet Engineering Task Force (IETF). RSS 2.0 specification is copyrighted by Harvard University [28] (last up-dated: July 2003). The other main issues are described below.
• In regard to feed publishing protocol, the Atompub working group is in the late stages of developing the Atom Publishing Protocol [26], closely integrated with the Atom feed format. For its part, RSS can uses MetaWeblog and Blog-ger APIs based on the XML-RPC protocol [27].
• The required content is: for Atom 1.0 both, feeds and entries should include title, unique identifier and a last-updated time-stamp. While, RSS 2.0 requires feed-level title, link, and description and does not require any other elements inside the item. With respect to the payload issue, Atom has a well-designed payload container. Content must be explicitly labeled as one of: plain text, escaped HTML, well-formed XHTML markup, some other XML vocabulary, base64-encoded binary content or a pointer to Web content not included in the feed. RSS 2.0 may contain either plain text or escaped HTML, but there is no way to indicate which of the two is provided. The RSS 2.0 content model does not permit well-formed XML markup.
• Regarding auto-discovery, Atom has an application/atom+xml Multipurpose Internet Mail Extensions (MIME) type registered with the Internet Assigned Numbers Authority (IANA).
2.4 Web Feedsand GIR/GIE 2 RELATED WORK
• On extraction and Aggregation: Atom 1.0 allows standalone Atom Entry doc-uments; these could be transferred using any network protocol, for example XMPP. Atom also has support for aggregated feeds, allowing entries to point back to the feed they came from when they are included into other feeds. The only recognized form of RSS 2.0 is an <rss> document.
• About extensibility: Atom 1.0 is in an XML namespace and may contain ele-ments or attributes from other XML namespaces. RSS 2.0 is not in an XML namespace but may contain elements from other XML namespaces.
• URIs: Atom 1.0 specifies use of the XML’s built-in xml:base attribute for allow-ing the use of relative references RSS 2.0 does not specify the handlallow-ing of relative Uniform Resource Identifier (URI) references. Different feed readers implement differing heuristics for their interpretation. There is no interoper-ability.
• Software Libraries: Atom 1.0: XML::Atom, XML::Atom::Syndication, Feed-Parser, Rome, Apache Abdera. RSS 2.0: FeedFeed-Parser, Rome.
• Language Tagging: Atom uses XML’s built-in xml:lang attribute. RSS 2.0 has its own <language> element
• Authors: Both provide the option to specify the authorship.
• Schema: Atom 1.0 includes a (non-normative) ISO-Standard RelaxNG schema, to support those who want to check the validity of data advertised as Atom 1.0. The RSS 2.0 specification does not includes schema.
2.4.4 GeoFeed examples
Usually a Web sites does not provide Web feeds including coded geographic in-formation. Thus, when feeds are geotagged they change to become GeoRSS or GeoAtom, here both are named GeoFeeds. There are two GeoFeed formats one simple or lightweight, and another fully featured. The later is a profile of the Geog-raphy Markup Language (GML).
The light version requires one tag per object geometry to be valid. And also include the GeoRSS namespace declared in the XML document (Figure 4).
2.4 Web Feedsand GIR/GIE 2 RELATED WORK
<?xml version="1.0" encoding="utf-8"?>
<feedxmlns="http://www.w3.org/2005/Atom"
xmlns:georss="http://www.georss.org/georss">
<title>Earthquakes</title>
<subtitle>International earthquake observation labs</subtitle> <link href="http://example.org/"/>
<updated>2005-12-13T18:30:02Z</updated> <author>
<name>Dr. Thaddeus Remor</name> <email>[email protected]</email> </author>
<id>urn:uuid:60a76c80-d399-11d9-b93C-0003939e0af6</id> <entry>
<title>M 3.2, Mona Passage</title>
<link href="http://example.org/2005/09/09/atom01"/>
<id>urn:uuid:1225c695-cfb8-4ebb-aaaa-80da344efa6a</id> <updated>2005-08-17T07:02:32Z</updated>
<summary>We just had a big one.</summary> <georss:point>45.256 -71.92</georss:point> </entry>
</feed>
Figure 4: Modified from GeoRSS [15]
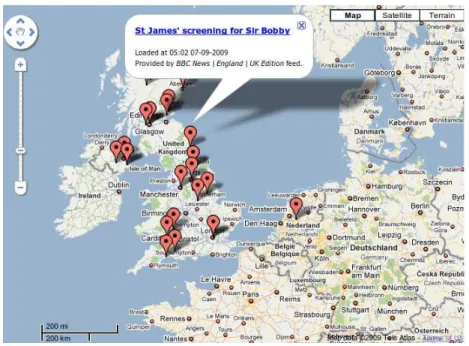
Web examples working with GeoFeeds can be seen in [30], [31] and [7]. Figure 5 refers to the second, which is committed to fetching news feeds from the BBC-UK edition, and display them in a map.
Figure 5: BBC news feeds for UK on Google Maps
The [7] example is well linked with the Geonames project [Wick and Becker 2007].
2.4 Web Feedsand GIR/GIE 2 RELATED WORK
This initiative has taken several approaches to geodata gathering and dissemina-tion. One of the most important factors that make this project successful that it’s supported by a vast geographical gazetteer. Besides their many names of different geographical features, at least 2.5 million belong to a placenames. The database is free to download and the Geonames community has added several services to access it. For example, any user can search for names of places and geographical features, view on a map, send by email and export them in different formats. Reg-istered users can edit the database, for example adding new records. That means the database is under constant review and is continuously updated. The project also offers an API to employ their extensibility.
The Geonames team has developed a service able to convert RSS to GeoRSS. The translator supports different languages. So that the processor work which needs well formed input files and valid XML. A summary of how the parser works is described below:
The tokenizer algorithm they introduced extracts the text contained in the title and description of each item and combines them in a single text. Star ting with the description, the processor tokenizes the word handing over to a par t of speech tagger for further processing using word frequency techniques. Afterward, a query generator discards irrelevant tokens and weighs them to be run against to the large Geonames database in different ways. After this, the algorithm computes a second score for the most relevant toponyms. The last processing routine gets help from feed’s items names to improve the disambiguation of the placenames. A test running by Geonames, suggest 90 % accuracy in extracting the correct terms. [Wick and Becker 2007] and [14].
We tested the service by entering the link from a Mexican newspaper. The news broadcast by this provider is in Spanish and is divided into sections. In our test we used the section "states". In this section, nearly all titles include one or more names of some state of the Mexican Republic. The results of the parser were accurate when the title included only a name. However, when there was more than one, the parser took the first and assigned the coordinates (latitude, longitude) assuming that the news only corresponded to that place. We believe Geonames’ parser is practical when users want to discover at a glance where news is happening, without being concerned with the precision of the place in cases where there is more than one.
Metacarta ([44]) offers Web mapping applications to process text within news sto-ries using proprietary technology. It extracts geographic places mentioned in new stories and identifies their respective latitude and longitude coordinates. The places are then represented through a customized geobrowser. The company offers a free API to test many other related services.
3 METHODOLOGY
On the other hand, looking at Web, we detected other parser dealing with feed and GeoFeeds.GeoFeed[21] is a beta processing tool for identifying and extracting
ge-ographical references from feeds. This tool returns a news feed including a tag with the geographical places within the original feeds. This product offers a “loose API” and is only available for detecting cities and States of U.S.A. The developer com-pany plans to provide better toponym and disambiguation processing to improve identification accuracy. At the writing of this work, their page does not provide com-pressible explanation of the parsing algorithm. A resulting example seems to rank the cities according to the possible States they belong. Alternatively, we explored displaying a map from their “Recent Feed” Web link to check the location of the returning results, but got an error even after attempting it several times.
3
Methodology
In this section we present the conceptual design of our extraction approach. This aims to extract geo-information from unstructured text to populate a database. We begin introducing the methodology with the architecture of the system, followed by a description of the data model, including a comprehensive explanation of its components. Afterward, we describe the steps that fulfill the experiment.
3.1 Architecture
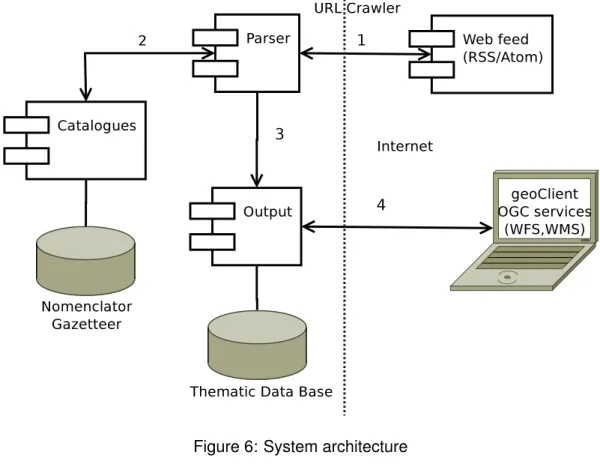
The architecture presented here is set up under the client-server design. Our sys-tem include four components (Figure 6). The first one consist of an agent stylized for reading Web feeds from Internet sources continuously. Those feeds are ac-cessed by their universal resource locator (URL) and used as input to be analyzed in the second component. This component is meant to filter against a built-in cata-log and extract geographic information from those feeds producing an output (third component). The output is turned into a database, which will be ready to be ac-cessed by a geoclient (fourth component).
The Web feeds alike the geoclient are on the client side. The catalogs, the parser processor and the database rest on the server side. All the components get com-municated on Internet through a common gateway interface (CGI). A CGI is a inter-face for external programs to interact with information servers such as Web servers [42]. The interaction between programs in the CGI can be done over different busi-ness layers.
There are many technologies involved in handling the data transactions and pro-cesses phases. The code development is constructed using the philosophy of
3.2 Data Model 3 METHODOLOGY
ware ecology, which allows use components from several sources and be reused to create new ones (Cook and Daniels 1994).
Figure 6: System architecture
3.2 Data Model
In this section we describe the data model used for our system. The data model gathers the information required in situations such as those described in section 1.2. Therefore, it includes places, attributes related to risk and disaster subject, and additional layers.
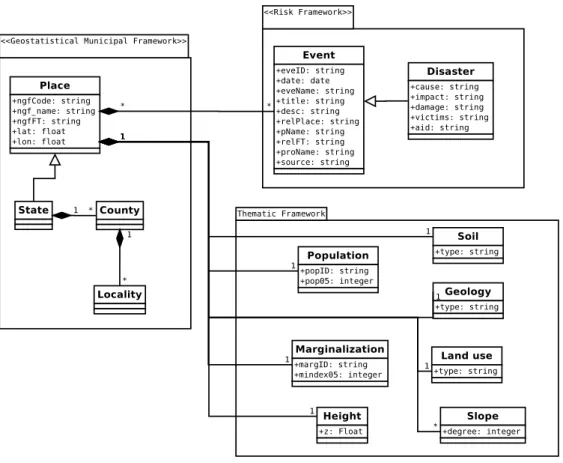
The data model is divided into three parts (Figure 7). One concerning thenational geostatistical framework. Secondly, therisk framework package, and thirdly a the-matic package containing complementary layers. The constraints of a news story
is stored in the database described in section 3.3.
3.2 Data Model 3 METHODOLOGY
Figure 7: Data model
National geostatistical framework
The national geostatistical framework (NGF) package has the classes Place, State, County (county is synonym of municipality) and Locality (Figure 7). At the same time State class is composed by County and County by Locality. Since Place is the generic class, the remaining classes are its children and inherit its features. The attributes of the Place class are: name, code, type and geographic coordi-nates. Those features are modeled following the administrative structure used for the Mexican territory described below.
The NGF is a system created, maintained and distributed by the Mexican national mapping agency: National Institute of Statistics, Geography and Informatics (IN-EGI, initials in Spanish [23]). The NGF was designed to correctly reference the statistical information from census and surveys at their corresponding geographic location. The catalog used in our work is based on the NGF structure, which is divided in three levels: state, municipality and locality. This nomenclator contains most of the Mexican placenames.
The NGF dictionary contains 31 names of each state and one for the Federal Dis-trict. Unlike states, the Federal District is considered different by the legislation. But here we treat it as a state because our processor handles its code in the same way.
3.2 Data Model 3 METHODOLOGY
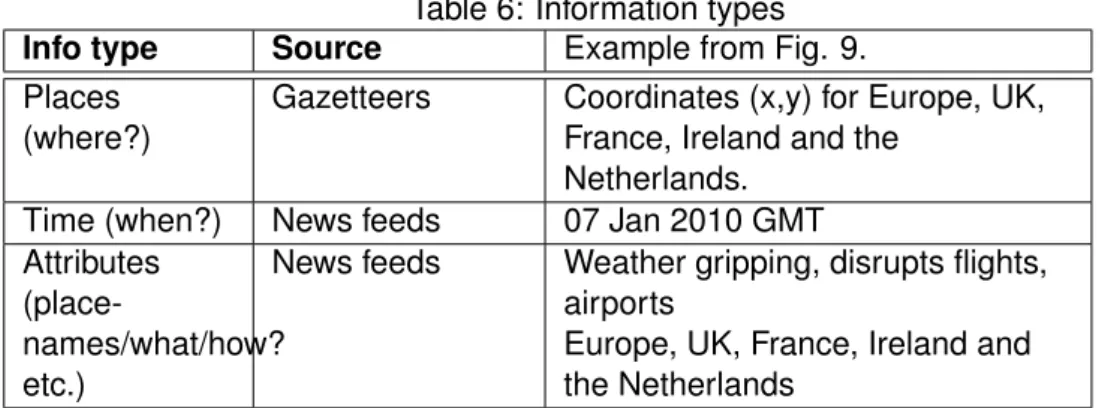
The 32 states are depicted in Figure 8.b. INEGI uses two digits to code state en-tities. The range starts from 01 to 32. Those numbers are assigned consecutively based on alphabetic sorting. Therefore, “Aguascalientes” is heading the list and “Zacatecas” comes last.
Mexico
United States
90°0'0"W 105°0'0"W
30°0'0"N
15°0'0"N
¹
a) Country b) State
c) County
d) Locality
0 500 1,000Km
0 100 200Km
0 500 1,000Km
0 25 50Km
Figure 8: Administrative divisions in Mexico. Source: [23]
States are composed of one or more municipalities. That composition can be seen in Figures 7 and 8.c. The national mapping agency assigned three-digit numbers to code municipalities. The chain of municipalities ranges from 001 to 999 (Table 1). As of September 2009 [24], the catalog has a total of 2456 municipalities.
The next level in the administrative hierarchy below counties are localities. Those entities are defined by places having one or more houses, which can be inhabited or uninhabited. The name of localities are given by their local people and if not they are officially set by law. By November 2009 INEGI recorded around 293,716 localities [24]. Most of them (284,741) were located in rural areas. INEGI uses four digits to encode localities (Table 1). Some of these villages spreading on the state of Tamaulipas are depicted in Figure 8.d.
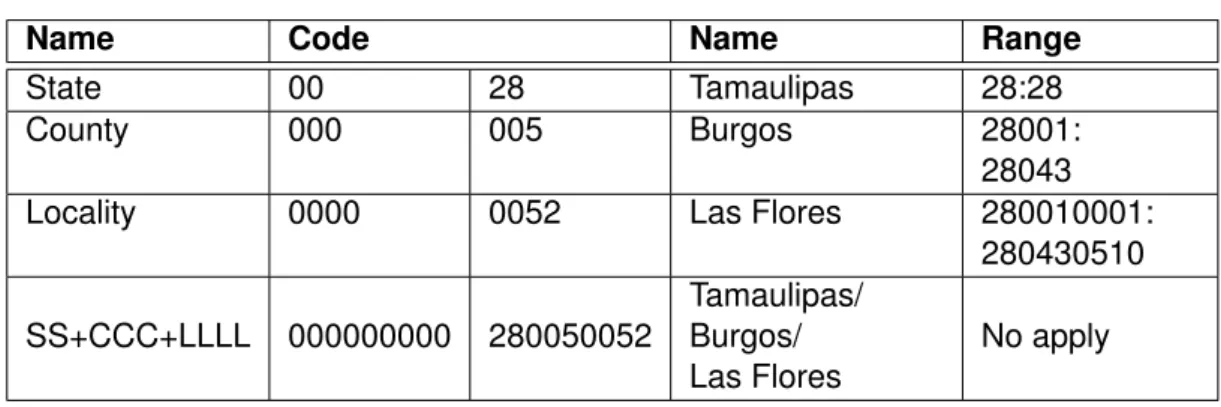
In summary, the geostatistical keys are set depending on their disaggregation level. The order that their code follows is: SS +CCC+ LLLL. Where: SS = state, CCC= county and LLL= Locality. Table 1 provides the list of the NGF standard and gives an example .
3.2 Data Model 3 METHODOLOGY
Table 1: NGF code forming.
Name Code Name Range
State 00 28 Tamaulipas 28:28
County 000 005 Burgos 28001:
28043
Locality 0000 0052 Las Flores 280010001:
280430510
SS+CCC+LLLL 000000000 280050052
Tamaulipas/ Burgos/ Las Flores
No apply
For instance, the state entity listed in Table 1 and grayed on Figure 8 (northeast cor-ner) corresponds to Tamaulipas. Which is the 28th state in the country, comprising 43 counties and 520 localities.
The reference system for the NGF entities are expressed in geographic coordinates (lat / lon) [23]. States and counties are originally provided by INEGI as polygons (2D), but it should be stressed that in our database, they will be stored as points (0D), using the centroids from the former features.
Table 2: Place table
Field Description
ngfCode NGF Code. State 00; County 000, Locality 0000 ngfName Placename in the NGF
ngfFT Feature Type (State, County, Locality) in the NGF lat Latitude coordinate
lon Longitude coordinate
Risk Framework
We categorize the Risk Frameworkpackage into two classes, events and disasters.
The first is generic and includes the minimum attributes that the processor could extract from a story related to a natural hazard. The Event class exists if at least one place from the NGF is documented in the news. This indicates that there may be a relationship of one place to many events. If so a record is generated for every location. The same occurs if many places and one event is described or multiple locations match multiple events.
Similarly, when the processor identifies specific categories related to a disaster, then includes the class Disaster. This in turn inherits the attributes of the class Event. The design of the two classes is complementary, allowing us to maintain control and verify the precision in the outcome database.
3.2 Data Model 3 METHODOLOGY
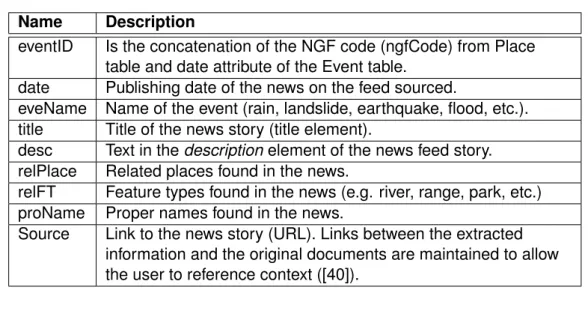
The metadata for the attributes of Event and Disaster tables are set in Figures 3 a 4 consecutively.
Table 3: Event table
Name Description
eventID Is the concatenation of the NGF code (ngfCode) from Place table and date attribute of the Event table.
date Publishing date of the news on the feed sourced.
eveName Name of the event (rain, landslide, earthquake, flood, etc.). title Title of the news story (title element).
desc Text in thedescriptionelement of the news feed story.
relPlace Related places found in the news.
relFT Feature types found in the news (e.g. river, range, park, etc.) proName Proper names found in the news.
Source Link to the news story (URL). Links between the extracted information and the original documents are maintained to allow the user to reference context ([40]).
Table 4: Disaster table
Name Description
cause I.e., if a flood was triggered by heavy rains, or by a hurricane. Other causes of disasters are poverty, weakness on the physical
infrastructure and social preparation. impact Is the sum of victim and damage.
damage Economic impact reported in a given currency (i.e., US$, C).
victim Number or reported evacuations, deaths, homeless. Other damaged objects (i.e., bridges broken/collapsed; acres/hectares flooded; houses destroyed; etc.).
aid Name of a potential aid supplier (i.e., United Nations, Red Cross, Civil Protection).
Most of the constraints in handling issues concerning places and attributes to fill in the database are explained in section 3.3.
Thematic Framework
We included a package named Thematic Framework because Mexican territory extends roughly over two million square kilometers. Such extension exposes many places to multiple hazards and we think thematic variables may help to reveal social, economic and physical vulnerability across that space.
This package comprises social and environmental variables. On the social side, the package contains the total population [23] and the marginalization index from
3.2 Data Model 3 METHODOLOGY
the National Council of Population for Mexico (CONAPO, acronym in Spanish) [33]. These indicators are available for the NGF division. The population data is obtained from the national census every ten years. Recently a population counting has been implemented every five years since 1995. The marginalization index follows the same NGF structure and also is provided every five years since 1995 [33].
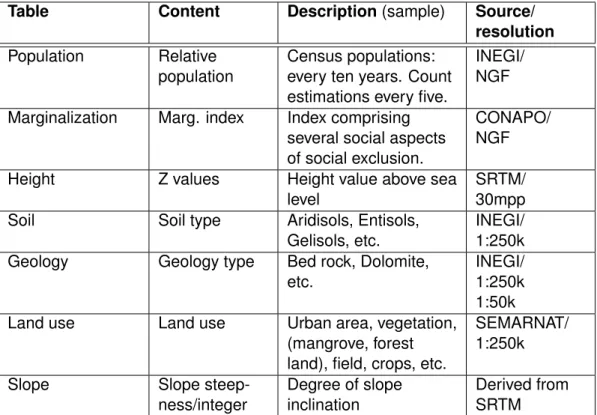
The environmental indicators we included are: soil type, geology, land use, slope steepness and height. Unlike the previous discrete indicators, these are continuous fields. They can be included by performing spatial operations (such as spatial joint) on the TDB points. Some characteristic of the layers are described below.
Table 5: Thematic framework
Table Content Description(sample) Source/ resolution
Population Relative population
Census populations: every ten years. Count estimations every five.
INEGI/ NGF
Marginalization Marg. index Index comprising several social aspects of social exclusion.
CONAPO/ NGF
Height Z values Height value above sea
level
SRTM/ 30mpp
Soil Soil type Aridisols, Entisols,
Gelisols, etc.
INEGI/ 1:250k Geology Geology type Bed rock, Dolomite,
etc.
INEGI/ 1:250k 1:50k Land use Land use Urban area, vegetation,
(mangrove, forest land), field, crops, etc.
SEMARNAT/ 1:250k
Slope Slope
steep-ness/integer
Degree of slope inclination
Derived from SRTM
Height and slope layers can be reaped from the SRTM (Shuttle Radar Topography Mission [34]). Soil and geology layers may be sourced from INEGI [23] at scales of one to one million and those listed in Table 5. In Mexico Land Use data is collected by the national and sub-national environmental agencies. The cartographic scale and time frequency of this layer varies.
Complementary information would provide insight into the time of data access and visualization. It would also give a better overview and understanding of the actual risk conditions where TDB spots are recorded. There are many more layers that can be added and combined with the TBA. Here we include only some that we considered relevant.
3.3 News analysis 3 METHODOLOGY
3.3 News analysis
In this section we explain the methods to extract geographic information from Web feeds. First we highlight some of the news features, and show how text data con-tained in digital news papers can fit our problem. Next, we explain the main char-acteristics of each of the processing phases.
A word on digital newspapers
We assume that texts on Internet newspapers contain spatial, temporal and the-matic information. For the first two types are well established reference system. Despite locations and their coordinates are defined in gazetteers, the attributes re-ferring to them do not. The same for the name of places (placenames) because we refer to them in multiple ways, and they change over time .
Since semantic reference systems, yet is an open research topic [Kuhn 2003], our biggest challenge is to extract the attributes to their corresponding location. And then generate the records presented in the data model (Figure 7). This semantic problem has been long sought since information extractions begun [40].
Regarding news broadcasters, they emit their feeds either in RSS or Atom. The information in digital newspapers can usually be dived in topic sections or as com-plete edition. Therefore, news feeds are split or keep as full document containing all the stories for a daily edition. The BBC for instance, offers news feeds separately for topics such as world zones, health, science, technology and entertainment to
mention a few. That company also offers the complete edition in a single feed[20]. This may brings drawbacks when a text processor deals with the mixed information contained in Web feeds. Because it may “confuse” the disambiguation processor at the time to identify categories our interest among a pull of meanings.
In the other hand, there are some advantages that newspapers offer. We consider highly important the writing style used by journalist when they report news stories. Usually they use capitalization on proper names and assign administrative hierar-chies when documenting locations. For instance, in Figure 9, Europe appears in the title and a list of other European countries remains in the description element. Following that hierarchy, if an agent aims for retrieving the countries inside Europe, the processor may look through a gazetteer to restrict the search under the geo-graphical extent of that continent.
Another advantage for extracting information from news is that each story is inside an item in the description element. Most news feeds contain only an excerpt or the first paragraph from the complete story. Besides, items have their own date and link attributes (see Figure 9 and section 2.4), this fact make less complex to identify the attribute data for each story.
![Figure 8: Administrative divisions in Mexico. Source: [23]](https://thumb-eu.123doks.com/thumbv2/123dok_br/15757876.639156/35.892.158.754.246.662/figure-administrative-divisions-in-mexico-source.webp)