A Work Project, presented as part of the requirements for the Award of an International Master Degree in Finance from the NOVA – School of Business and Economics and the Sao
Paulo School of Economics - FGV.
CURRENCY HEDGING IN EMERGING MARKET INVESTMENTS
MEHDI JAMIL (32293)
A Project carried out on the International Master in Finance Program at NOVA – School of Business and Economics, under the supervision of Professor Dr. Martjin Boons and on the International Professional Master in Finance at the Sao Paulo School of Economics - FGV
under the supervision of Professor Dr. Fernando Daniel Chague. January 17th, 2019
Abstract
This paper investigates whether currencies enhance performance of portfolios diversified over a number of different international markets from the perspective of an American based investor and determines what is the source and the extend of the added value. While the US market is considered to be the largest in the world, emerging markets are smaller, more volatile and contain more inherent risks but they do present huge potential and diversification opportunities for investors. Hence adding these foreign investments into their portfolios present risk reduction benefits for investors but it exposes them to the notion of currency risk. Hedging currency exposure could help mitigate those risks but it at what cost? It is indeed shown that hedging levels have different impacts on performance but also on the volatility associated with those investments. This paper aims at showing this risk-return dilemma, and explore optimal hedging strategies to mitigate against currency exposures in American emerging markets.
Key words: Minimum-variance hedge ratio (MVHR), emerging market (EM), Forward Premium, Optimal Hedging ratio.
1. Introduction
In an ever-globalizing world, investment portfolios are becoming more and more characterized by a significant and rising importance of foreign assets, which exposes portfolio managers with increased currency risk.
This study proposes a framework to analyze the impact of this exposure on the risk characteristics of portfolios but also on returns, in order to derive the associated optimal hedging strategy over time. Indeed, both academics and professionals have over the years oriented a lot of their attention towards the optimal hedging strategies in such settings with somehow conflicting results.
The optimal hedging strategy as defined by Bindelli (2013) is the one that minimizes the overall volatility of foreign investment, at a portfolio level and over a given investment horizon. The main trade off faced is the potential loss of expected return that arises from the lower volatility (Bailet et al., 1992). In our case, we will consider investments in the stock markets of emerging economies, namely the four major Latin American markets of Mexico, Brazil, Argentina and Chile. The investments in these economies stock markets will be undertaken from the viewpoint of an American (US) based investor given the geographical proximity and the historical influence of the United States on the continent.
This paper will first present the theoretical background behind this study in order to then provide empirical evidences in the second section to conclude with results and potential improvements.
2. Theoretical Background 2.1 International Diversification
The purpose for international diversification as presented by Solnik and Mcleavey (2003) shows that low international correlations between countries enable global investors not only to reduce the volatility of portfolios but also to offer opportunities for profit. In the table below are depicted the correlations between the American and Latin American stock markets.
Correlation US Chile Brazil Argentina Mexico
US 1
Chile 0.467070263 1
Brazil 0.615196293 0.52553957 1
Argentina 0.401447765 0.334297194 0.451025938 1
Mexico 0.644798015 0.451384325 0.618160176 0.545935838 1
Table 1 Correlation coefficients of the market returns in the main American stock exchanges
There is therefore a significant positive correlation between the US and the emerging markets in the Americas, with levels similar to correlations between developed economies like the US market and the EU which itself reaches a mean correlation coefficient of 0.6619 (Hyde et al., 2009). This can be explained by the strong influence of the US economy on these markets. There is also a strong correlation among these economies given their participation in trade agreements such as the ALENA and the MERCOSUR which might not allow for an optimal diversification as they appear to be interdependent.
Nonetheless, in a previous study, Solnik (1974) shows that cross-border portfolios are less risky than domestic portfolios especially if they are currency hedged. Also, despite increasingly important correlation between market returns, due to converging markets, Chiou (2008) argues that the benefits from global portfolios still outweigh the potential disadvantages. This comes as an extension to the concept of portfolio selection as developed by Markowitz (1959) which
aims at diversifying investment portfolios until optimal diversification is reached.
2.2 Emerging markets: an overview.
While the first phase of this international diversification saw capital flows from and towards developed economies such as the US, Japan and the EU, the emergence of new regional economic powerhouses has shifted part of these investments towards these countries. According to the institute of international finance (2017), portfolio investments towards emerging markets are expected to reach 430 billion dollars in 2019 and the trend is expected to continue.
Indeed, the persistence of significant expected returns and lower correlations with their domestic markets have led foreign investors to redirect important parts of their invested capital towards emerging markets despite some trade and geopolitical tensions. This was helped by political openness from the developing economies and a global liberalization of international markets in the late 1980´s. This capital inflow has certainly helped increase the stock market valuations in these economies. In Brazil or example, the value of Foreign investors as a share of the IBOVESPA market capitalization rose from 10% in 2000 to 20% in 2014 while the market capitalization of the index rose increases by 196% for the same period. As for Argentina, the main index increased by more than 2000% over the same period.
This has given some emerging market investors enough capital to undertake themselves international investments in order to diversify away the risks associated with their own domestic markets. Indeed, despite some control on capital flows, there has been an outflow from emerging markets towards developed economies, and this could be a research topic of its own due to the lack of research. To date, most of the research has been done about the more advanced economies and takes the traditional view, considering capitals flows from developed economies towards developing markets. The opposite movements are only being discussed in
rare occasions within the financial literature, such as by Bugar and Maurer (2002) in their study of the Hungarian investments in Germany, or for example, Walker (2008) who took the perspective of a Latin American based investor. His study concluded that cross border portfolios should not be hedged because emerging market currencies usually depreciate as international markets underperform.
Despite all of the positive incentives for capital flows towards emerging markets, studies from Smith and Warner (1979) suggests that emerging markets volatile economies and weak institutional environments, make direct constraints on capital flows and investing behavior. Indeed, inflation, volatile real-sector activity, poor political institutions and liquidity, in addition to interventionist states are all contributing factors for the volatility of their domestic currencies. This international diversification in emerging markets therefore has an important component of currency risk which can be hedged, but there is still no consensus on when and how this should be dealt with, especially for less mature markets.
As mentioned earlier, research has mainly investigated the case of capital flows from developed economies towards emerging markets and therefore the hedging strategies were also developed as a consequence.
The literature review presented below clearly shows it and presents different views on the hedging strategies that should be implemented. It is important to note that each country has its own characteristics which impacts each currency differently. What is true for our Latin Americas might not hold for other emerging markets in south east Asia for example. This demonstrates that currency hedging decisions are a unique process which contradicts an empirical finding by Black (1990) where he stated that the hedge ratios should be identical for all investors regardless of their nationality.
2.3. Currency risk
Hedging in emerging markets is more challenging and risky given the high interest rates driven by inflation and growth as opposed to more mature economies such as Germany or Japan where banks are currently undertaking reflationary policies. This risk is represented by the interest rate differential between two currencies. It is clear from Graph 1 that there are significant opportunities in carry trades given the interest rate differentials between emerging markets and the US but moves in the underlying currencies have often wiped any benefits of such trades. Hence, when the interest rate differentials widen too much, it can signal market instability and therefore risks for people holding assets in those economies.
Graph1: One-year interest rates for the period 2000-2018.
A traditional approach is to hedge the exchange rate risk completely via derivative products such as forwards.
They give the obligation to exchange two currencies at a future date and at a given exchange rate. The theoretical formula is as follows, with X as the exchange rate today (domestic/foreign) and F the forward rate:
0.00% 2.00% 4.00% 6.00% 8.00% 10.00% 12.00% 14.00% 16.00% 18.00% 20.00% 2/ 1/ 00 10/ 1/ 00 6/ 1/ 01 2/ 1/ 02 10/ 1/ 02 6/ 1/ 03 2/ 1/ 04 10/ 1/ 04 6/ 1/ 05 2/ 1/ 06 10/ 1/ 06 6/ 1/ 07 2/ 1/ 08 10/ 1/ 08 6/ 1/ 09 2/ 1/ 10 10/ 1/ 10 6/ 1/ 11 2/ 1/ 12 10/ 1/ 12 6/ 1/ 13 2/ 1/ 14 10/ 1/ 14 6/ 1/ 15 2/ 1/ 16 10/ 1/ 16 6/ 1/ 17 2/ 1/ 18 10/ 1/ 18
Interest rates Americas 2000-2018
𝐹 = 𝑋𝑒%&'%( (1)
With 𝑟& 𝑎𝑛𝑑 𝑟( as the one year interest rates for the foreign and domestic markets respectively. These forwards prevent arbitrage opportunities where an US investor could convert USD into MEX earning an average return of 6.5% to 10% through the differential and then simply convert it back to the base currency.
This raises questions about whether hedging the exchange rate risk is worthwhile and if so to which extent.
Eun/Resnick (1988, 1994) argue that hedging reduces volatility without any significant impact on returns and are strong advocates for the full hedge, which is also defended by Perold/Schuhman (1988) who argue that currency hedging is actually costless in terms of returns. However, Adjaoutk and Tuchschmid (1996) defended that from the theory, the full hedge is only advisable if the exchange rate returns and domestic returns are uncorrelated but also if the forward exchange premium is an unbiased predictor of the future exchange rate returns.
Empirical studies from Fama (1984) has questioned such theoretical restrictions due to a lack of empirical evidence to support the argument. In practice however, the majority of professionals such as fund managers choose to hedge their currency risk exposure, as they only seek out the equity return of the target country.
2.4. Previous research
Nonetheless, there is a consensus in the financial literature about the benefits of foreign exchange hedging in terms of portfolio risk reduction. Indeed, currency exposure affects portfolio risk but also affects returns because the returns on foreign currency are usually not zero, especially in the short term.
of international investments from the perspectives of German, Japanese, British and American investors. Using a time span of 34 years, he found that hedging currency risk substantially reduced the volatility of foreign investments. Also, and unlike previous studies, he finds empirical evidence that demonstrates the relevance of hedging for shorter time horizons (up to five years).
While there is a certain consensus regarding risk reduction of currency hedging, the debate is still open when it comes to the effect on returns.
Perold and Shulman (1988) recommend to fully hedge investments that have a currency risk, but also argue that based on the assumption that currency returns are zero in the long-run and that correlations of currencies with other asset classes are close to zero on average, hedging reduces risk but does not affect returns. As Froot argued in 1993, investors with a long term investment horizon would be naturally hedged against Exchange rate fluctuations by mean-reverting real exchange rates. Therefore, given this short term volatility, only investors who have short term investment horizons should hedge currency risk.
The majority of studies on currency hedging have usually taken the position of a U.S. Dollar based investor or from the perspectives of investors in any of the other four major advanced economies, but this study targets emerging market economies.
The first insight in this regard is that results cannot be generalized across currencies because for an investor, its base currency matters significantly in order to be able to come up with a hedging policy.
Indeed, from the literature, it can be inferred that results cannot be generalized across currencies as an investor base currency matters a lot due to various reasons such as domestic interest rates, inflation rates and other economic variables that can impact the foreign exchange rates and therefore the strategy.
findings show that the differences in hedged and unhedged returns are not statistically significant. This could be considered as a proof of failure of the uncovered interest rate parity, which links interest rate differentials between countries to expected exchange rate movements. As a logical extension of the forward bias, this means that investors from low interest rate currencies would benefit from keeping the currency exposure associated with foreign investments, especially in the bond Market. In this case, Latin American is a relatively high interest rate continent, with domestic rates of about 8% as of November 2018 (IMF, 2017) while the US market is a low interest rate country.
2.5 Currency return predictability and speculative effect
As presented before, the main objective of the paper is to study the benefits of currency hedging on risk and return of emerging market portfolios. However, when conducting such a study, it appears that there could be additional speculative benefits on currencies when conducting cross border investments.
Indeed, there is strong empirical evidence of currency risk premium in emerging markets. In this particular case, the US dollar trades at a premium in these markets as its forward value exceeds its spot value when traded against the emerging market currencies as shown in Appendix 1.1 and 1.2.
While Dumas and Solnik (1995) and Carrieri (2001) indicate that investors required lower returns from stocks that are exposed to exchange rate risk because of the diversification effect, Carrieri (2005) further showed evidence for long-term currency risk premiums in emerging markets. Hence, some investors might avoid hedging due to the non-zero expected return of currencies which represents potential investments via speculation (Carry trades for example). Hence adding a speculative effect could, on top of hedging could, be beneficial to an all equity portfolio as while hedging reduces the risk, speculation looks to make a profit.
An important question is therefore to know is it is possible to predict currency returns using forward premium/discount and if it is possible to speculate on it.
Also, it appears that this speculation offsets hedging.
3. Empirical study 3.1 Data
For this paper, we will use specific data covering a period of 18 years, from January 2000 until November 2018. It consists of dividend adjusted returns with the main stock indexes acting as proxies for the respective stock markets. In addition, Spot exchange rates for the emerging market currencies against the dollar are used while historical forward rates where not directly available so they have been computed. Indeed, in accordance with the theory forward rates were obtained using domestic interest rates for each of the studied countries in addition to the spot rates. The risk free rate used was an average of the US T-Bills for the period of interest. All of the Data is retrieved from Bloomberg and Thompson One, and descriptive statistics are detailed in table 6.
3.2 Methodology
First of all, the optimal hedging strategy is the one that minimizes the volatility of an international investment and is affected by various factors. The main component of volatility minimization are the variances and covariance’s of the unhedged investment and the currency. The logical intuition would be to go long on the currencies that have a negative correlation with our portfolio and short the ones that are positively correlated in case a full hedge.
The optimal hedge ratios have been forecasted by splitting the data set into two components an in-sample period, used for the initial parameter estimation and model selection running from January 2000 until December 2010, and an out-of-sample period, used to evaluate forecasting
performance which runs from January 2011 until November 2018.
3.3 Portfolio returns and volatility
Given existing evidence on the benefits of passive investment as opposed to active strategies, it is clear that a good representative of the performance of the stock markets of these emerging economies would be to track their main stock indexes. These are the Ibovespa for Brazil, the Mexbol for Mexico, the IGPA for Chile and the Merval for Argentina.
The portfolio used here is an equally weighted portfolio split between the four Latin American markets.
A study from DeMiguel, Garlappi, and Uppal (2009) demonstrates that out-of-sample performance of an equally weighted portfolio of different stocks is significantly better than that of a value-weighted portfolio, and no worse than that of portfolios that use different optimal portfolio selection models. The objective of this study is to investigate emerging markets in Latin America, so to have an equal exposure to all of these markets gives a good snapshot into the economic situation in the continent at all times.
Data on these markets was collected for the period January 2000-November 2018 on a monthly basis.
-‐ Brazil Mexico Chile Argentina USA
Return in $ 14.43% 29.53% 14.06% 17.26% 4.60% Return (domestic ) 7.74% 7.07% 9.17% 22.69% -‐ Standard Deviation $ 31.42% 39.46% 21.64% 36.53% 14.4% St. Dev. (domestic) 30.85% 26.43% 15.58% 43.19% -‐ Sharpe in $ 0.41 0.71 0.57 0.43 0.21
From Table 2 it appears that emerging markets have outperformed the US market as given by the Sharpe ratios. On average, these ratios are higher when converted back into dollars rather as compared to when they are kept in the respective domestic currencies, which suggests a potential depreciation of such currencies against the dollar.
3.3 Currency returns and volatility
As for currency returns, they have been computed using data for Spot exchange rates for the emerging market currencies against the US dollar and the following formula:
(𝑆012/𝑆0) ∗ (1 + 𝑅&)/(1 + 𝑅9:), (2) where St is exchange in $ per foreign currency
Giving the following results:
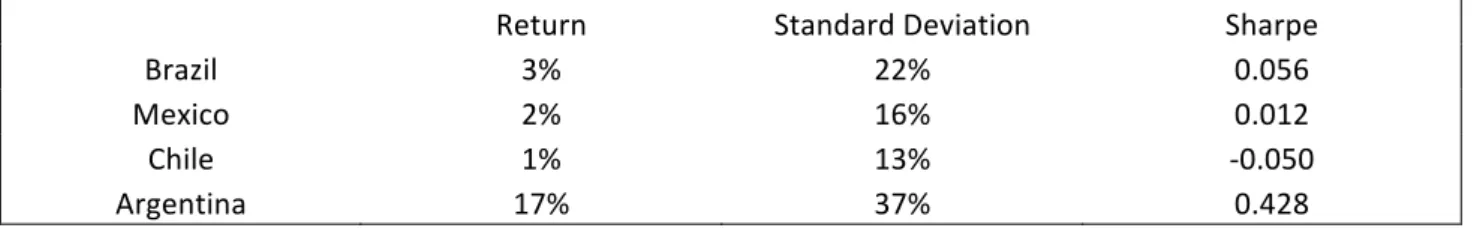
Return Standard Deviation Sharpe
Brazil 3% 22% 0.056
Mexico 2% 16% 0.012
Chile 1% 13% -‐0.050
Argentina 17% 37% 0.428
Table 3: Currency returns, standard deviations and Sharpe ratios.
Despite significant positive returns, high standard deviations lead to significantly low Sharpe ratios for the emerging market currency investments.
3.4 Fully hedged and unhedged portfolios
For the purpose of this study, two equally weighed portfolios tracking each of the four indexes were built, each following a different hedging policy. The first portfolio was left exposed to currency variations and no hedging was implemented, while the other was fully hedged by taking short positions in the denominated domestic currency forwards. The performance summary presented in table 4 shows that the fully hedged portfolio leads to a higher Sharpe ratio than the unhedged portfolio. Indeed, while the expected return decreased, the actual
volatility was affected to a higher extend which approves some of the previous theories. However, different weights or more active portfolio composition might lead to different results. The main hedging instrument for currency risk is the use forward contracts, which give the obligation to exchange two currencies at a future date and at a given exchange rate. The theoretical formula (1) was presented earlier, but given difficulties in obtaining historical data for such emerging markets, these forward rates were computed and showed that on average the US dollar traded at a premium.
3.5 Minimum-variance hedge ratio (MVHR): Optimal hedging ratio
According to Schmittmann (2010), for an investor investing in the foreign currency, the unhedged return of the investment is given by:
𝑅9,0 = 1 + 𝑅<,0 1 + 𝐸0 = 𝑅<,0 + 𝐸0+ 𝑅<,0𝐸0 (3)
Where 𝑅<,0 is the return of the asset class in local currency and 𝐸0 is the exchange rate return. As for the hedged return on a foreign investment with hedging we have:
𝑅&,0 = 𝑅9,0− 𝜑0(𝐸&− 𝑓0) (4) Where 𝑓0 is the forward premium derived from the covered interest rate parity, and 𝜑0 is the hedge ratio. We can derive the optimal hedge ratio by minimizing the variance of 𝑅&,0 with respect to 𝜑0 which can be done by running the following:
𝑅9,0 = 𝛼 + 𝛽 𝐸0− 𝑓0 + 𝜀0 (5) Where 𝜀0 is an error term and 𝛽 is an estimate of the MVHR.
After running the associated regressions, the following hedging ratios have been obtained:
Brazil Mexico Chile Argentina
Table 4: Hedging levels obtain from the MVHR analysis.
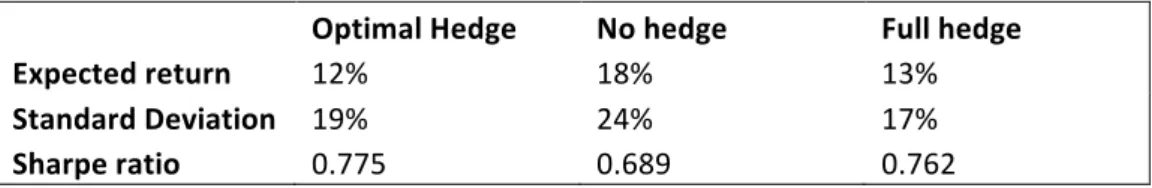
When implementing these ratios to the equally weighted portfolio, the performance if affected to the following extent:
Optimal Hedge No hedge Full hedge
Expected return 12% 18% 13%
Standard Deviation 19% 24% 17%
Sharpe ratio 0.775 0.689 0.762
Table 5: Performance summary for the hedging policies.
It appears that the expected return decreased as compared to both the full hedge and the no hedge portfolios which was also the case for the standard deviation. Ultimately, the effect was positive as it led to a higher Sharpe Ratio as compared to the other hedging policies.
4. Conclusion:
With a growing interest for foreign assets, the impact of currencies risk and the associated hedging decisions remain an important topic. While there is a theoretical consensus surrounding the benefits of international diversification when it comes to overall risk reduction due the exposition to a wider set of markets, there is less clarity on on how to deal with the main risky aspect of such investments that is the currency risk. Indeed, currency return fluctuates significantly in emerging markets, and impact the returns. This paper supports the idea that international equity investments in emerging markets should be hedged using optimal hedging ratios that are derived from the Minimum-variance hedge ratio formula as presented by Schmittmann (2010) as it improves performance measured by the Sharpe ratio if and only if the investor seeks a “direct” investment in those countries and offset any currency impact. The full hedge also produces risk reduction and improvements to the Sharpe ratio with significant results if compared to the non hedged equally weighted portfolio.
However, investors can use other different hedging levels or even speculate on the currencies in order to derive more significant returns.
References:
Adjaouti~, K. and Tuchschmid, N.S. (1996) Exchange Rate Dynamics, Currency Risk and International Portfolio Strategies, Finanzmarkt und Portfolio Management 10, 445-461.
Bailey, M. J., Tavlas, G. S., & Ulan, M. (1987), “The Impact of Exchange Rate
volatility on Export Growth: Some Theoretical considerations and empirical results”, Journal of Policy Modeling, 9 (1), pp.225-43.
BLACK, F. (1990), Equilibrium Exchange Rate Hedging. The Journal of Finance, 45:
899-907.
Carrieri, F., 2001. `The Effects of Liberalization on Market and Currency Riskin the EU', European Financial Management, 7, 259-290.
Carrieri, F., and B. Majerbi, 2005. `The Pricing of Exchange Risk in EmergingMarkets', McGill Finance Research Center, Working Paper,Montreal.
Chiou, W., 2008, Who benefits more from international diversification? Journal of International Financial Markets, Institutions, and Money 18, 466–482.
Cenedese, G., Payne, R., Sarno, L., and Valente, G. (2016). “What Do Stock Markets Tell Us about Exchange Rates?”. Review of Finance, Volume 20, Issue 3, p. 1045–1080.
Credit-suissecom. (2019). Credit-suissecom. Retrieved 4 October, 2018, from https://www.creditsuisse.com/pwp/am/downloads/marketing/trends_0203_dossier_en.pdf
DeMiguel, V., Garlappi, L. and Uppal, R. (2009) Optimal versus Naive Diversification: How inefficient Is the 1/n Portfolio Strategy? Review of Financial Studies, 22, 1915-1953.
Eun, C. S. and B. G. Resnick (1988): Exchange Rate Uncertainty, Forward Contracts and In-ternational Portfolio Selection. Journal of Finance, 43, pp. 197-215.
Eun, C. S. and B. G. Resnick (1994): International Diversification of Investment Portfolios, Us and Japanese Perspective. Management Science, 40, pp. 140-160.
Fama, E. (1984) Forward and Spot Exchange Rates. Journal of Monetary Economics, 14, 319-338.
Markowitz, H. (1959) Portfolio Selection Efficient Diversification of Investment. John Wiley & Sons, New York
Perold, A., and Schulman, E. C. (1988), “The Free Lunch in Currency Hedging: Implications for Investment Policy and Performance Standards”. Financial Analysts Journal, Vol. 44, pp.45-49.
Schmittmann J. 2010. “Currency Hedging for International Portfolios”, IMF Working Paper
Smith, C.W. and Warner, J.B. (1979) On Financial Contracting: An Analysis of Bond Covenants. Journal of Financial Economics, 7, 117-161.
Solnik, B., McLeavey, D., Ren, H. and Guo, N. (2007). International investments. Solnik, B. H., 1974, An equilibrium model of the international capital market, Journal of Economic Theory 8, 500-524.
Appendix:
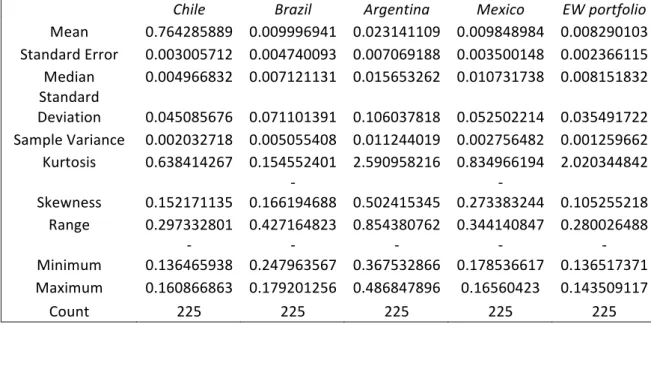
Table 6: Summary Statistics for the markets and the equal weight portfolio.
Chile Brazil Argentina Mexico EW portfolio
Mean 0.764285889 0.009996941 0.023141109 0.009848984 0.008290103 Standard Error 0.003005712 0.004740093 0.007069188 0.003500148 0.002366115 Median 0.004966832 0.007121131 0.015653262 0.010731738 0.008151832 Standard Deviation 0.045085676 0.071101391 0.106037818 0.052502214 0.035491722 Sample Variance 0.002032718 0.005055408 0.011244019 0.002756482 0.001259662 Kurtosis 0.638414267 0.154552401 2.590958216 0.834966194 2.020344842 Skewness 0.152171135 0.166194688 0.502415345 -‐ 0.273383244 0.105255218 -‐ Range 0.297332801 0.427164823 0.854380762 0.344140847 0.280026488 Minimum 0.136465938 -‐ 0.247963567 -‐ 0.367532866 -‐ 0.178536617 -‐ 0.136517371 -‐ Maximum 0.160866863 0.179201256 0.486847896 0.16560423 0.143509117 Count 225 225 225 225 225
Graph 2: Forward discounts $/BRL:
Graph 3: Forward discounts $/CHL, $/MEX