O
O
O
O
O
O
O
O
O
O
O
O
O
O
O
System to measure torsion modulus of polymers using the
deformation energy method
Carlos Alberto Fonzar Pintão
1*
, Lucas Pereira Piedade
1
and Edgar Borali
1
1
Departamento de Física, Faculdade de Ciências, Universidade Estadual Paulista –
UNESP, Bauru, SP, Brasil
*[email protected] Obstract
This paper presents an alternative method to measure the torsion modulus, G, for samples of polymers. We constructed a measurement system with a force sensor (FS) and a rotational movement sensor (RMS) to obtain a relationship between force (F) and torsion angle (θ). An expression that could return the value of G was deduced using the deformation energy method. This technique is nondestructive and independent of knowing the value of Poisson’s ratio. Samples with different diameters of polytetrafluoroethylene (PTFE) were submitted to quasi-static torsion at the same aspect ratio. The aim was to present and validate the use of the technique for a known polymer. The approximate value of 350 MPa of the torsion modulus G was found for PTFE samples. As the values obtained are within the limits found in the literature, the technique can be used to study samples of polymers and other materials.
Keywords: deformation energy, force sensor, polytetrafluoroethylene (PTFE), rotational movement sensor, torsion modulus.
How to cite: Pintão, C. A. F., Piedade, L. P., & Borali, E. (2019). System to measure torsion modulus of polymers using the deformation energy method. Polímeros: Ciência e Tecnologia, 29(3), e2019031. https://doi.org/10.1590/0104-1428.01019
1. Introduction
In order to predict the behavior of materials when subjected to stresses or loads, it is necessary to know their characteristics, such as rigidity (elastic modulus). This paper uses a specially designed system to determine the torsion modulus (G) of polymers. We have chosen the polymer polytetrafluoroethylene (PTFE), a well-known fluoropolymer, to validate the use of the technique. The properties of this polymer make it suitable for use in aerospace applications[1]
and the biomedical industry, for implants[2-4], making it
essential to know its elastic properties, such as the torsion modulus. In 1946, Renfrew and Lewis[5] was one of the first
to report a few mechanical parameters of PTFE, followed later by Thomas et al.[6], who published its tensile properties
related to crystallinity. Brown and Parrish[7] investigated the
tensile behavior of PTFE in a liquid nitrogen environment, showing a decrease in strength, and Kletschkowski et al.[8]
explored the elastic behavior of filled PTFE to develop models for seal materials. Rae and Brown[9] found that some
grades of PTFE are sensitive to strain-rate, temperature, and crystallinity under tension.
Dynamic torsion tests can also be used to characterize the viscoelastic properties of polymers[10]. Andreozzi et al.[11]
proposed a new procedure for measuring the shear modulus of laminated glass interlayers using a rheometer as a simpler and more reliable test than those presently in use. In a recent article[12], the authors use a dynamic technique based
on mechanical spectroscopy knowledge[13] and apply it to
biomaterials, determining the torsion modulus. The same
technique can be used to measure G in polymeric materials. However, this technique showed some limitations regarding the sample sizes, which were limited, and difficulty in obtaining relaxation curves of ductile polymer materials. Therefore, we developed an apparatus that is fixed to the same torsion pendulum used in the dynamic measure[12] and
which will be used as a means to overcome the limitations related to the dynamic method. In this work, we intend to introduce and apply a quasi-static technique to measure the shear modulus (G) of PTFE and, further on, of other polymers and materials. By using a force sensor (FS) attached to a coordinated table which is driven by Stepper motor, and a rotational motion sensor (RMS) capable of recording the torsion angle (θ), we obtain the curve force (F) versus torsion angle (θ). Circular cross-sections of PTFE samples with different diameters are subject to a quasi-static torsion and a linear adjustment from their curves provides a way to calculate the value of the torsion modulus. Although this technique uses concepts from the classical torsion test to determine the shear behavior of a material[14-16], in this
work we present a new approach for obtain G, which uses concepts such as torsion deformation energy and force work, with equation deduction especially for the system and measure. Also, the technique is consider nondestructive and different from the traditional quasi-static tensile test, where the information on the Poisson coefficient is needed to obtain G, this technique does not require knowledge of Poisson’s ratio, making it of great practical interest.
2. Materials and Methods
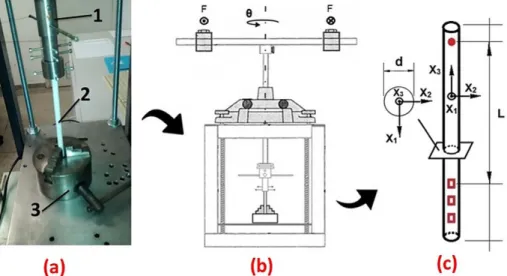
Cylindrical bars extruded of pure, commercial PTFE supplied by DuPont with dimensions of 10.85x500 mm, 8.00x500 mm, 6.50x500 mm, and 5.00x500 mm were used. Theses bars with different diameters d were cut and fixed in the measuring system under the same ratio L/d = 10.64, where L is effective length and then subjected to quasi-static torsion. One end of the sample was fixed to the pendulum with screws while the other was attached to a static three-jaw chuck, which allows adjustment of the clamping for different sample diameters (Figure 1). A detailed description of the system and measures is provided in section 2.4. For scanning electron microscopy (SEM) and differential scanning calorimetry (DSC) measurements, the samples were cleaned in the ultrasonic bath for 600s at 50W. These samples were only sawed and did not undergo any sanding or polishing process to avoid adhesion of abrasive grains or other impurities to the material, which could lead to misinterpretations of the results.
PTFE is a semi-crystalline fluoropolymer used as a high-performance material, with a low coefficient of friction, chemical inertia, and thermal stability properties. The carbon-fluorine binding force, together with the protection of the fluorine atoms surrounding its carbon chain, is responsible for these properties[17]. The material exhibits
four phases dependent on temperature and pressure, with the configuration of orthorhombic crystal as the only one not reached at atmospheric pressure[18,19]. Its high melt viscosity
(1011 Pa at 380°C) prevents pieces of this material being
obtained by traditional methods of injection and molding, with extrusion being one of the processes available for its production[20-22]. Depending on the processing route (thermal
history) used to obtain PTFE, the crystalline percentage of the material can be changed, which has a known influence on its mechanical properties[9,18,23]. Thus, it is essential to
estimate the degree of crystallinity of the material when subjected to mechanical testing. Several methods to estimate crystallinity can be found in the literature[1,24-27], of which
DSC was used in our work.
2.1 Density, ρ
The PTFE’s density was obtained through the Archimedes principle[28], a method based on volume displacement with
liquid (vF − v0) and sample mass (m), according to Equation 1:
f 0
m v v ρ=
− (1)
A 10.0 ml graduated glass cylinder was used with 5.0 ml of deionized water. The mass of the polymer was measured through an analytical balance in an air-conditioned environment at 25°C. By inserting a piece of extruded PTFE into the graduated cylinder and obtaining the volume of the displaced liquid, the density of the polymer is calculated by Equation 1. Three samples of each extruded bar were measured, and their mean density value is ρ = 2156.3 kg m−3.
2.2 Scanning electron microscopy
SEM was performed on a Zeiss, model EVO LS1. Samples were coated with gold for visualization. Measurements were made in high vacuum (10−3 Pa) with magnifications of 250x,
1000x, and 2000x of the internal region in longitudinal section of the PTFE bar. The aim was to visualize defects in the extrusion process, such as bubbles and cracks, which could compromise test results.
2.3 Differential scanning calorimetry
The DSC curve was obtained in the Mettler-Toledo model DSC 1 Staree System, using closed 40 µl crucibles with a hole in the cover. The sample mass was 14.46 mg, heated from 25°C to 350°C at a ratio of 10°C min−1 under
dry air atmosphere with 50 ml min−1 flow.
The crystalline percentage can be estimated by calculating the ratio of the heat of fusion (∆HF) obtained from the DSC
measurements and the heat of fusion of a theoretical 100% crystalline sample (∆H0
F), Equation 2:
Figure 1. (a) System for fixing samples: (1) shaft of the pendulum with fixing screws; (2) PTFE sample; and (3) three-jaw chuck.
( ) f sample C 0 f H X H ∆ = ∆ (2)
A wide range of values for the PTFE heat of fusion can be found in the literature, as shown by Lehnert et al.[27].
To calculate the crystalline percentage of our material, we use a mean of these values (80 J g−1), as did Rae and Brown[9]
and Jordan et al.[1] Also, the DSC was used to determine
the melt temperature (Tm) and the PTFE phase transitions at ambient pressure.
2.4 Measurement of torsion modulus G
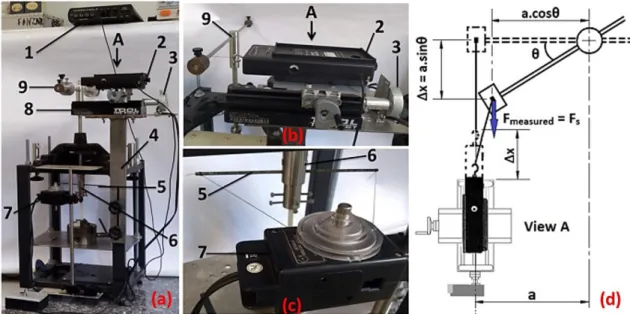
The system used to apply the torque (Mt) on one of the pendulum arms is shown in Figure 2. It consists of a coordinated table attached to a plate, which is fixed in relation to the structure of the torsion pendulum (Figure 2a and b). The sample is attached to the system as described in section 2, with the system previously positioned at the desired effective length L. Using an inextensible wire attached at one end to the pendulum upper rod and the other to the FS (FS-PASCO CI6537, 0.0305 newtons of resolution), it is possible to apply and measure the force. We used a 12V Stepper motor (60 Hz, 4 W, 3.3 RPM) to move the coordinated table in the two required directions: one for approximation and the other to draw it away from the pendulum (Figure 2d), twisting the sample at a rate of 3 x 10⁻⁴ s-1 (estimated value
of (θ* x 0.222)/120 s). The pendulum was placed at an initial position perpendicular to the sensor set to be pulled (Figure 2a and b). Using an RMS (RMS-PASCO CI6538, 1º and 0.25º of resolution ± 0.09 degree accuracy) capable of recording the torsion angle of the axis (θ) that holds one end of the sample, the force curves (FS) versus torsion
angle (θ) are obtained. The two sensors were connected at an interface to a computer. Using the software PASCO, the experimental points for F (N) and θ (rad) were obtained simultaneously in real time. We can thus adjust the straight line and obtain the slope of B, because the points have linear behavior in a region where the material shows elastic behavior. The slope B has the units N/rad. A correction must be made in relation to the angle measured in the rotation sensor (θ*) and the torsion angle in the sample (θ), due to the difference in diameters between the pendulum’s metal rod (which transmits motion) and the RMS, as shown in Figure 2c. The ratio (θ/θ*) of these angles is obtained experimentally and is 0.222 ± 0.001. This means that the angle measured in the RMS is greater than that of the torsion in the sample studied. Thus, slope B should also be calculated as B*/0.222. All samples were twisted at room temperature up to approximately 0.16 rad (9º) on the RMS, which equates as 0.0355 rad (2º) in the PTFE samples by the ratio correction. Three measurements were made for each sample diameter, with the RMS configuration in high resolution (division/revolution = 1440) and the sample rate of 1 Hz and the FS configuration in high resolution (100x).
To carry out these measurements we had to obtain a calibration factor, f, because the value of measured force (FMEASURED = FS) in the FS is different from that of applied force (FAPPLIED). Factor f can be obtained experimentally by applying known forces (FAPPLIED) and measuring the forces with the FS (FMEASURED). For this, we used known masses: 0.020, 0.050, 0.100, 0.200, 0.500, and 1.00 kg. They were fixed at one end of an inextensible cord passing over a pulley at the other end and attached to the FS. The local gravity is g = 9.79 ± 0.01 m s-2.
Figure 2. (a) System for measuring G: (1) interface (PASCO: CI7650-750); (2) force sensor (FS-PASCO: CI6537); (3) motor for moving
coordinated table; (4) torsion pendulum structure for coordinated table attachment; (5) pendulum’s metal rod; (6) shaft pendulum attached to the sample; (7) rotational movement sensor (RMS-PASCO: CI6538); (8) coordinated table; and (9) torsion pendulum. (b) Photo of the coordinated table attached to a plate, fixed in relation to the structure of the torsion pendulum. (c) Photo demonstrating the difference in diameters to calculate the ratio θ/θ*. (d) Schematic drawing showing some of the parameters used in section 2.5.
2.5 Deformation energy method for obtaining G
Consider an elastic structure subjected to applied loads and deformed elastically. In this deformation process, the principle of energy conservation[29] applies, expressed as:
E
W + = ∆Q E (3)
WE is the work carried out by applied external forces, Q is the heat exchanged by the structure with its surrounding area and ΔE is the variation in the associated deformation energies of the structure: kinetic energy of the particles (K) and internal energy (U). Considering that the increase in these loads is gradual (rate of 3 x 10⁻⁴ s-1) and that a state of
equilibrium is maintained in this process, then the variation of kinetic energy is zero, because there is no movement of either the amorphous or crystalline regions that occurs during plastic deformation[30]. Although there is a slight movement
of adjacent molecules, the variation is so small that it can be neglected. We assume the hypothesis that there is only elastic deformation due to the small deformation at which the test is performed (0.0355 rad). Thus, ΔE is due only to the variation in internal energy, U. In these conditions, Equation 1 is reduced to:
E
W = ∆U (4)
The work, which can be considered as energy stored in the structure due to torsion in an element of infinitesimal volume[29,31], is represented by strain and stress tensors, σ
ij
and eij, respectively. The energy, dU, stored in this element when the deformation has reached its final value eij is:
eij ij ij 0
dU= ∫σ de (5)
By integrating the entire volume, V, of the structure, we obtain the total internal energy, U, due to torsion, which is expressed as:
(eij ij ij) 0
U=∫ ∫σ de dV (6)
In cases where the elastic structure has linear behavior, it is isotropic, and it is subjected to pure torsion (Figure 1c). Using Hooke’s law[29], it is established that:
( 2 2) 12 13 1 U dV 2G σ σ =∫ + (7)
where G is the modulus of elasticity of torsion.
For measuring G, a prismatic bar with a uniform circular cross-section of area A and length L is subjected to applied torque (Mt) by an FS attached to a coordinated table at one end and at the other a torsion pendulum (see Figure 2a, b, and d). With regard to Mechanics of materials[31], it is known
that the stress state on an internal point of a polymer, xi, under the experimental conditions shown in Figure 1c, is expressed as: t 3 12 M xJ σ = (8) t 2 13 M xJ σ = (9)
The polar moment of the cross-sectional area is represented by J, which is given by J d4
32
π
= . Substituting these stress components into Equation 7 yields the internal strain energy in the structure for this specific application:
2 t M L U 2GJ = (10)
The torque of torsion is: cos
t S
M =F a θ (11)
The external work conducted by Mt is:
E 1 t
W M
2 θ
= (12)
Equating Equations 10 and 12, and for a very small θ, we find:
S G J
F B
L aθ θ
= = (13)
If we replace the values of the polar moment of the cross-sectional area, J, and use B and the calibration factor of the FS, f, we obtain an equation for the calculation of G:
B L a
G f
J
= (14)
Knowing the values of the polar moment of the cross-sectional area of sample J, the slope obtained in the torsion test B, the calibration factor of the FS f, the pendulum arm length a, and the effective length at which the sample is positioned L, we can calculate the torsion modulus G by using Equation 14. In this work, to determine B*, the correlation coefficient r was used to best fit the line to the experimental points (the adjustment is better when r is closer to 1). The error associated with B* refers to the standard deviation value. We used the error theory to calculate the error propagation relative to the magnitude G, where the standard deviation uncertainty in G is, in the first approximation, given by:
² ² ² ² ²
2 2 2 2 2 2
G GB B GL L Ga a GJ J Gf f
σ =∂∂ σ +∂∂ σ +∂∂ σ +∂∂ σ + ∂∂ σ
(15)
3. Results and Discussions
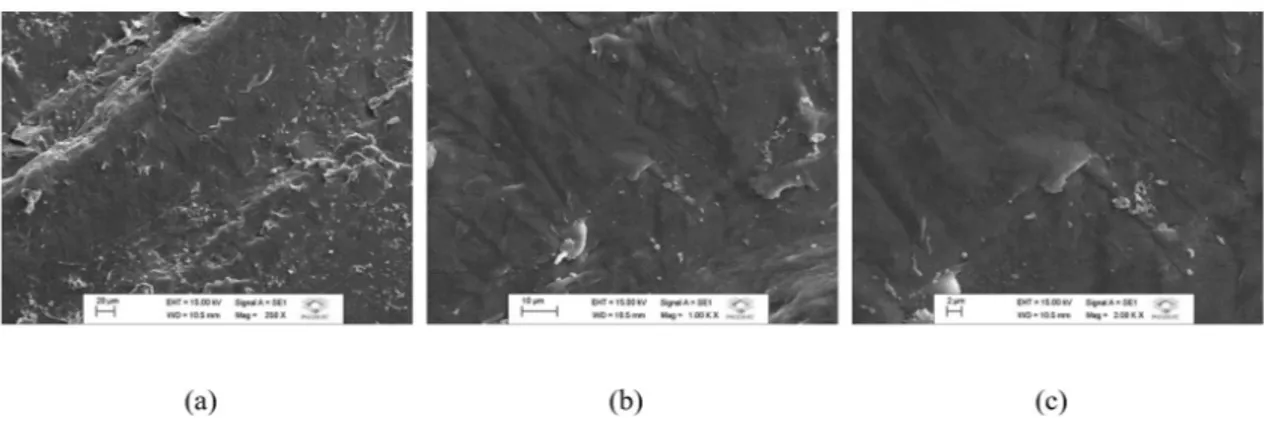
Figure 3 shows the inner region of the extruded PTFE bar in longitudinal section. The marks on the material surface are from the saw used to make the sample. No bubbles or voids were observed in the internal structure of the material. Neither cracks nor microcracks, which may appear due to the state of tension or the presence of voids, were seen. These types of defects may occur during extrusion, by incorrect use of temperature, pressure, or velocity, or the presence of impurities[17,32,33]. As the extrusion process is continuous, the
defects propagate along the entire length of the bar, which did not occur in this case.
Figure 4 shows the characteristic DSC curve for pure PTFE. At 31.6°C, an endothermic peak indicates the phase transition β from hexagonal crystal to pseudo-hexagonal. Because the measurement starts at room temperature it is not possible to visualize the acute peak of β transition at 19°C from triclinic to hexagonal crystal. In addition,
the phase transition γ is not clearly seen and the glass transition of the material is very small and could not be detected, probably due to the heat flow value established for measurement[34]. The wider endothermic peak indicates
the melting of the material, with Tm= 330.6°C. The heat of fusion was 35.5 J g−1 and the crystalline percentage was
estimated according to Equation 2. These values and that of density are given in Table 1.
The density of PTFE in the literature is between 2140.0 and 2200.0 kg m−3[17,35,36], and 2156.3 kg m−3 was the value
calculated for our material. Mechanical properties may undergo significant changes depending on the degree of crystallinity. The reason for this is that it affects the secondary bonds, or Van der Waals bonds, between the intermolecular chains. For regions of higher crystallinity these chains are closer to each other, intensifying the interaction between them by means of these bonds. Thus, for a specific polymer with more amorphous regions, this interaction will be smaller, and in turn there will be changes in the mechanical properties[35].
Furthermore, the modulus rises as both the secondary bond strength and chain alignment increase.
The value obtained in the calibration curve is f = 1.10697 ± 0.00006. Thus, f > 1 means that the value measured at the sensor is smaller than the applied force.
This is due to an intrinsic characteristic of the force sensor purchased from the manufacturer and must be corrected. Most likely the manufacturer calibrated the sensor with a gravity value different from g = 9.79 ± 0.01 m s-2. This value
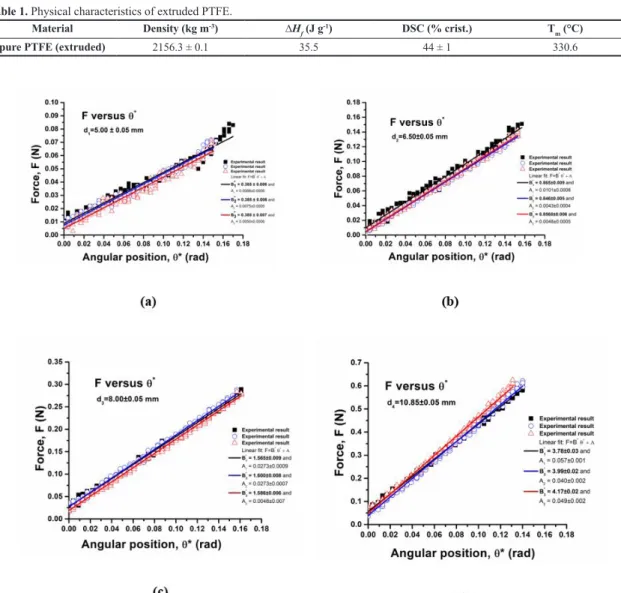
was used in Equation 14 to obtain G. Typical curves, F as a function of θ* for PTFE, are shown in Figure 5a, b, c, and d. The slope B* of the curves of Figure 5 was obtained by fitting a straight line to each of the curves when they showed linear behavior characteristic of an elastic regime. For each PTFE sample with different diameters (d1 = 5.00 mm; d2 = 6.50 mm; d3 = 8.00 mm and d4 = 10.85 mm), we determined the value of B*, measured by the FS and RMS, relative to the one measured of the curve as a function of the angular position. It should be noted that the ratio θ/θ* is 0.222 ± 0.001, so that B is calculated as B*/0.222. The B* value corresponds to the average of the three values found in the linear fit for each set of measurement considering the fixed diameter. Equation 14 was then used to calculate the value of G and Equation 15 to calculate σG. The correlation coefficient r was smaller for d1 = 5.00 mm, and its value is r = 0.969, the mean value of the three coefficients. As the diameter of the samples increased, it approached the value 1 (Figure 5a-d). A smaller correlation coefficient means that the experimental points are more dispersed in respect to the adjusted line, reflecting that the force applied, in this case, is very close to the resolution of the force sensor, which did not happen for the other samples with higher diameters.
Figure 6 shows the final results of G, which is expressed in MPa, for all the studied samples with different diameters. Using this method, the G value of the PTFE is close to the expected value[9,23]. The linear ratio L/d = 10.64 provides
the same torsion modulus value for samples with different diameters, considering the error. Actual properties may change due to processing method, compound type, extruded dimensions, and other variables. For these reasons, there is in the literature a much more extensive range of values for the tensile modulus (E) of PTFE, from 0.4 to 1.6 GPa[9,23,35],
whereas the values of G are more rare to find in the literature. Even if we consider that the relation G = E/2(1+υ), only valid for isotropic solids, is within the elastic region and can be used to evaluate G, we must resort to a Poisson ratio. However, the Poisson ratio at small strains was found to differ in tension[9] (~0.36) and compression[23] (~0.46).
Figure 3. Images of PTFE by scanning electron microscopy (SEM): beam energy = 16.0 keV; vacuum of 10-3 Pa; magnifications of
(a) 250 X, (b) 1000 X, and (c) 2000 X.
Figure 4. Results of exploratory differential calorimetry (DSC) of
Therefore, it was necessary to consider these two values of the Poisson ratio to compare with our values. Using the values of 0.36 and 0.46, the values evaluated for G are within the ranges that follow: 147 MPa < G < 588 MPa and 137 MPa < G < 548 MPa respectively. If we verify the obtained results (Figures 5 or 6) by the method proposed in this article, independent of the distinct values of the Poisson coefficient, they are contained within these calculated intervals. Also, some authors[37-39] report that depending on
the applied strain for PTFE extrudates, the Poisson’s ratio could vary between −14 and 0. Therefore, the advantage of this technique lies in the fact that the Poisson’s ratio is not necessary. Taking advantage of the previous discussion, we verified that using the dynamic method[12], the values
obtained for G are very close to those found with this technique. For samples with the diameters of 5.00, 6.50, and 8.00 mm used in this work, the following values were
Figure 5. Typical curves of force F (N) as a function of the angular position θ* (rad). (a) Sample of PTFE: L = (53.20 ± 0.05) mm;
d1 = (5.00 ± 0.05) mm; B* = 0.387 ± 0.006 N/rad; r= 0.969; G is calculated by Equation 14, G = (351 ± 15) MPa. (b) Sample of PTFE: L = (69.20 ± 0.05) mm; d2 = (6.50 ± 0.05) mm; B*= 0.856 ± 0.007 N/rad; r= 0.992; G = (354 ± 11) MPa. (c) Sample of
PTFE: L = (85.15 ± 0.05) mm; d3 = (8.00 ± 0.05) mm; B*= 1.584 ± 0.008 N/rad; r= 0.997; G = (351 ± 9) MPa. (d) Sample of PTFE:
L = (115.50 ± 0.05) mm; d4 = (10.85 ± 0.05) mm; B*= 3.98 ± 0.02 N/rad; r= 0.997; G = (354 ± 7) MPa.
Figure 6. Values of G obtained for the samples of PTFE for
different diameters.
Table 1. Physical characteristics of extruded PTFE.
Material Density (kg m-3) ∆Hf (J g-1) DSC (% crist.) T
m (°C)
obtained: G = (352 ± 14) MPa, G = (354 ± 11) MPa, and G = (351 ± 9) MPa respectively. These values were obtained respecting the ratio L/d = 10.64. As it was not possible to perform the measurement with d4 = 10.85 mm, the dynamic method was limited to these three sample diameters. However, with the method applied in this article, it was possible to carry out the measurement of G for d4 = 10.85 mm. Further details of the dynamic method applied to polymers will be provided in the near future.
4. Conclusions
The system described herein is an alternative method to obtain G in polymers. It was applied to PTFE samples with different diameters with a fixed linear L/d ratio. The linear aspect ratio provided an approximate value of 350 MPa of G for all the PTFE samples and showed smaller deviations at higher diameters. Based on our results, the studied polymer showed values of G congruent with those of the literature, validating the use of the technique. In a competitive market, it is always interesting to know alternative methods to produce or find the parameters necessary for the development of products. Having been validated, the technique can now be applied to other types of materials, particularly those recently discovered, for which the Poisson’s ratio is not yet known.
5. Acknowledgements
The authors thank Fundação de Amparo à Pesquisa do Estado de São Paulo - FAPESP, proc. 2007/04094-9, proc. 2017/08820-8, and proc. 2018/12463-9, Coordenação de Aperfeiçoamento de Pessoal de Nível Superior - CAPES proc. 024/2012 and 011/2009 Pro-equipment. Also, we would like to thank the group “Laboratório de Análise Térmica e Polímeros, UNESP-Bauru”.
6. References
1. Jordan, J. L., Siviour, C. R., Foley, J. R., & Brown, E. N. (2007). Compressive properties of extruded polytetrafluoroethylene. Polymer, 48(14), 4184-4195. http://dx.doi.org/10.1016/j. polymer.2007.05.038.
2. Brown, E. N., Rae, P. J., Bruce Orler, E., Gray, G. T. 3rd, & Dattelbaum, D. M. (2006). The effect of crystallinity on the fracture of polytetrafluoroethylene (PTFE). Materials Science and Engineering C, 26(8), 1338-1343. http://dx.doi. org/10.1016/j.msec.2005.08.009.
3. Messner, K., & Gillquist, J. (1993). Synthetic implants for the repair of osteochondral defects of the medial femoral condyle: A biomechanical and histological evaluation in the rabbit knee. Biomaterials, 14(7), 513-521. http://dx.doi.org/10.1016/0142-9612(93)90240-3. PMid:8329524.
4. Mercuri, L. G., & Giobbie-Hurder, A. (2004). Long-term outcomes after total alloplastic temporomandibular joint reconstruction following exposure to failed materials. Journal of Oral and Maxillofacial Surgery, 62(9), 1088-1096. http:// dx.doi.org/10.1016/j.joms.2003.10.012. PMid:15346359. 5. Renfrew, M. M., & Lewis, E. E. (1946). Polytetrafluoroethylene:
heat resistant, chemically inert plastic. Industrial & Engineering Chemistry, 38(9), 870-877. http://dx.doi.org/10.1021/ie50441a009. 6. Thomas, P. E., Londz, J. F., Sperati, C. A., & McPherson, J.
L. (1956). Effects of fabrication on the properties of Teflon resins. Society of PlasticEngineers Journal, 12, 89-95.
7. Brown, N., & Parrish, M. (1972). Effect of liquid nitrogen on the tensile strength of polyethylene and polytetrafluoroethylene. Journal of Polymer Science. Polymer Letters Edition, 10(10), 777-779. http://dx.doi.org/10.1002/pol.1972.130101004. 8. Kletschkowski, T., Schomburg, U., & Bertram, A. (2002).
Endochronic viscoplastic material models for filled PTFE. Mechanics of Materials, 34(12), 795-808. http://dx.doi. org/10.1016/S0167-6636(02)00197-7.
9. Rae, P. J., & Brown, E. N. (2005). The properties of poly(tetrafluoroethylene) (PTFE) in tension. Polymer, 46(19), 8128-8140. http://dx.doi.org/10.1016/j.polymer.2005.06.120. 10. International Organization for Standardization. (2011). ISO 6721/1: plastics – determination of dynamic mechanical properties – part 1: general principles. Geneva: ISO. 11. Andreozzi, L., Briccoli Bati, S., Fagone, M., Ranocchiai, G.,
& Zulli, F. (2014). Dynamic torsion tests to characterize the thermo-viscoelastic properties of polymeric interlayers for laminated glass. Construction & Building Materials, 65, 1-13. http://dx.doi.org/10.1016/j.conbuildmat.2014.04.003. 12. Pintão, C. A. F., Correa, D. R. N., & Grandini, C. R. (2017).
Torsion modulus using the technique of mechanical spectroscopy in biomaterials. Journal of Mechanical Science and Technology, 31(5), 2203-2211. http://dx.doi.org/10.1007/s12206-017-0416-6. 13. Nowick, A. S., & Berry, B. S., editors (1972). Anelastic relaxation in crystalline solids. New York: Academic Press. http://dx.doi.org/10.1016/B978-0-12-522650-9.X5001-0. 14. International Organization for Standardization. (1985). ISO
458/1: plastics – determination of stiffness in torsion of flexible materials – part 1: general method. Geneva: ISO.
15. International Organization for Standardization. (2015). ISO 18338: metallic materials –torsion test at ambient temperature. Geneva: ISO.
16. Nadai, A. (1950). Theory of flow and fracture of solids. New York: McGraw-Hill.
17. Ebnesajjad, S. (2000). Fluoroplastics (Vol. 1). New York: Elsevier.
18. Brown, E. N., & Dattelbaum, D. M. (2005). The role of crystalline phase on fracture and microstructure evolution of polytetrafluoroethylene (PTFE). Polymer, 46(9), 3056-3068. http://dx.doi.org/10.1016/j.polymer.2005.01.061.
19. Starkweather, H. W. (1979). A comparison of the rheological properties of polytetrafluoroethylene below its melting point with certain low-molecular smectic states. Journal of Polymer Science. Part B, Polymer Physics, 17(1), 73-79. http://dx.doi. org/10.1002/pol.1979.180170106.
20. Ansari, M., Vavlekas, D., McCoy, J. L., & Hatzikiriakos, S. G. (2015). Paste extrusion and mechanical properties of PTFE. International Polymer Processing, 30(5), 603-614. http:// dx.doi.org/10.3139/217.3130.
21. Ochoa, I., & Hatzikiriakos, S. G. (2005). Paste extrusion of polytetrafluoroethylene (PTFE): surface tension and viscosity effects. Powder Technology, 153(2), 108-118. http://dx.doi. org/10.1016/j.powtec.2005.02.007.
22. Ariawan, A. B., Ebnesajjad, S., & Hatzikiriakos, S. G. (2002). Properties of polytetrafluoroethylene (PTFE) paste extrudates. Polymer Engineering and Science, 42(6), 1247-1259. http:// dx.doi.org/10.1002/pen.11028.
23. Rae, P. J., & Dattelbaum, D. M. (2004). The properties of poly(tetrafluoroethylene) (PTFE) in compression. Polymer, 45(22), 7615-7625. http://dx.doi.org/10.1016/j.polymer.2004.08.064. 24. Wilson, C. W., & Pake, G. E. (1953). Nuclear magnetic resonance determination of crystallinity in two polymers. Journal of Polymer Science. Polymer Physics Edition, 10(5), 503-505. http://dx.doi.org/10.1046/j.1365-2125.1999.00045.x.
25. Moynihan, R. E. (1959). The molecular structure of perfluorocarbon polymers: infrared studies on polytetrafluoroethylene. Journal of the American Chemical, 81(5), 1045-1050. http://dx.doi. org/10.1021/ja01514a009.
26. McCrum, N. G. (1959). Torsion pendulum method for determining crystallinity and void content of tetrafluoroethylene resins. ASTM Bull, 242, 80-82.
27. Lehnert, R. J., Hendra, P. J., Everall, N., & Clayden, N. J. (1997). Comparative quantitative study on the crystallinity of poly(tetrafluoroethylene) including Raman, infra-red and19F nuclear magnetic resonance spectroscopy. Polymer, 38(7), 1521-1535. http://dx.doi.org/10.1016/S0032-3861(96)00684-2. 28. César, J., Paoli, M.-A., & Andrade, J. C. (2004). A determinação
da densidade de sólidos e líquidos. Campinas: Chemkeys. Retrieved in 2019, January 23, from: http://chemkeys.com/ br/2004/07/17/a-determinacao-da-densidade-de-solidos-e-liquidos/
29. Tauchert, T. R. (1974). Energy principles in structural mechanics. New York: McGraw-Hill.
30. Kausch, H. H. (1978). Polymer fracture. New York: Springer-Verlag Berlin Heidelberg. http://dx.doi.org/10.1007/978-3-642-96460-2.
31. Timoshenko, S. P., & Goodier, J. N. (1980). Theory of elasticity (3rd ed.). Rio de Janeiro: Guanabara Dois.
32. Agassant, J. F., Arda, D. R., Combeaud, C., Merten, A., Münstedt, H., Mackley, M. R., Robert, L., & Vergnes, B. (2006). Polymer processing extrusion instabilities and methods for their elimination or minimisation. International Polymer Processing, 21(3), 239-255. http://dx.doi.org/10.3139/217.0084.
33. Patil, P. M., & Sadaphale, P. D. B. (2018). A study of plastic extrusion process and its defects. International Journal of Latest Technology in Engineering, Management & Applied Sciences (Basel, Switzerland), 7(9), 13-20.
34. Ionashiro, M. (2004). Princípios básicos da termogravimetria e análise térmica diferencial/calorimetria exploratória diferencial. São Paulo: GIZ Editorial.
35. Callister, W. D. J., & Rethwisch, D. G. (2007). Materials science and engineering: an introduction. USA: John Wiley & Sons, Inc.
36. DuPont. (1996). Teflon PTFE fluoropolymer resin: properties handbook. USA: DuPont Fluoroproducts.
37. Caddock, B. D., & Evans, K. E. (1989). Microporous materials with negative Poisson’s ratios. I. Microstructure and mechanical properties. Journal of Physics. D, Applied Physics, 22(12), 1877-1882. http://dx.doi.org/10.1088/0022-3727/22/12/012. 38. Vavlekas, D., Ansari, M., Hao, H., Fremy, F., McCoy, J. L.,
& Hatzikiriakos, S. G. (2016). Zero Poisson’s ratio PTFE in uniaxial extension. Polymer Testing, 55, 143-151. http://dx.doi. org/10.1016/j.polymertesting.2016.08.014.
39. Vavlekas, D., Melo, L., Ansari, M., Grant, E., Fremy, F., McCoy, J. L., & Hatzikiriakos, S. G. (2017). Role of PTFE paste fibrillation on Poisson’s ratio. Polymer Testing, 61, 65-73. http://dx.doi.org/10.1016/j.polymertesting.2017.05.004.
Received: Jan. 23, 2019 Revised: Apr. 15, 2019 Accepted: Apr. 15, 2019