ISSN: 1809-4430 (on-line) www.engenhariaagricola.org.br
1 Federal University of Santa Catarina/ Florianópolis - SC, Brazil. 3 Federal University of Mato Grosso do Sul/Campo Grande - MS, Brazil.
Received in: 8-9-2017 Accepted in: 6-12-2018
Doi:http://dx.doi.org/10.1590/1809-4430-Eng.Agric.v38n4p491-497/2018
DEVELOPMENT OF AN EQUIPMENT TO OBTAIN THE RELATION BETWEEN THE
HORIZONTAL AND VERTICAL PRESSURE IN SILOS
Raul C
.
Ledo
1, Andrés B
.
Cheung
2*, Josivaldo G
.
da Silva
32*Corresponding author. Federal University of Mato Grosso do Sul/Campo Grande - MS, Brasil. E-mail: [email protected]
KEYWORDS
K coefficient,
granular materials,
silos.
ABSTRACT
Silos are essential for sectors such as agriculture, industry, and mining in Brazil, but they
are structures with a high degree of complexity in relation to pressure determination.
Therefore, new researches on the influence of the product stored in their structure are
stimulated. For granular materials, the K coefficient is the factor obtained between the
horizontal and the vertical pressure. This study aimed to develop a test device capable of
calculating this coefficient based on the recommendations of EN 1991-4 (2006)
(Eurocode 1: Actions on structures
–
Part 4: Silos and tanks). For that, two cylinders of
different heights were elaborated to study the influence of the device height in obtaining
K coefficient. The results were measured by strain gauges and load cell connected to a
data acquisition system. A vertical pressure was applied to the equipment, which
responded with values of deformation correlated to the horizontal pressure. The values of
K coefficient for corn were found and compared with those from the literature, concluding
that the equipment could be used for the proposed purpose.
INTRODUCTION
According to Wójcik et al. (2017), silos are engineering structures widely used in industries and farms to store bulk solids essential for agriculture, mining, and other industries. They are structures with a high degree of complexity in relation to the determination of pressures and flows due to the high variability of the properties of stored products. These structures present one of the highest indices of collapses, which stimulates new investigations on the pressures that the stored product exerts on the structure (Nascimento & Calil Junior, 2009).
The relation between the horizontal (ph) and vertical pressure (pv) of a granular mass is defined as the K factor (Equation 1). This is one of the parameters necessary for calculating the pressures exerted by a material on the walls and bottom of a silo (Blight, 1988).
K =ph
pv (1)
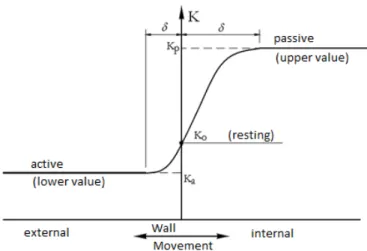
Granular materials are called semi-fluids. They do not behave like fluids nor as solids and exhibit some properties of the solid, transmitting vertical pressure, and some properties as fluid, transmitting horizontal pressure (Haque, 2013). The K coefficient should be determined at a given particle packing density and stress level corresponding to the position of the material stored in the silo where the maximum vertical stress occurs after filling (Couto et al., 2012).
FIGURE 1. Behavior of the K coefficient in relation to the relative movements of the wall.
Calil Junior & Cheung (2007) shows that in several studies and standards, different recommendations are suggested for calculating the relation of the K coefficient. In most of these recommendations, K parameter is determined as a function of the effective friction angle and the friction angle with the wall. In most of the many different existing recommendations, a lot of uncertainty to calculate the pressure ratio exists.
According to Kaminski & Wirska (1998), in addition to the internal friction angle and the friction angle with the wall, experiments have shown that values of pressures and
K parameter related to them depend on almost forty factors such as physicochemical properties of granular product, shape and dimensions of the silo, product flow type during silo discharge, etc. Knowledge and measurement of these actions are somewhat complex due to the great interaction between the variables involved (Nascimento et al., 2013). Table 1 shows the main formulations for the value of the K coefficient proposed by several researchers according to Cheung (2007).
According to Nascimento & Calil Junior (2009), the value of the K coefficient for corn varies from 0.34 to 0.60 for an average ∅e value of 29.78°. The friction angle of a
granular material depends on porosity and loading behavior, as well as on particle properties (Suhr & Six, 2016). Costa et al. (2014) determined the mechanical and flow properties of granular products, such as grains of rice and ground corn with moisture contents of 10, 12, and 14% and cassava flour, which is considered as powdery, with moisture contents of 10 and 12%, by means of a split rigid cell. The dilatancy angle, modulus of elasticity, and Poisson coefficient were obtained with this cell.
The problem with the formulations of the K coefficient is that they were obtained only from the hypotheses that the material is in the slip state and the friction with the wall is completely mobilized. These hypotheses are not necessarily fulfilled in the vertical wall of the silo. The literature needs more information since new industrial procedures are performed on each new product (Lopes Neto & Nascimento, 2013).
TABLE 1. Formulations for the K coefficient.
Therefore, this study aimed to develop a device capable of finding the value of the K coefficient of granular materials by means of the recommendations in the standard EN 1991-4 (2006).
MATERIAL AND METHODS
Recommendations of the European standard
The device was developed based on the recommendations of EN 1991-4 (2006). The item C.8 of this standard instructs that a vertical pressure should be
applied to a restricted sample against the horizontal deformation. This means that the horizontal deformations in the solid are kept so small that their effect on the pressure on the wall of the device is minimal. However, these deformations are large enough to produce measurable observations on the thin wall of the device. An average circumferential deformation of the order of 100 µε generally satisfies these criteria of limited deformation in the solid, with measurable values in the device. The induced horizontal pressure must be measured and the secant value of the lateral pressure ratio K0 determined.
Author Suggested expression Comments
Rankine-Koenen Initially proposed by Rankine for soils, it was suggested by Koenen for use in the Janssen
formulation. It is valid for friction angles with the wall equal to zero.
Jaky
Obtained from the relation for the K parameter in case of product at rest (elastic state) and smooth and rigid wall.
Walker
Assuming that the ensiled product is under rupture and simultaneously sliding along a rough
wall, it used the geometry of the Mohr’s circle to include the coefficient of friction with the
wall.
Hartmann Formulation based on the elasticity theory for rough-walled silos.
Frazer This expression is derived by considering the balance of forces in the contour (on the wall
surface) for the state of incipient rupture.
Aoki
This expression is derived from the Walters (1973a) hypothesis; the authors uses this expression in the formulation of Janssen (1985); pressure values are equal to those obtained
by Walters (1973a).
The horizontal pressure in the sample resulting from the application of a vertical pressure must be observed. The value of K0 (Equation 2) must be calculated from these stresses:
K0=pphv (2)
The K value should be taken as:
K = 1,1. K0 (3)
The factor 1.1 in [eq. (3)] is used to give an approximate representation of the difference between the lateral pressure ratio (K0) measured under almost zero wall friction conditions and the K value measured when the wall friction is present.
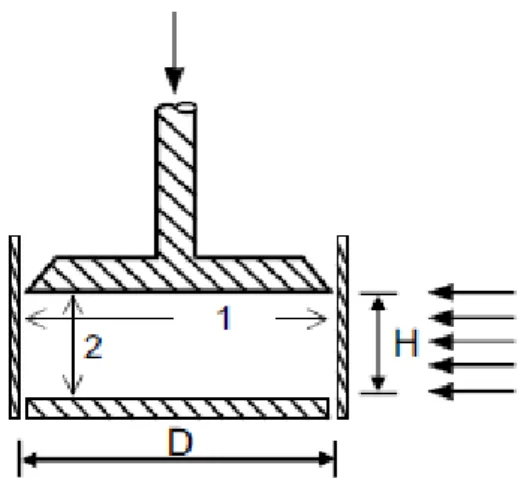
The geometry of the test device recommended by the European standard EN 1991-4 (2006) is shown in Figure 2. The horizontal pressure must be deduced from the measured stresses on the external surface of the vertical section, but the wall must be thin and the device must ensure that the state of stress on the wall is correctly interpreted.
FIGURE 2. Test method of EN 1991-4 (2006) for K determination.
According to the standard EN 1991-4 (2006), some care must be taken for correct interpretation of results:
• The lower plate must be separated from the cylinder.
• Locate the stress measuring devices away from the ends of the sample.
Geometry of equipment
Two cylindrical walls with different heights (C1-290 mm and C2-145 mm) were designed to study the influence of height in obtaining the K coefficient. The material chosen was aluminum due to its low modulus of elasticity (around of 69 GPa), thus avoiding very high loads to reach the average deformation of 100 µε in the wall, as recommended by the European standard EN 1991-4 (2006).
In order to receive the vertical loading, two 20-mm thick SAE 1020 steel bases were prepared, being used to fix two solid and cylindrical steel parts attached to the base through a stud bolt. An estimation of the rigidity condition of the base is given by [eq. (4)], as in Grekow et al. (1971).
S = 31−𝜈1−𝜈2 0 2𝐸𝐸0(𝑎ℎ)
3
(4)
Where,
S is the degree of rigidity of the plate;
v is the Poisson coefficient of the plate (adopted 0.3);
v0 is the Poisson coefficient of the product;
E is the modulus of elasticity of the plate (adopted 210 GPa);
E0 is the modulus of elasticity of the product;
a is the plate radius (see Figure 3), and
h is the plate thickness (see Figure 3).
As a function of the degree of rigidity S, plates can be considered as rigid (S≤0.5), finite rigidity (0.5<S≤10), and flexible (S>10). For estimating the modulus of elasticity
(E0) of the product, the values found by Moya et al. (2013)
of 35733 kPa and a Poisson coefficient (ν) of 0.31 were used. In addition, the result found for the degree of rigidity (S=0.01805<0.5) indicates that the plate is rigid and its displacements are insignificant in relation to the test product.
FIGURE 3. Section of the equipment and components.
Pressure reading
For the calculation of the approximate load that produces ph in order to obtain an average deformation of
100 µε on the equipment wall, as recommended by EN 1991-4 (2006), the concepts of thin-walled pressure vessels and the Hooke’s law were used. Substituting the equation of thin-walled pressure vessels into the Hooke’s law equation gives:
ϵ =(ph.rt )
E (5)
Where,
ph is the horizontal pressure;
r is the cylinder internal radius;
t is the wall thickness;
E is the modulus of elasticity, and
𝜖 is the deformation.
The value of pv in [eq. (2)] was measured using a load cell at the top of the equipment. The value of deformation of the cylinder walls was obtained as recommended by EN 1991-4 (2006), through four Kyowa
strain gauges of 350 Ω glued with precision cyanoacrylate
in the wall of each cylinder at half height, forming a complete bridge of Wheatstone.
The data acquisition system used was an HBM QuantumX MX840A device and the program Catman Easy for reading and analyzing the information.
Calibration of sensors
For determining the real modulus of elasticity of aluminum, a compression test was performed by uniformly
compressing the whole cylinder, perpendicular to its axis, at loads of 4, 6, 8, and 10 kN. In addition, three tests were performed for each load.
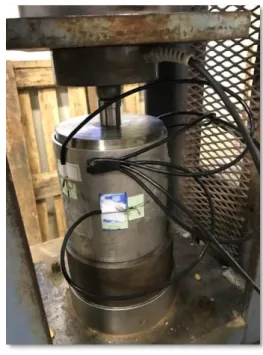
Test arrangement
Loading and unloading cycles were performed previously to the tests to eliminate strain gauge hysteresis. Each of both cylinders (C1 and C2) was tested twice (Figure 4). The first test of each cylinder was performed with the
unconsolidated corn sample (without previous
compression) and the second test was performed with the sample already consolidated by the previous test.
RESULTS AND DISCUSSION
Substituting the values of 100 µε in the deformation, the dimensional values of cylinders, and the modulus of elasticity of aluminum as 69 GPa in [eq. (4)], the vertical pressure value necessary to reach the recommended
deformation was obtained, i.e. ph = 0.3819 MPa. Using the most unfavorable value of 0.34 for the K coefficient, the maximum vertical pressure that should be applied in order
to obtain deformations of 100 µε in the wall of the
equipment is 1120 kN/m2 or, according to the base area of cylinders, a load of 15.56 kN.
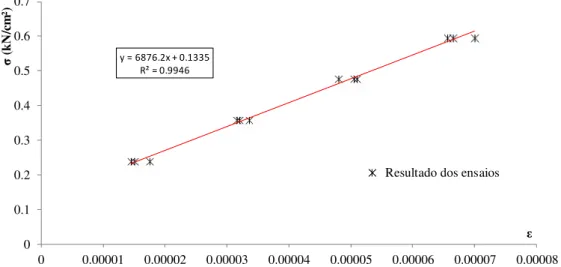
FIGURE 5. Linear regression for obtaining the real modulus of elasticity.
From the cylinder compression test and by performing a linear regression with the data of stress and deformation, the value of the real modulus of elasticity of the cylinder material (E) was calculated, reaching a value of E = 68.76 GPa (Figure 5).
The standard EN 1991-4 (2006) guides that the values of horizontal pressure must originate in deformations that are close to 100 µε. In this study, we emphasize, through the results of K, that this statement must be followed faithfully since the K values found, originated in average deformations of 100 µε (highlighted in Tables 4, 5, and 6), are in accordance with those found in the literature, such as in Cheung (2007) (Table 2) and of the Appendix E of EN 1991-4 (2006) (Table 3).
TABLE 2. Typical K values found for corn.
Valores de K
Koenen Jaky Hartman Walker Frazer Aoki
0.336 0.448 0.604 0.473 0.461 0.747
TABLE 3. K values indicated by EN 1991-4 (2006).
K values for corn
Mean Multiplying factor
0.53 1.14
The values found for pv, ph, and deformation in each of the tests and cylinders are shown in Tables 4 and 5. These values are the basis for obtaining the coefficients K0 and K of Table 6.
TABLE 4. Results of pv, ph, and deformation of cylinder 1 (C1) tests.
E1 (Unconsolidated) E2 (Consolidated)
Load (kN) pv (kN/m²) ε (με) pv (kN/m²) ε (με) ph (kN/m²)
4 287.9 18.5 287.9 42.2 220.1
6 431.9 33.0 431.9 57.0 297.5
8 575.8 50.0 575.8 70.3 367.1
10 719.8 64.5 719.8 85.8 448.0
12 863.8 82.5 863.8 106.5 555.9
14 1007.7 102.5 1007.7 129.5 676.0
16 1151.7 131.0 1151.7 150.7 786.5
18 1295.6 156.0 1295.6 171.5 895.2
20 1439.6 181.0 1439.6 191.8 1001.3
y = 6876.2x + 0.1335 R² = 0.9946
0 0.1 0.2 0.3 0.4 0.5 0.6 0.7
0 0.00001 0.00002 0.00003 0.00004 0.00005 0.00006 0.00007 0.00008
σ
(k
N
/c
m
²)
TABLE 5. Results of pv, ph, and deformation of cylinder 2 (C2) tests.
E1 (Unconsolidated) E2 (Consolidated)
Load (kN) pv (kN/m²) ε (με) pv (kN/m²) ε (με) ph (kN/m²)
4 287.9 31.5 287.9 30.8 140.0
6 431.9 48.0 431.9 55.2 250.5
8 575.8 69.0 575.8 74.0 336.1
10 719.8 85.0 719.8 89.3 405.7
12 863.8 100.0 863.8 104.3 473.8
14 1007.7 117.0 1007.7 119.3 541.9
16 1151.7 133.5 1151.7 137.0 622.2
18 1295.6 147.0 1295.6 155.2 704.7
20 1439.6 161.5 1439.6 172.8 784.9
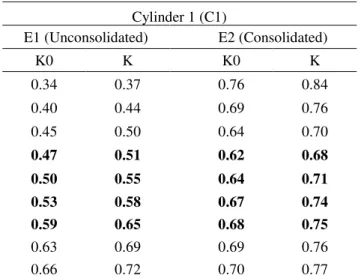
TABLE 6. Results of K0 and K of tests of cylinders 1 (C1) and 2 (C2).
Cylinder 1 (C1) Cylinder 2 (C2)
E1 (Unconsolidated) E2 (Consolidated) E1 (Unconsolidated) E2 (Consolidated)
K0 K K0 K K0 K K0 K
0.34 0.37 0.76 0.84 0.50 0.55 0.49 0.53
0.40 0.44 0.69 0.76 0.50 0.56 0.58 0.64
0.45 0.50 0.64 0.70 0.54 0.60 0.58 0.64
0.47 0.51 0.62 0.68 0.54 0.59 0.56 0.62
0.50 0.55 0.64 0.71 0.53 0.58 0.55 0.60
0.53 0.58 0.67 0.74 0.53 0.58 0.54 0.59
0.59 0.65 0.68 0.75 0.53 0.58 0.54 0.59
0.63 0.69 0.69 0.76 0.52 0.57 0.54 0.60
0.66 0.72 0.70 0.77 0.51 0.56 0.55 0.60
Therefore, using only the values contained in the gray strip (deformations close to 100 µε) of Table 6, which partially represents the values of the
K coefficient presented by EN 1991-4 (2006), we found the mean and standard deviation for the data from each of both cylinder tests (Table 7).
TABLE 7. Analysis of K results for cylinders 1 and 2.
K E1
(Unconsolidated)
E2 (Consolidated)
Cylinder 1 (C1) 0,58 ± 0,06 0,72 ± 0,03
Cylinder 2 (C2) 0,59± 0,01 0,61 ± 0,02
Two types of samples were used in the tests, i.e. unconsolidated and already consolidated samples by previous tests. The divergence between both methods is shown in Table 8, in which the results of the K coefficient produced by unconsolidated samples coincide with the range of values of Cheung (2007) (Table 2), in which K values for corn vary from 0.336 to 0.747, and with Table E.1 of the Appendix E of EN 1991-4 (2006), in which the K coefficient for corn should vary from 0.46 to 0.60. On the other hand, the tests carried out with previously consolidated samples resulted in values higher than those found in the literature.
In addition, the higher the cylinder height is, the greater the influence of the non-uniformity of stresses on the cylindrical wall. In fact, in Table 8, the results for the highest cylinder (C1) show values of the K coefficient (Table 2) out of the range of values of Cheung (2007) (Table 2) and Table E.1 of the European standard, while in the results for the lowest cylinder, K values coincide. In the calculation process, we considered that the pressure read in the center of the cylinder is uniform for all height (the strain gauges were positioned at the center), but it is not a reasonable hypothesis, although it is recommended by EN 1991-4 (2006).
CONCLUSIONS
1. The results found for the K coefficient by using the developed equipment according to the expected range recommended by the European standard EN 1991-4 (2006) were close to the values found in the literature.
3. A high variability was observed in the results of the
value (K) generated mainly by initial
accommodation of the sample and state of consolidation.
REFERENCES
Blight GE (1988) A comparison of measured pressures in silos with code recommendations. Bulk Solids Handling 8(2):145-153.
EN 1991-4 (2006) Eurocode 1. Basis of design and actions on structures e Part 4: Actions in silos and tanks. Rue de Stassart 36, B-1050 Brussels: European Committee for Standardization. Central Secretariat.
Calil Junior C, Cheung AB (2007) Silos: pressões, fluxo, recomendações para o projeto e exemplos de cálculo.São Carlos, Escola de Engenharia de São Carlos, USP, 240 p.
Cheung AB (2007) Modelo estocástico de pressões de produtos armazenados para a estimativa da confiabilidade estrutural de silos esbeltos. Tese Doutorado, São Carlos, Universidade de São Paulo, 302 p.
Couto A, Ruiz A, Aguado PJ (2012) Design and instrumentation of a mid-size test station for measuring static and dynamic pressures in silos under different conditions – Part I: Description. Computers and Electronics In Agriculture 85(1):164-173.
Costa CA, Neto JP, Nascimento JWB, Diniz MJ, Silva VR (2014) Propriedades mecânicas e de fluxo de produtos agroindustriais. Revista Brasileira de Engenharia Agrícola e Ambiental 18(7):774-780.
Grekow A, Isnard V, Mrozowicz P (1971) Formulário Del ingeniero: métodos practicos de calculo de obras de ingenieria.Bilbao, Ediciones Urno, 708 p.
Haque E (2013) Estimating bulk density of compacted
grains in storage bins and modifications of Janssen’s load
equations as affected by bulk density. Food Science & Nutrition 1(2):150-156.
Kaminski M, Wirska E (1998) Variation of pressures in flexible walled silo model. Powder Handling & Processing 10(4):349-355.
Lopes Neto JP, Nascimento JWB do (2013) Características de fluxo e projeto de tremonhas cônicas em silos
verticais. Revista Brasileira de Engenharia Agrícola e Ambiental 17(3):339-345.
Nascimento FC, Calil Junior C (2009) A relação entre as pressões horizontais e verticais em silos elevados: o parâmetro K. Dissertação Mestrado, São Carlos, Universidade de São Paulo, 37 p.
Moya M, Aguado PJ, Ayuga F (2013) Mechanical properties of some granular agricultural materials used in silo design. International Agrophysics 27(4):181-193.
Nascimento JWB do, Lopes Neto JP, Montross MD (2013) Horizontal pressures in cylindrical metal silos and
comparison with different international
standards. Engenharia Agrícola 33(4):601-611.
Rankine WJM (1857) On the Stability of Loose Earth. Philosophical Transactions: The Royal Society of London 147:9-27.
Suhr B, Six K (2016) On the effect of stress dependent interparticle friction in direct shear tests. Powder Technology 294(1):211-220.