MONITORING NITROGEN NUTRITION IN COTTON
(1)Ciro Antonio Rosolem(2) & Vanessa van Mellis(3)
SUMMARY
Both N excess and deficiency may affect cotton yield and quality. It would therefore be useful to base the N management fertilization on the monitoring of the nutritional status. This study investigated the correlations among the following determination methods of the N nutritional status of cotton (Gossypium hirsutum
L., var. Latifolia): chlorophyll readings (SPAD-502®, Minolta), specific-ion nitrate meter (Nitrate Meter C-141, Horiba-Cardy®), and laboratory analysis (conventional foliar diagnosis). Samples were taken weekly from two weeks before flowering to the fifth week after the first flower. The experiment was conducted on the Fazenda Santa Tereza, Itapeva, State of São Paulo, Brazil. The crop was fertilized with 40 kg ha-1 N at planting and 0, 30, 60, 90, and 120 kg ha-1 of side-dressed N. The
range of leaf N contents reported as adequate for samples taken 80–90 days after plant emergence (traditional foliar diagnosis) may be used as reference from the beginning of flowering when the plant is not stressed. Specific-ion nitrate meter readings can be used as a nutritional indicator of cotton nutrition from one week after pinhead until the third week of flowering. In this case, plants are well-nourished when readings exceed 8,000 mg L-1 NO
3-. The chlorophyll meter can
also be used to estimate the nutritional status of cotton from the third week of flowering. In this case the readings should be above 48 in well-nourished plants.
Index terms: fertilizer, Gossypium hirsutum, foliar diagnosis, nutritional status.
RESUMO: MONITORAMENTO DA NUTRIÇÃO NITROGENADA DO
ALGODOEIRO
Tanto o excesso como a deficiência de N podem levar a decréscimos na produção e qualidade do algodão. Assim, o monitoramento do estado nutricional da planta pode ajudar no manejo da adubação nitrogenada. Um experimento foi realizado para estudar as correlações entre
métodos de determinação do estado nutricional do algodoeiro (Gossypium hirsutum L., var.
(1) Received for publication in February 2009 and approved in July 2010.
(2) Full professor at the Departamento de Produção Vegetal, Univerisdade Estadual Paulista – USP. Caixa Postal 237, CEP
18603-970 Botucatu (SP). Bolsista do CNPq. E-mail: [email protected]
(3) Acadêmica de Agronomia. Faculdade de Ciências Agronömicas, USP. E-mail: [email protected]
Latifolia). Os métodos usados foram um medidor de clorofila (SPAD-502®, Minolta), um medidor específico de ions para nitrato (Nitrate Meter C-141, Horiba-Cardy®) e análise de nitrogênio do tecido, em laboratório (Diagnose foliar convencional). Foram coletadas amostras desde duas semanas antes do florescimento até a quinta semana depois da primeira flor. O experimento foi conduzido na Fazenda Santa Tereza, Itapeva, São Paulo, Brasil. A cultura
recebeu 40 kg ha-1 de N na semeadura e mais 0, 30, 60, 90 e 120 kg ha-1 de N em cobertura. A
faixa de teores de N tida como adequada na diagnose foliar tradicional (com amostragem feita aos 80–90 dias após a emergência da cultura) pode ser usada como referência desde o começo do florescimento, desde que a planta não se encontre sob stress. As leituras de nitrato com o medidor específico de íons podem ser utilizadas como um indicador do estado nutricional do algodoeiro desde uma semana depois do aparecimento do botão floral até a terceira semana de florescimento. Assim, as plantas estarão bem nutridas quando as leituras forem maiores
que 8.000 mg L-1 de NO
3-. O medidor de clorofila pode também ser usado na estimativa do
estado nutricional do algodoeiro a partir da terceira semana de florescimento. Nesse caso, as leituras iguais ou acima de 50 indicam plantas bem nutridas.
Termos de indexação: adubação, Gossypium hirsutum, diagnose foliar, estado nutricional.
INTRODUCTION
Appropriate N rates increase productivity and improve fiber length and strength and are essential for cotton growth and flowering, but N excess may induce rank-growth, extend the plant cycle and decrease lint yield and fiber quality (Staut & Kurihara, 2001). The intensity of N uptake is low in the first 35–40 days, until the appearance of the first flower buds (Rosolem, 2001). Thereafter, N uptake increases to around 5.5 kg ha-1 day-1 75–80 days after plant
emergence (DAE), and then N uptake declines with plant age. However, Rosolem & Mikkelsen (1989) concluded that while a significant number of bolls are developing, there may be potential for response to N, but the nutrient taken up after 90 DAE accumulates mainly in the leaves of the median and upper plant parts. In well-nourished plants, less than 30 % of N absorbed at this time will be found in the fruits.
Nitrogen is the nutrient most required by cotton, but the empirically recommended N fertilization in Brazil has not been based on plant response to N or soil tests. Since both N excess and deficiency can lead to losses in cotton yield and quality, regular and accurate determinations of the nutritional status underlying the N management fertilization would be useful, as commonly used in cotton-growing areas around the world. Foliar diagnosis is important in monitoring the nutritional status of plants, but the analysis is time-consuming.
The concentration of NO3- in cotton petioles decreases from the first week before flowering until the third week after the beginning of flowering (Mozaffari et al., 2004), but during the flowering period it is correlated with cotton yield (Maples et al., 1977). By regular petiole samplings during this period it is possible to detect and correct N deficiencies (Oosterhuis et al., 2002). One problem is that the
amount of water available and the position of the node on the main stem affect the amount of N detected in the petiole from the third week after the appearance of the first floral bud until the fourth week after the first flower opens. Measurements of petiole NO3- one
week before or after early flowering is a sensitive indicator of applied N rate and may be a good predictor of plant growth and lint yield within a season (Sunderman et al., 1979).
The portable ion-specific NO3- meter Cardy®
(C-141 Cardy Nitrate Meter, Horiba, Inc.) allows direct and fast readings from a few drops of the material (sap or soil solution). Hochmuth et al. (2003) used Cardy® measurements on petiole extracts of basil plants, showing the reliability of the results in predicting plant N status. The concentrations in soil solution and the sap of tomato plants obtained with an ion-specific nitrate meter for NO3-, K+ and Na+
were well-correlated with results obtained through traditional measurements (Folegatti et al., 2005)
between chlorophyll concentration (SPAD readings) and cotton lint yields. According to Malavolta (2006), cotton leaf samples for chlorophyll content analysis with the SPAD meter must be collected at full bloom, and the meter must be placed on the side lobes of the 4th or 5th leaf from the apex.
The purpose of this study was to investigate the correlation between two methods used for rapid determination of N nutritional status in cotton, a chlorophyll meter (Minolta SPAD-502®) and an ion-specific NO3- meter (C-141 Cardy® Nitrate Meter,
Horiba, Inc.) with N contents determined in laboratory (conventional analysis of dry tissue), as well as their correlation with cotton yield.
MATERIALS AND METHODS
An experiment was conducted under field conditions on the farm Santa Tereza in Itapeva, State of São Paulo, Brazil, in a Clay Red Latossol (Oliveira et al., 1999). Soil analysis (Raij et al., 2001) showed pH 5.8, 22 g dm-3 of OM, 17 mg dm-3 of P
resin, 3.1, 21
and 13 mmolc dm-3 of K, Ca and Mg, respectively, and
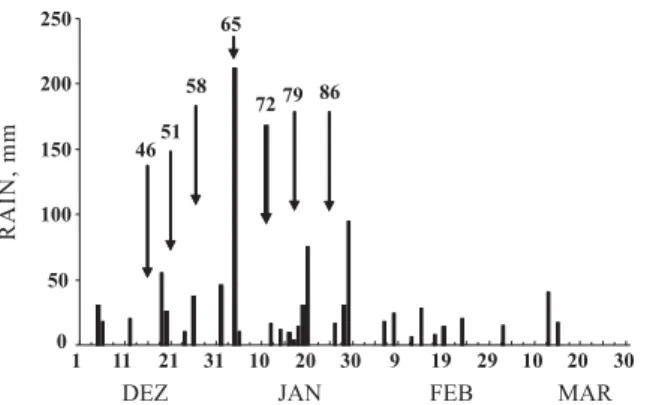
58 % of base saturation. Rains were monitored and observed data are in figure 1.
Cotton (Gossypium hirsutum L., var. Latifolia) cv. Delta 90 BT was planted on 28 October 2007, using 500 kg ha-1 of the fertilizer 8:28:12 applied to the seed
furrow. Stabilization of the number of plants emerging was observed five days after planting, which was considered the date of plant emergence. Four DAE, 80 kg ha-1 K
2O was applied, along with part of
the N, according to the treatments (Table 1). The crop management normally used by the farmer was applied, with the exception of N application. Cotton was harvested by hand on April 28, 2008.
Treatments consisted of the following doses of sidedressed N: 0, 30, 60, 90, and 120 kg ha-1 (Table 1).
The first application was made as close to planting as
possible, in order to establish different levels of N nutrition from the beginning of the plant cycle. The following methods to assess the nutritional status of cotton in N were studied: a chlorophyll meter (Minolta SPAD-502®); an ion-specific NO3- meter (Nitrate Meter C-141 Horiba-Cardy®) and conventional analysis of dry tissue in the laboratory (Malavolta et al., 1997).
The assessment of the plant N nutritional status with the chlorophyll meter is not destructive. Chlorophyll readings of eight plants per plot were taken from the fourth and fifth uppermost fully expanded leaves on the main stem of cotton. The plants were sampled weekly for seven weeks, beginning one week after the onset of “pinhead”. The petioles of the same leaves were collected for ion-selective NO3- readings. The petioles were cut into pieces approximately 2 mm, which were placed in a 3 mL syringe. The sap was extracted by applying pressure on the plunger and four to five drops were placed directly on the sensor pad of a Cardy nitrate meter for analyses. For laboratory analyses the forth and fifth uppermost leaves on the main stem of cotton were sampled from 10 plants per plot, dried in a forced air oven at 65 oC for three days, ground and N determined
by Kjeldahl steam distillation (Malavolta et al., 1997). The experimental design was a randomized complete block with four replications. The plots consisted of six 6-m rows of cotton, separated by a distance of 1.0 m. A correlation study was run on the weekly results obtained with the chlorophyll meter, the selective-ion meter and lab determinations. The standard error was calculated for each determination method in each week. Regressions were adjusted between cotton production and chlorophyll readings, NO3- and N concentrations.
RESULTS AND DISCUSSION
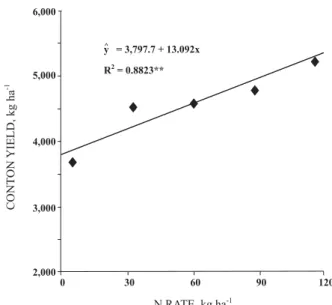
Cotton yields ranged from 3,500 kg ha-1 to more
than 5,000 kg ha-1, compared with the state average
of 2,900 kg ha-1. As expected (Rosolem et al., 2007),
there was a significant linear response to sidedressed N rates up to 120 kg ha-1 (Figure 2), corresponding
to a total application of 160 kg ha-1 N.
Table 1. Rates and time of N application to cotton
The NO3- levels determined with the selective-ion
meter correlated with SPAD readings from 58 DAE onwards, or from the second week of flowering (Table 2), and with N contents in leaves 58 and 65 DAE (second and third week of flowering). However, the NO3- content was correlated with cotton yields before
the third week of flowering (46 DAE). According to Smith et al. (2000), the NO3--N concentrations in the
petiole sap were highly correlated with dry petiole NO3
-N contents throughout the season. Sunderman et al. (1979) stated that petiole NO3- content, one week before
or after early flowering, is a sensitive indicator of applied N rate and may be a good predictor of plant growth and lint yield of a growing season. Our results show that the correlation with cotton yields may be high from one week after pinhead to the fifth week of flowering.
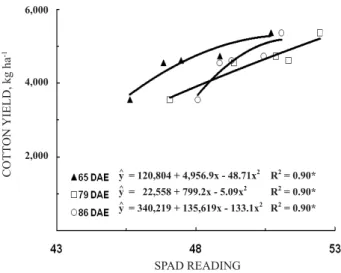
Chlorophyll contents were significantly correlated with cotton production from the third to the fifth week
of flowering (Table 2). SPAD readings should be directly correlated with chlorophyll content and tissue N concentration, in a certain range (Peterson et al., 1993; Nielsen et al., 1995). However, this was not observed in our experiment, where the correlation between chlorophyll contents and N concentration was only significant in the third week of flowering.
Nitrogen concentrations in leaves determined in the laboratory were correlated with cotton yields, except in sampling one week after pinhead (46 DAE) and full flowering (79 DAE). Before the appearance of the first flower a correlation was not expected. But it is rather difficult to explain the lack of correlation during full bloom, the period in which sampling for foliar diagnosis is recommended (Rosolem et al., 2007). One possible reason for the lack of correlation is the heavy rain observed in this period (Figure 1).
In general, N contents determined in cotton leaves increased with N rates, as expected (Figure 3). It is also interesting that N concentrations in the diagnostic leaf increased from the second to the sixth sampling, decreasing afterwards. This period begins with the appearance of the first flowers and lasts until full bloom, usually when sampling for foliar diagnosis is recommended (Malavolta, 2006). For maximum productivity, N leaf contents at cotton full bloom should range from 40 to 45 g kg-1 (Rosolem et al., 2007). In
this study N concentration in the diagnostic leaf were within or above the threshold level and a response to N rates was observed even when sampled earlier than recommended for foliar diagnosis (Figure 3).
Leaf N contents were significantly correlated with cotton yields from one week before flowering to the second week of flowering, and again in the fifth week of flowering, or full bloom (Figure 4), when sampling for foliar diagnosis is recommended (Malavolta, 2006). In the third and fourth weeks of flowering, 72 and 79 DAE, the correlation was not significant. One possible explanation for the lack of correlation in these samplings would be the effect of rain, but in this case a fertigation was applied at 72 DAE and at 79 DAE the soil was water logged, which may have, which may have interfered with the results (Figure 1).
Table 2. Simple linear correlations among NO3- concentrations as determined by a selective-ion meter (Nitrate Meter C-141, Horiba-Cardy®), chlorophyll readings (SPAD-502®, Minolta), leaf tissue N concentrations and cotton yields in each week, from one week after pinhead to the fifth week of flowering
(1) Samples taken 72 days after plant emergence were discarded because the farmer had applied fertigation two hours before. *,
**, r significant (p < 0.05 and p < 0.01, respectively).
Nitrogen levels in the fourth and fifth uppermost leaves on the main stem could therefore be used to diagnose cotton N nutrition as early as one week before the appearance of the first flowers, which could be important for N management since a timely correction of the fertilization program would be possible.
The NO3- contents in cotton petioles, determined
by the selective-ion meter, responded to the N rates (Figure 5), although the correlations of N fertilizer rates and cotton yields were not always significant (Table 2). The NO3- levels in cotton petioles ranged
from less than 2,000 to more than 9,500 mg L-1
(Figure 5). Smith et al. (2000) found that NO3
-determined in dry petiole was highly correlated with NO3- in petiole sap and the equation describing this
relationship is = -1,170.86 + 9.96x, where y is NO3
-in dry petiole (mg kg-1) and x is NO
3- in petiole sap
(mg L-1). Therefore, considering a 10-fold relationship
between petiole sap and dry petiole NO3-, NO3- in dry petiole would range approximately from 200 to 950 mg kg-1 in our experiment. Petiole N-NO
3
-concentrations as high as 24–30 g kg-1 have been
reported in upland cotton (Maples et al., 1977; Gardner & Tucker, 1967), but a critical minimum level of 1– 2 g kg-1 during the first flower period was suggested
to ensure growth and yield of upland cotton in California (MacKenzie et al., 1963). In Texas, this level was adequate for maximum production of Pima cotton, depending on the season (Tewolde et al., 1995). In Arkansa, USA, it was observed that NO3 -concentration in cotton petioles decreased from the first week before flowering to full bloom, during the fourth or fifth week of flowering (Mozaffari et al., 2004). In the present experiment petiole NO3- decreased from one week from pinhead to the fourth week of flowering in malnourished plants. For well-nourished plants, petiole NO3- initially increased until the first week of
flowering and then decreased for three weeks (Figure 5). Regressions between petiole NO3
-concentrations as determined with the selective-ion meter and cotton yields were adjusted for from two weeks before the appearance of flower buds until the second week of flowering (Figure 6). Malavolta et al. (2004) found high correlation between petiole NO3 -levels and cotton production 54 DAE (just before flowering), which supports our results. Levels of N-NO3-N in the cotton petiole in the order of 8000
-10,000 mg L-1 were associated with the highest yield
in this study, under field conditions (Figure 6), whereas in nutrient solution, the level corresponding to the highest yield was 12,300 mg L-1 (Malavolta et
al., 2004), which would correspond to approximately 1.2 g kg-1 (Smith et al., 2000).
Figure 5. NO3- levels in cotton fourth and fifth uppermost main stem petioles, determined with the specific ion meter CARDY-NO3-, as affected
by N rates and sampling time. Vertical bars show the mean standard deviation (bars are shown just for rates of 0 and 120 kg ha-1 for clarity). Average of four replications.
Figure 3. Nitrogen concentrations in the fourth and fifth uppermost leaves on the main stem of cotton, determined in laboratory, as affected by N rates and sampling time. Vertical bars show the mean standard deviation (bars are shown for rates of 0 and 120 kg ha-1 only, for clarity). Average of four replications.
As to the use of chlorophyll readings to estimate N status, there was a significant response to N rates from the second week of flowering onwards (Figure 7). As it was observed for N tissue concentrations this method was also sensitive to changes in N availability before the full bloom stage, when sampling for foliar diagnosis is recommended (Figure 8). In a nutrient solution experiment, Malavolta et al. (2004) observed a significant correlation between SPAD index readings and levels of available N from the second week of flowering, which is similar to the results of this study. In nutrient solution, where the N availability levels differed greatly, Malavolta et al. (2004) concluded that SPAD readings during the flowering period were effective in determining the nutritional status of the plant and were related with cotton yields. In their experiment, maximum production was observed when readings were around 50, during flowering. In the present experiment, SPAD readings were similar at
N rates from 100 kg ha-1 and from the fourth
sampling onwards, which is coincident with results of Malavolta et al. (2004). In our experiment, the yield was highest when the SPAD index was greater than 50. Motomiya et al. (2007) also observed a good correlation between N concentrations in cotton leaves and SPAD readings, reaching maximum levels (> 35 g kg-1) at readings above 50.
CONCLUSIONS
1. The range of N concentrations in the fourth and fifth uppermost leaves on the main cotton stem considered as adequate in traditional foliar diagnosis may be used as a reference from one week before flowering.
2. The selective-ion meter (Nitrate Meter C-141, Cardy®, Horiba) can be used to estimate the N nutritional status of cotton plants until the second week of flowering. In this case, readings of plants with more than 8,000 mg L-1 NO
3-would indicate a good
nutritional status.
3. The chlorophyll meter SPAD-502® (Minolta) can be used to assess the N nutritional status of cotton from the second week of flowering. In this case the readings of well-nourished plants should be above 48.
LITERATURE CITED
FOLEGATTI, M.V.; BLANCO, F.F.; BOARETTO, R.M. & BOARETTO, A.E. Calibration of Cardy®-ion meters to measure nutrient concentrations in soil solution and in plant sap. Sci. Agríc., 62:8-11, 2005.
Figure 7. SPAD index readings in the fourth and fifth uppermost leaves on the main stem of cotton, as affected by N rates and sampling time. Vertical bars show the mean standard deviation (bars are only shown for rates of 0 and 120 kg ha-1 for clarity). Average of four replications. Figure 6. Regressions between cotton yields and
NO3- contends in cotton petioles, as affected by sampling time. **. R2 significant (p < 0.01).
FONTES, P.C.R. Diagnóstico do estado nutricional de plantas. Viçosa, MG, Universidade Federal de Viçosa, 2001. FOX, R.H.; PIEKIELEK, W.P. & MACNEAL, K.M. Using a
chlorophyll meter to predict nitrogen fertilizer needs of winter wheat. Comm. Soil Sci. Plant Anal., 25:171-181, 1994.
GARDNER, B.R. & TUCKER, T.C. Nitrogen effects on cotton: II. Soil and petiole analysis. Soil Sci. Soc. Am. Proc., 31:785-791, 1995.
HOCHMUTH, R.C.; DAVIS, L.L.L.; LAUGHLIN, W.L. & SIMONNE, E. Evaluation of organic nutrient sources in the production of greenhouse hydroponic basil. Suwannee Valley, North Florida Res.Ed. Center, 2003. (Research Report)
MACKENZIE, A.J.; SPENCER, W.F.; STOCKINGER, K.R. & KRANTZ, B.A. Seasonal nitrate-nitrogen content of cotton petioles as affected by nitrogen application and its relationship to yield. Agron. J., 55:55-59, 1963.
MALAVOLTA, E. Manual de nutrição mineral de plantas. Piracicaba, Ceres, 2006. 631p.
MALAVOLTA, E.; NOGUEIRA, N.G.L.; HEINRICHS, R.; HIGASHI, E.N.; RODRIGUEZ, V.; GUERRA, E.; OLIVEIRA, S.C. & CABRAL, C.P. Evaluation of nutritional status of the cotton plant with respect to nitrogen. Comm. Soil Sci. Plant Anal., 35,1007-1020. 2004. MALAVOLTA, E.A.; VITTI, G.C. & OLIVEIRA, S.A. Avaliação do estado nutricional das plantas: Princípios e aplicações. Piracicaba, Potafós, 1997. 201p.
MAPLES, R.; KEOG, J.G. & SABBE, W.E. Nitrate monitoring for cotton production in Loring-Calloway loam. Fayetteville, University of Arkansas, 1977. (Ark. Agric. Exper. Station Bull., 825)
MINOLTA, C. Manual for chlorophyll meter SPAD-502. Osaka, Minolta Radiometric Instruments Divisions, 1989. MOTOMIYA, A.V.A.; MOLIN, J.P.; LIMA, V.P.T.;
CHIAVEGATO, E.J. & DIAS, C.T.S. Medidor portátil de clorofila para estimar nitrogênio foliar em algodoeiro. In: CONGRESSO BRASILEIRO DE ALGODÃO, 7., Uberlândia, 2007. Anais. Uberlândia, 2007. CD ROM. MOZAFFARI, M.; McCONNELL, J.S.; HATTENHAUER, K.;
SLATON, N.A.; EVANS, E.E.; MILEY, N.; BOURLAND, F. & KENNEDY, C. Cotton yield and petiole N content as affected by N fertilizer application. Summaries of Arkansas Cotton Research 2004. Fayeteville, University of Arkansas, 2004. p.89-94. (Arkansas Agric. Exper. Station) NEVES, O.S.C.; CARVALHO J.G.; MARTINS, F.A. D.; PÁDUA, T.R.P. & PINHO, P.J. Uso do SPAD-502 na avaliação dos teores foliares de clorofila, nitrogênio, enxofre, ferro e manganês do Algodoeiro Herbáceo. Pesq. Agropec. Bras., 40:517-521, 2005.
NIELSEN, D.; HOGUE, E.J.; NIELSEN, G.H. & PARCHOMCHUK, P. Using SPAD 502 values to assess the nitrogen status of apple trees. HortScience, 30, 508-512, 1995.
OLIVEIRA, J.B., CAMARGO, M.N.; ROSSI, M. & CALDERANO FILHO, B. Mapa pedológido do Estado de São Paulo. Campinas, Embrapa/IAC, 1999.
OOSTERHUIS, D.M.; COKER, D.L. & PLUNKETT, D.E. Field test of a new cotton petiole monitoring technique. Summaries of Arkansas Cotton Research 2002. Fayeteville: University of Arkansas, 2002. p.121-128. (Arkansas Agric. Exper. Station)
PETERSON, T.A.; BLACKMER, T.M.; FRANCIS, D.D. & SCHEPERS J.S. Using a chlorophyll meter to improve N management. Neb Guide, Lincoln D-13, 1993. 4p. RAIJ, B.van; ANDRADE, J.C.; CANTARELLA, H. &
QUAGGIO, J.A. Análise química para avaliação da fertilidade de solos tropicais. Campinas, Instituto Agronômico de Campinas, 2001. 285p.
ROSOLEM, C. A. Problemas em nutrição mineral, calagem e adubação do algodoeiro. Inf. Agron., 95, set., 2001. (Encarte Técnico)
ROSOLEM, C.A. & MIKKELSEN, D.S. Nitrogen source-sink relationship in cotton. J. Plant Nutr., 12:1417-1433, 1989. ROSOLEM, C.A.; ZANCANARO, L. & TESSARO, L.C. Nitrogênio e enxofre na cultura do algodoeiro. In: YAMADA, T.; ABDALA, S.R.S. & VITTI, G.C. Nitrogênio e enxofre na agricultura brasileira. Piracicaba, IPNI, 2007. p.321-347.
SUNDERMAN, H.D.; ONKEN, A.B. & HOSSNER, L.R. Nitrate concentration of cotton petioles as influenced by cultivar, row spacing and N application rate. Agron. J., 71:731-737, 1979.
SIBLEY, J.L.; EAKES, D.J.; GILLIAM, C.H. & DOZIER Jr., W.A. Potential of Spad-502 chlorophyll meter for determination of leaf greenness. S.N.A. Res. Conf., 39:994-994, 1994.
SMITH, J.H.; SILVERTOOTH, J.C. & NORTON, E.R. Comparison of the two methods for the analysis of petiole nitrate nitrogen concentration in irrigated cotton. Disponível em:<http://ag.arizona.edu/pubs/crops/az1006/ az10068c.html> Acesso em: 8 de Jan. de 2000.
STAUT, L.A. & KURIHARA, C.H. Calagem e adubação. In: EMBRAPA AGROPECUÁRIA OESTE. Algodão: Tecnologia de produção. Dourados, Embrapa Agropecuária Oeste/Embrapa Algodão, 2001.
TEWOLDE, H.; FERNANDEZ, C.J.; FOSS, D.C. & UNRUH Jr., L.G. Critical petiole nitrate-nitrogen for lint yield and enhanced maturity in Pima cotton. Agron. J., 87:223-227, 1995.