NET PRECIPITATION AND RECHARGE OF GROUNDWATER IN RIACHO
FUNDO WATERSHED, FELIXLÂNDIA-MG
1Ana Paula Vilela Carvalho2*, Herly Carlos Teixeira Dias3, Kelly Cristina Tonello4 and Haroldo Nogueira de
Paiva3
1 Received on 23.05.2012 accepted for publication on 08.09.2016.
2 Universidade Federal de Viçosa, Mestrado em Ciência Florestal, Viçosa, MG - Brasil. E-mail. E-mail: <ana.vilelacarvalho@gmail.com>. 3 Universidade Federal de Viçosa, Departamento de Engenharia Florestal, Viçosa, MG - Brasil. E-mail:
<herlycarlostdias@gmail.com>and<hnpaiva@ufv.br>.
4 Universidade Federal de São Carlos, Departamento de Ciências Ambientais, Sorocaba, SP - Brasil. E-mail: <kellytonello@yahoo.com>.
*Corresponding author.
ABSTRACT – The amount of planted forests, especially those with exotic species, has increased along the last years in view of the need to supply the ever-growing demand of domestic and foreign markets for forest products. These crops are not only socially controversial but also polemic in what regards hydrological features of the local watershed. In that sense, we aimed to evaluate the net precipitation and water table level in the Riacho Fundo watershed, in Felixlândia municipality, Minas Gerais state, Southeastern Brazil, in a eucalyptus forest cover area located in the Cerrado of that state. Net precipitation was calculated by the sum of throughfall and stemflow. Water table level was monitored along four sites in the toposequence, where four piezometric wells were drilled. Net precipitation and water table level were evaluated from 2008 through 2010. Water table depth in the Riacho Fundo watershed varied with net precipitation and with the topographic position of the piezometric wells, which shows that groundwater in the eucalyptus forest area was recharged over the monitored years.
Keywords: Eucalyptus; Piezometric well; Net precipitation.
PRECIPITAÇÃO EFETIVA E RECARGA DO LENÇOL FREÁTICO NA BACIA
HIDROGRÁFICA DO RIACHO FUNDO, FELIXLÂNDIA-MG
RESUMO –O plantio de florestas principalmente com espécies exóticas tem crescido a cada dia a fim de suprir a necessidade do mercado interno e externo no que diz respeito à demanda crescente por produtos florestais. Esses plantios geram polêmica no meio social e principalmente em relação às características hídricas da bacia hidrográfica. Nesse sentido, o presente trabalho teve por objetivo avaliar a precipitação efetiva e o nível do lençol freático na bacia hidrográfica do Riacho Fundo, Felixlândia-MG em área de cobertura florestal de eucalipto, localizada no Cerrado mineiro. A precipitação efetiva foi calculada pela soma da precipitação interna e do escoamento pelo tronco. O monitoramento do nível do lençol freático foi realizado em quatro posições na topossequência, onde foram perfurados quatro poços piezométricos. A precipitação efetiva e monitoramento do lençol freático foram avaliados nos anos de 2008, 2009 e 2010. A profundidade do lençol freático na bacia hidrográfica do Riacho Fundo variou em função da precipitação efetiva e posição topográfica do poço piezométrico, constatando a recarga do lençol freático ao longo dos anos de monitoramento em área de cobertura florestal de eucalipto.
1. INTRODUCTION
The amount of planted forests, especially those with exotic species, has increased along the last years in view of the need to supply the ever-growing market demands for forest products. The plantation of eucalyptus forests aims to ensure the supply of raw material for the pulp and paper industry, charcoal for the steel industry, wood and biomass as energy source, essential oils, light posts, gateposts, serrated products, plywood, and reconstituted wood panels such as particleboards, fiberboards, and MDF.
Brazil has 6,515,844 ha occupied by eucalyptus and pine forest plantations. Of that area, 69.6% corresponds to plantations of the former (4,873,952 ha) and 23.4% to plantations of the latter (1,641,892 ha). Furthermore, 421,588 ha are occupied with plantations of acacia, araucaria, paricá, poplar, rubber tree, and teak, among others (ABRAF, 2011).
Forest plantations are socially polemic, since many believe that they are harmful to watersheds, particularly to their original hydrological features. Thus, monitoring and analyzing the hydrological components of these forest crops is greatly necessary. Analyzing the factors that affect watersheds, like the role of vegetation and how it interferes on the water dynamics in watersheds, as well as its importance on watershed maintenance through hydrological processes such as rainfall interception, throughfall, stemflow, and soil water flow, is also of paramount importance (BALBINOT et al., 2008). Net precipitation is the amount of rainwater that reaches the soil, resulting from the sum of throughfall and stemflow. Throughfall is formed by the raindrops that directly cross the forest canopy and the ones the drip from the canopy itself. A part of the rainfall is temporarily retained by plant cover and then evaporates to the atmosphere, constituting the interception process. Another part reaches the soil as throughfall and stemflow (ARCOVA et al., 2003). According to Tonello et al. (2004), net precipitation is influenced by the forest cover, which contributes with soil water recharge and is an indicator of the volume of water effectively precipitated on the watershed surface.
The amount of water on the components involved on net precipitation depends on factors related to both local vegetation and the climate conditions to which the forest is subjected. Vegetation contributes with the components: species amount, diversity, and age;
inclusion range regarding diameter at breast height; type of stemflow collector; crown shape, architecture, and stratification; phyllotaxis; leaf type, size, and shape; bark type; presence of stem irregularities; etc. (OLIVEIRA JÚNIOR; DIAS, 2005). Lima (1976) observed lower stemflow in a Pinus caribea plantation than in a
Eucalyptus saligna one due to the higher bark roughness of pines in relation to eucalypti.
Water uptake by eucalyptus does not necessarily implicates in water deficit on the soil of the planted region, nor in a negative impact on local groundwater. Groundwater is the water found in underground reservoirs, which are characterized by being laid over an impermeable layer of subsoil (e.g., rocks) and by being subjected to local atmospheric pressure. These reservoirs are usually found below the 20-m depth, but other reservoirs can also be found on the surface. In sandy, low-fertility soils (spodosols), for instance, groundwater can be found at depths as shallow as 45 cm below surface. Thus, the impact of eucalyptus plantations on local groundwater must be analyzed under each specific condition (VITAL, 2007).
Studies performed over a seven-year period on
Eucalyptus grandis plantations and a native Atlantic Forest at the Brazilian East coast indicate, from hydrological models, that the former are comparable to the latter in terms of soil water use. However, in dry periods the amount of soil water in eucalyptus forests in lower than in Atlantic Forest fragments. That is because Atlantic Forest tree roots reach depths of up to 5 m, while eucalyptus roots reach no further than 2.5 m. Thus, the Atlantic Forest uses deeper water reservoirs than do eucalyptus plantations, which leads to a lower superficial soil drying at the 2.5-m level (ALMEIDA; SOARES, 2003).
The data obtained in a comparative study on the water uptake in a eucalyptus plantation (900 mm per year), Atlantic Forest (1200 mm per year), and Amazon Forest (1500 mm per year) shows that the soil water regime in the eucalyptus plantation does not differ significantly from that observed in plantations of other forest species, or even in other vegetation types (MORA; GARCIA, 2000).
2. MATERIAL AND METHODS 2.1. Location and characterization of the study area
The Riacho Fundo watershed disembogues in the Três Marias dam, on São Francisco river. The study was conducted at the headwater basin, which is characteristically forest-covered. The headwater basin encompasses an area of 719.92 ha and is majorly occupied by eucalyptus plantations (81.7% of the area); 8.5% of the area is occupied by forest roads and 9.5% represents Cerrado reserve areas.
The watershed is located in Felixlândia municipality, in the central northern region of Minas Gerais state, Southeastern Brazil. The highest and lowest altitudes of the area are 961 and 502 m, respectively. According to Köppen’s classification, climate in the region is mesothermal wet with moderately dry winters (Aw). The predominant natural vegetation is tropical semideciduousCerrado. Mean annual precipitation is 1235 mm. Maximum and minimum mean annual temperatures are 25.3 and 15.5 ºC, respectively (SETZER, 1946). Latosols are the mains soil units in the region (LOPES, 1983).
2.2. Net precipitation (NP, mm)
Net precipitation was calculated by the sum of throughfall (Tf, mm) and stemflow (Sf, mm), as shown in Equation 1:
NP = Tf+Sf (1)
To quantify throughfall, 12 rain gauges were installed in each eucalyptus forest plot: six in the planted lines and six between lines, spaced 5.25 and 2.60 m among each other. Gauge collection area was 176.71 cm2. To
calculate monthly throughfall, we used Equation 2:
where Tf is the throughfall, V is the volume of each rain gauge (mL), and A is the collection area of each gauge (cm2).
To quantify stemflow, nine polyurethane collectors were installed on tree stems in each forest plot: five in one line and four in an adjacent line. To calculate stemflow in each forest plot, we used Equation 3:
where SF is the stemflow, V is the volume of each collector (L), and SA is the area covered by the collectors in each forest plot (100 m2).
Measurements were taken soon after each rainfall event, using measuring cylinders and measuring buckets. 2.3. Water table level monitoring
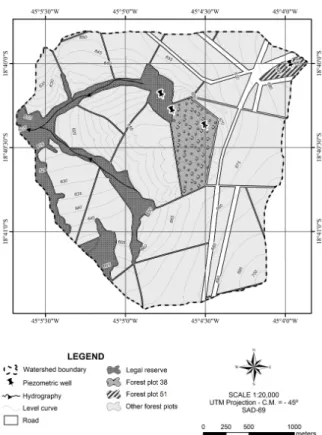
Water table level was monitored in four positions in the toposequnce, for which four piezometric wells were drilled in the Riacho Fundo watershed area (Figure 1).
The piezometric wells (W) were installed at sites: hilltop (W1), slope upper third (W2), slope mid third
(2)
(3)
12
A
V Tf
SA
V
Sf
Figure 1 – Location of piezometric wells in the Riacho Fundo watershed – Felixlândia municipality, Minas Gerais state, Southeastern Brazil.
(W3), and lower land (W4, the lowest point in the region, located within a regenerating Cerrado reserve area) (Table 1).
Water table level was measured using a TLC Meter equipment (model 107), which consists of a measuring tape and water level sensor. When the sensor gets in contact with the water table level, an alarm rings; at that point the water table depth was measured, directly below the measuring tape. Measurements were taken soon after each rainfall event.
3. RESULTS 3.1. Net precipitation
Net precipitation varied along the monitored years. Values are shown in Table 2.
3.2. Water table level variation
Table 3 shows the monthly means for water table depth from 2008 through 2010.
Figure 2 shows the water table depth distribution along the four piezometric wells and cumulative net precipitation from 2008 through 2010.
4. DISCUSSION
Table 3 shows that in piezometric well 1, located on the hilltop, the water table was much deeper than at the other wells in all analyzed months and years, having reached up to 25 m deep. Piezometric wells 2 and 3 had a similar depth, the former being located at a higher slope point than the latter. Well 3 showed higher water recharge than well 2 due to the inflow of groundwater from the highest portions of the terrain. As for well 4, besides being located at the lowest point of the area, conversely to the other wells it is also situated within a reserve area of regenerating Cerrado. It also had a lower depth, i.e., it had a higher recharge due to inflow of groundwater from the highest portions of the terrain, where wells 1 through 3 are located.
Piezometric well 1 2 3 4
Forest plot 51 38 38 Reserve area
Latitude 18º40’00,3’’ 18º40’22,17’’ 18º40’16,71’’ 18º40’11,45’’
Longitude 45º03’58,06’’ 45º04’30,08’’ 45º04’42,44’’ 45º04’46,53’’
Depth (m) 25 21 16 10
Table 1 – Location of piezometric wells in the Riacho Fundo watershed – Felixlândia municipality, Minas Gerais state, Southeastern Brazil.
Tabela 1 – Localização dos poços piezométricos na bacia hidrográfica do Riacho Fundo, Felixlândia- MG.
Table 2 – Net precipitation in the Riacho Fundo watershed – Felixlândia municipality, Minas Gerais state, Southeastern Brazil, from 2008 through 2010.
Tabela 2 – Precipitação Efetiva- PE na bacia hidrográfica do Riacho Fundo, Felixlândia- MG nos anos de 2008, 2009 e 2010.
Month Net precipitation (mm)
2008 2009 2010
January 269 12 105
February 199 317 8
March 233 161 200
April 34 101 45
May 0 11 43
June 0 17 23
July 0 0 0
August 0 13 0
September 8 60 13
October 0 72 100
November 110 55 353
December 376 245 190
Table 3 – Water table mean monthly depth in the Riacho Fundo watershed – Felixlândia municipality, Minas Gerais state, Southeastern Brazil.
Tabela 3 – Profundidade média mensal do lençol freático na bacia hidrográfica do Riacho Fundo, Felixlândia- MG.
Water table depth (m)
2008 2009 2010
Well W1 W2 W3 W4 W1 W2 W3 W4 W1 W2 W3 W4
Jan 21.39 12.88 12.99 2.93 20.94 16.19 10.53 3.56 20.95 16.28 10.54 3.60
Feb 25.00* 9.95 9.45 2.95 25.00* 7.73 3.84 1.03 21.09 17.69 11.77 3.82
Mar 25.00* 9.38 6.06 1.88 21.26 8.46 3.94 1.30 21.25 18.66 11.26 3.48
Apr 25.00* 8.56 5.31 1.55 10.49 9.50 3.96 1.24 16.04 19.06 12.26 3.94
May 21.30 12.01 5.37 2.22 20.51 10.95 4.15 1.64 25.00* 19.30 13.48 5.22
Jun 21.30 12.43 5.78 2.53 20.14 12.70 5.11 2.13 25.00* 19.44 14.34 6.41
Jul - - - - 20.03 13.40 6.10 2.69 25.00* 17.44 13.14 7.61
Aug 21.48 14.51 8.37 3.63 20.09 14.33 7.55 3.24 25.00* 19.87 15.67 8.27
Sep 25.00* 15.41 9.40 3.91 20.21 14.77 8.92 3.46 25.00* 20.24 16.00* 8.63
Oct 25.00* 16.72 10.75 4.21 20.39 15.12 10.21 3.63 25.00* 21.00* 16.00* 10.00*
Nov 25.00* 18.60 12.16 4.92 20.60 15.81 11.49 3.75 25.00* 18.86 14.47 3.85
Dec - - - - 20.86 16.51 12.41 3.73 25.00* 13.31 11.60 3.22
Average 23.55 13.05 8.56 3.07 20.47 13.87 7.35 2.62 23.28 18.50 13.38 5.67
W1 = Piezometric well located on the hilltop.
W2 = Piezometric well located on the slope upper third. W3 = Piezometric well located on the slope mid third.
W4 = Piezometric well located on the lowest point of the reserve area. * = No water in the piezometric well.
- = Not measured.
Table 2 and Figure 2 show that cumulative net precipitation in 2008 was higher than in 2009 and 2010. Table 3 shows that in March and April 2008 the water table was recharged at all piezometric wells
except well 1. From May, wells showed a tendency for water table level lowering. The dryperiod observed from May through October 2008 affected the water table level at piezometric well 1, since the groundwater
Figure 2 – Graphical representation of the water table depth and cumulative net precipitation (CNP) in the Riacho Fundo watershed - Felixlândia municipality, Minas Gerais state, Southeastern Brazil, from 2008 through 2010.
Figura 2 – Representação gráfica do nível do lençol freático e precipitação efetiva acumulada em 2008, 2009 e 2010 na bacia hidrográfica do Riacho Fundo, Felixlândia-MG.
Well 1 Well 2 Well 3 Well 4 CNP 1400 1200 1000 800 600 400 200 0 0 5 10 15 20 30 25 C N P (m m ) W at
er T
ab le D ep th (m ) 2008
Jan Feb Mar Apr May Jun Jul Aug Sep Oct Nov Dec
AVER AGE
Well 1 Well 2 Well 3 Well 4
2009 CNP 0 5 10 15 20 30 25 Water
T able D ep th (m ) C N P (m m ) 1400 1200 1000 800 600 400 200 0 C um ul at iv e N et P re ci pi ta tio n
-Jan Feb Mar Apr May Jun Jul Aug Sep Oct Nov Dec AVER AGE Months Months C um ul at iv e N et P re ci pi ta tio n -1400 1200 1000 800 600 400 200 0 C N P (m m ) C um ul at iv e N et P re ci pi ta tio n -2010
Jan Feb Mar Apr May Jun Jul Aug Sep Oct Nov Dec
AVER AGE Months 0 5 10 15 20 30 25 W at er Tab le D ep th (m )
therein was recharged only in January 2009 (Tables 2 and 3).
The droughtin January 2009 caused a drawdown at well 1, which again reached a 25-m depth. As for wells 2 through 4, groundwater therein was recharged in February. From May, with decreasing precipitation all wells showed a water table level more distant from the surface (Tables 2 and 3).
From May through September 2010, the water table at all wells showed lowering levels and by October all of them had no water. With the beginning of the wet season in October, groundwater at wells 2 through 4 was recharged in November and December (Tables 2 and 3). Figure 2 shows that with increasing net precipitation, the water level at the wells was nearer the surface at all topographic positions of the area. Analogously, whenever rainfall ceased, the water table level lowered, as rainfall is what sustains the Riacho Fundo Stream flow.
Piezometric well 1 was the most affected by the dry period during the three-year water table level monitoring period. That well had its recharge hampered due to its location on a hilltop, from which water flowed to the other piezometric wells, which in turn are located at lower areas of the terrain. Thus, piezometric wells 2 and 3 showed lower interference than well 1 during dry periods because they had water from subsurface and underground flow as sources of water table recharge. Variation in the water table level with precipitation was also observed by Ranzini et al. (2004). Those authors verified that all three piezometric wells drilled on a microbasin covered by Atlantic Forest vegetation showed the water table level near the surface, and that after rainfalls such level quickly drew down. Thus, the loss of soil water in eucalyptus plantations does not depend solely upon water uptake by plants, bus also upon rainfall occurrence in the cultivation region (POGGIANI, 1996).
5. CONCLUSIONS
Water table depth at the Riacho Fundo watershed varied with net precipitation and with the topographic position of the piezometric well, which shows that groundwater in the eucalyptus forest area was recharged over the monitored years.
6. ACKNOWLEDGMENTS
We thank CNPq for the Masters scholarship granted to the first author.
7. REFERENCES
ASSOCIAÇÃO BRASILEIRA DE PRODUTORES DE FLORESTAS PLANTADAS – ABRAF.
Anuário Estatístico ABRAF 2012- Ano Base 2011. [acessado em: 09 maio, 2012]. Disponível em: http://www.abraflor.org.br/.
ALMEIDA, A.C.; SOARES, J.V. Comparação entre uso de água em plantações de Eucalyptus
grandis e Floresta Ombrófila Densa (Mata
Atlântica) na Costa Leste do Brasil. Revista Árvore, v.27, n.2, p.159-170, 2003.
ARCOVA, F.C.S.; CICCO, V.; ROCHA, P.A.B. Precipitação efetiva e interceptação das chuvas por floresta de mata atlântica em uma microbacia experimental em Cunha-SP. Revista Árvore, v.27, n.2, p.257-262, 2003.
BALBINOT, R.; OLIVEIRA, N.K.; VANZETTO, S.C.; PEDROSO, K.; VALERIO, A.F.O papel da floresta no ciclo hidrológico em bacias hidrográficas. Ambiência- Revista do Setor de Ciências Agrárias e Ambientais, v.4, n.1, p.131-149, 2008.
LIMA, W.P. Interceptação da chuva em
povoamentos de eucalipto e de pinheiro. IPEF, n.13, p.75-90, 1976.
LOPES, A.S. Solos sob “cerrado”:
características, propriedades e manejo. Piracicaba: Instituto da Potassa & Fósforo, 1983. 162p.
MORA, A.L.; GARCIA, C.H. A cultura do eucalipto no Brasil. São Paulo: Sociedade Brasileira de Silvicultura, 2000. 112p.
OLIVEIRA JÚNIOR, J.C.O.; DIAS, H.C.T.
Precipitação efetiva em fragmento secundário da Mata Atlântica. Sociedade de Investigações Florestais. Revista Árvore, v.29, n.1. p.9-15, 2005.
RANZINI, M.; LIMA, W.P. Comportamento hidrológico, balanço de nutrientes e perdas de solo em duas microbacias reflorestadas com
Eucalyptus, no Vale do Paraíba, SP. Scientia
Forestalis, n.61, p.144-159, 2002.
SETZER, J. Contribuição para o estudo do clima do Estado de São Paulo. São Paulo: Escolas Profissionais Salesianas, 1946. 239p.
TONELLO, K.C.; CARDOSO, C.A.; DIAS, H.C.T.; SILVA, A.S.; ALVES, M.R.; OLIVEIRA JUNIOR, J.C. Precipitação efetiva em plantio de pinus. Revista da Madeira, v.83, p.118-121, 2004.