Balance of longwave radiation employing the rate of solar radiation
for Santa Maria, Rio Grande do Sul, Brazil
1Saldo de radiação de ondas longas empregando a razão de radiação solar para Santa
Maria/RS
Evandro Zanini Righi2*, Arno Bernardo Heldwein2, Ivan Carlos Maldaner3, Dionéia Daiane Pittol Lucas4 e Paulo
Ervin Stüker5
ABSTRACT - New coefficients were determined for the weighting term for cloudiness in the Brunt-Penman equation using the rate of solar radiation (RK) in place of the rate of sunshine duration (n/N). The coefficients in the Brutsaert method proposed for daytime in southern Brazil were also tested and adjusted, and the method was selected which gave the more accurate daily results in relation to the original Brunt-Penman equation, for Santa Maria in the state of Rio Grande do Sul, Brazil (RS). Meteorological data covering 2,472 days obtained from the automatic and conventional weather stations in Santa Maria were used. The coefficients were adjusted by linear and nonlinear regression methods depending on the model, using 2/3 of the data. The adjusted equations were tested with the remaining 1/3 of the data. The Brunt-Penman equation modified by the term for cloudiness weighted both for solar radiation incident on the surface with no cloudiness (RK,R) and for solar radiation incident at the top of the atmosphere (RK,K), were those that resulted in the best statistical indices relative to the original Brunt-Penman equation. In those equations the boundary conditions, 0.3 RK,R 1 orRK,K 0.22, were imposed. Although having similar statistical indices, a sensitivity analysis showed that the Brutsaert equation and other weightings for cloudiness resulted in larger deviations when compared to the original Brunt-Penman equation, in addition to having greater complexity for practical application.
Key words:Solar radiation. Atmospheric transmissivity. Brunt-Penman equation. Emissivity of the atmosphere.
RESUMO -Foram determinados novos coeficientes do termo que pondera a nebulosidade na Equação de Brunt-Penman utilizando-se a razão de radiação solar (RK) no lugar da razão de insolação (n/N) e foram testados e ajustados coeficientes das equações do método de Brutsaert propostas para o período diurno no sul do Brasil e verificou-se qual das metodologias tem resultados mais corretos em relação à Equação de Brunt-Penman original, para Santa Maria/RS, para o período diário. Foram utilizados dados meteorológicos obtidos nas Estações Meteorológicas Automática e Convencional de Santa Maria em 2.472 dias. Os coeficientes foram ajustados pelo método de regressão linear ou não-linear, dependendo do modelo, utilizando-se 2/3 dos dados. As Equações ajustadas foram testadas com os demais 1/3 dos dados. A equação de Brunt-Penman modificada com o termo da nebulosidade ponderada tanto pela radiação solar incidente na superfície na ausência de nebulosidade (RK,R) como pela radiação solar incidente no topo da atmosfera (RK,K), foram aquelas que resultaram nos melhores índices estatísticos comparativamente à equação original de Brunt-Penman. Nessas equações foram impostas as condições de contorno: 0,3 RK,R 1 ouRK,K 0,22. Embora com índices estatísticos semelhantes, uma análise de sensibilidade mostrou que a equação de Brutsaert e demais ponderadoras da nebulosidade resultaram em maiores desvios quando comparadas com a Equação original de Brunt-Penman, além de apresentarem complexidade superior para a aplicação prática.
Palavras-chave: Radiação solar. Transmissividade atmosférica. Equação de Brunt-Penman. Emissividade da atmosfera.
*Autor para correspondência
1Recebido para publicação em 04/02/2013; aprovado em 15/10/2014
Trabalho técnico-científico com finalidade operacional na estimativa do saldo de radiação de ondas longas com dados de estação meteorológica automática
2Programa de Pós-Graduação em Agronomia, Departamento de Fitotecnia, Universidade Federal de Santa Maria, Av. Roraima, 1000, Camobi,
Santa Maria-RS, Brasil,[email protected], [email protected]
INTRODUCTION
Net radiation at the surface (Q*) is the main input variable in the calculation of evapotranspiration, being of great importance in modelling and climate forecasting and in planning the use of water resources (KJAERSGAARD;
PLAUBOR; HANSEN, 2007; SANTOS et al., 2011;
SRIDHAR; ELLIOTT, 2002).
When calculatingQ* the balance of both shortwave
(K*) and longwave (L*) radiation are included. Accuracy
depends on the quality of the measurements, adjustment of the coefficients or estimates of other input terms of the models (KJAERSGAARD; PLAUBORG; HANSEN,
2007). The calculation of L* is more challenging as it
is a function of surface temperature and the effective temperature of the atmosphere, being dependent on atmospheric properties, mainly cloudiness and humidity
(e) (KRUKet al., 2010; SEDLAR; HOCK, 2008), and
its direct measurement requires the use of special filters.
Due to these factors, measuring L* becomes complex
and expensive (DUARTE; DIAS; MAGGIOTTO, 2006;
FIETZ; FISCH, 2009; SAMANIet al., 2007; SRIDHAR;
ELLIOTT, 2002). Additionally, Savage and Heilman (2009) and Blonquist, Tanner and Bugbee (2009) cite authors who question the accuracy of net radiometers.
Despite the complexity, Brunt (1932) proposed an empirical equation forL* based on the air temperature (T)
and e. Brunt (1939) later included a weighting-term for
cloudiness (m). Penman (1948) replaced m by the rate of
sunshine duration (m/10 = 1 –n/N), which then came to be called the Brunt-Penman equation, and which can be
used for a uniform, flat surface (HELDWEINet al., 2012).
This methodology has been used in studies in Santa Maria
to estimate L* (SILVAet al., 2011; SILVAet al., 2008;
PIVETTAet al., 2011; TAZZOet al., 2012) and has produced good results at various locations (BILBAO; DE MIGUEL, 2006; CROWFORD; DUCHON, 1999; LHOMME;
VACHER; ROCHETEAU, 2007; PÉREZ-GARCIA, 2004;
SOBRINHO, 2011; SRIDHAR; ELLIOT, 2002).
With easier access to data from automatic stations, which measure global solar radiation incident on the surface (K ) and notn, Allenet al. (1998) replacedn/N by a function of the ratioK to the global solar radiation that would fall on the surface in the absence of clouds (Kso ). In Santa Maria RS, in a pre-analysis of the data which took as a reference the original Brunt-Penman equation, there was a significant deviation from a 1:1 straight line [L* =
0.4164 + 0.8934L*
FAO , withL*FAO being calculated using the coefficients of Allenet al. (1998)], indicating a need to fit the equations to the local conditions.
There are relatively simple, alternative methods
for the determination of L*. Brutsaert (1975) derived
an equation for the effective emissivity of a clear sky
( c) in the calculation of longwave radiation incident on
the surface (L
c ), where the weighting for cloudiness is
a function of the cloud cover fraction. Duarte, Dias and Maggiotto (2006) adjusted the coefficients of the equations for daytime on an hourly basis using the rate of radiation in Ponta Grossa in the state of Paraná (PR), getting good results compared to measured values.
The aims of this work were (i) calculate new coefficients of the weighting term for cloudiness of the atmosphere in the Brunt-Penman equation using the rate of solar radiation (RK) in place ofn/N, and readjust the coefficients for weighting cloudiness of the atmosphere in the equations proposed by Duarte, Dias and Maggiotto (2006) and (ii) determine which methodology gives the more correct results in relation to the original Brunt-Penman equation, for Santa Maria, on a daily basis.
MATERIAL AND METHODS
Meteorological data for global solar radiation incident on the surface ( , MJ m-2 d-1), air temperature
(T, K) and relative humidity (RH%) were obtained
from the automatic weather station belonging to the 8th Meteorological District of the National Meteorological Institute (8th DISME/INMET), located in the Department for Plant Science of the Federal University of Santa Maria (29°43’ S, 53°43’ W, at an altitude of 95 m). The values were obtained on an hourly basis and from these the daily average was calculated, with the exception of the
accumulation of during the day. The data for actual
sunshine duration (n, h) were obtained from the main
conventional station also belonging to the 8th DISME/ INMET, located by the side of the automatic station. Only days with no missing data were used.
The original Brunt-Penman equation (Equation 1) was taken as the reference, following the proposition of Doorembos and Pruitt (1975) for wet climates, but with the constants related to the effect of air humidity corrected for the use of partial vapour pressure in hPa:
L* = - T (0.56-0.0779 e)(0.1+0.9n/N) (1)
where is the emissivity of the surface, is the Stefan-Boltzmann constant (4.903 10-9 MJ m-2 d-1 K-4) andN is the
Allen et al. (1998) replaced the function for the rate of sunshine duration in equation 1 with the relation a +b R
K. Local calibration ofa andb was done by linear regression between the original values of the Brunt-Penman equation (left-hand side of Equation 2) and the rate of solar radiation (R
K):
0.1 + 0.9n/N = a + bRk (2)
RKcan be calculated in relation to the global solar radiation incident on the surface on cloudless days (Kso ,MJ m-2 d-1) or in relation to the solar radiation incident on the top of the atmosphere (Ko ,MJ m-2 d-1):
RK,R = K /KSO (3)
R
K,R = K /Ko (4) Allenet al. (1998) used equation 3 for quantifying R
K, recommending the sum of the adjustment coefficients
for the Ångström-Prescott equation (assumingn/N = 1)
multiplied byK
o for calculating Kso , so representing
the average conditions of the local atmospheric
transmissivity under a cloudless sky. Buriolet al. (2012)
updated these coefficients for Santa Maria. In the absence
of these coefficients, Allen et al. (1998) recommend
using the equationK
so = (0.75 + 2 10
-5z)K
o , wherez
is the local altitude. This equation considers that at sea level, a condition similar to Santa Maria (95 m altitude), atmospheric transmissivity is equal to approximately 0.75 throughout the year. In this work, equations
3 and 4 were tested to determine R
K, with the values
for K
so determined from the local Ångström-Prescott
coefficients (BURIOLet al., 2012), by the alternative
equation given by Allenet al. (1998) and from a cosine
curve adjusted for the three maximum values for R
K,K
in each month and the Julian day (D). Although it is
unclear in Allenet al. (1998), according to ASCE-EWRI
(2005), a boundary condition of 0.3 R
K,R 1.0 should
be imposed, corresponding toR
K,K 0.22, assuming an
average transmissivity for the atmosphere of 0.75.
To obtain L* from the Brutsaert equation for the
emissivity of a clear sky and weightings for the cloud cover fraction (c), the longwave radiation emitted by a clear sky to the surface is first calculated from the air temperature (Lc ), seeing that within any 24 hour period the values for the air and surface temperatures tend to converge:
L
c = - c T (5)
L
c is the effective emissivity of a clear sky, derived
physically by Brutsaert (1975) with its coefficients adjusted for hourly daytime data in Ponta Grossa, PR
(DUARTE; DIAS; MAGGIOTTO, 2006):
c =0.625 (e/T)
0.131 (6)
In equation 6,e should be expressed in Pa:
e =610.8110[7.5 (T- 273)/(237.5 + T- 273)]UR/100 (7)
To allow for the effect of cloud cover throughout the day, Duarte, Dias and Maggiotto (2006) adjusted and tested Equations 8 and 9:
= Lc (1 + 0.242c0.583) (8)
= Lc (1 -c0.671) +0.990c0.671 T4 (9)
where is the longwave radiation emitted by the sky
under any cloud conditions (MJ m-2 d-1). As it is difficult
to find values forc taken throughout the day, Crowford
and Duchon (1999) suggested the relation:
c= 1 - R
K,R (10)
which was used by Duarte, Dias and Maggiotto (2006) and in this work.
L* is given by equation 11:
L* = L + L = - T4+ L (11)
Calibration of the coefficients of Equation 2 and local readjustment of the coefficients in equations 8 and 9 were done with two thirds of the 2,472 days of available data from the automatic weather station, selected for two days in every three throughout the series. The remaining days were used to test the performance of the equations by regression analysis, using the equation coefficients as accuracy indicators (a = 0 and b = 1), and the coefficient of
determination (R2) and the root mean square error (RMSE)
as indicators of data dispersion around the average (best
results corresponding to R2 1 and RMSE 0). Analyses
were carried out using the R software (R DEVELOPMENT CORE TEAM, 2012).
RESULTS AND DISCUSSION
Modified Brunt-Penman equation
Tests of the estimates ofL* withR
K,R (Equation 5)
obtained withK
so determined from the monthly coefficients
of Ångström-Prescott adjusted to Santa Maria (BURIOLet
al., 2012) with the modified equation 1, resulted in smaller deviations, better fits and in slopes closer to 1.00 when compared to the values estimated by equation 1 in relation
to the other methods of calculatingR
K,R (data not shown).
Statistical Estimates of L* obtained using the alternative
equation proposed by Allenet al. (1998) - ffor Santa Maria (altitude of 95 m),R
K,R = (0.75 + 2 10-5z)Ko 0.75Ko - or the cosine equation (Figure 1), were very close to those
of the Ångström-Prescott monthly coefficients (BURIOLet
in significantly greater average values for the transmissivity of clear skies (Tr
clear) (p<0.01 by t-test, averages of 0.75, 0.74 and 0.78 for the daily estimates respectively).
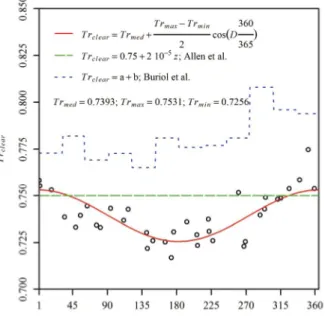
Figure 1 - Variation in the three largest monthly values of maximum transmissivity for global solar radiation under a cloudless sky (Trclear =K Ko -1; points) of the atmosphere in Santa
Maria as a function of the Julian day (D), and those estimated by the cosine equation (continuous line), the alternative equation suggested by Allen et al. (1998) (long-dashed line) and the sum of the coefficients (a + b) of the Ångström-Prescott equation as determined by Buriol et al. (2012) (short-dashed line). Trmed, Trmax andTrmin are respectively the annual mean, maximum and minimum values for transmissivity.z is the local altitude (95 m)
Despite the lower physical coherence, the
alternative equation by Allen et al. (1998) resulted
in estimates of L* quite close to those of Equation 1,
with a non-significant linear coefficient (p > 0.05),
a slope equal to 0.9989, R2 equal to 0.99 and RMSE
of 0.62 MJ m-2 d-1, almost the same statistical indices
obtained with the local coefficients of Buriol et al.
(2012). Therefore, due to the convenience of using
the alternative equation of Allen et al. (1998), which
assumes a fixed value throughout the year, and to the statistical results indicating the same quality as when using local coefficients, it was considered appropriate to
use the equationRK,R = 0.75Ko in the other analyses.
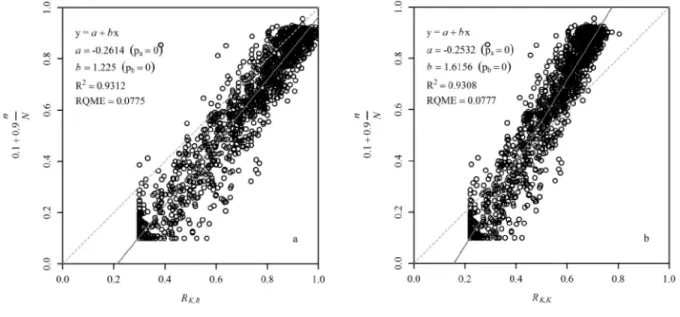
In Figure 2a it can be seen that the coefficients
adjusted forR
K,R in place of the rate of sunshine duration
(modified Equation 1) differ from those specified by
Allen et al. (1998): -0.2614 against -0.35 and 1.2250
against 1.35. This discrepancy confirms the need for local determination of these coefficients in order to get estimates which are more consistent with Equation 1. Theoretically, the sum of the coefficients of the weighting term for cloudiness in equation 1 should be equal to 1, implying that cloudiness has no effect on the
counter-radiation when there are no clouds (n/N = 1). However,
the sum of the weighting coefficients of cloudiness in
equation 1 modified by R
K,R (Figure 2a) differs from 1
by 0.0364 (1.2250 - 0.2614 = 0.9636). Lhomme, Vacher and Rocheteau (2007) also found a difference of this magnitude in these coefficients on an hourly timescale and considered it to be the result of the purely statistical nature of the relation, recommending deletion of the weighting term for cloudiness in the modified equation
1 whenR
K,R = 1.
Alternatively the same estimation can be made
considering Ko instead of Kso , which gives RK,K
(equation 4) and results in a slope of b = 1.6156 (Figure 2b), with practically the same value for the coefficient of
determination (R2), RMSE and linear coefficient. The
disadvantage of usingRK,K is the difficulty of imposing
a physically valid upper limit, as is done withRK,R and
n/N, where the maximum value is 1.
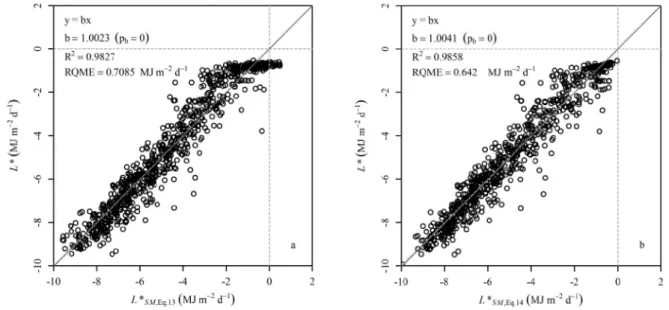
In testing equation 1 modified by the coefficients calculated for Santa Maria (Figure 2) from independent data (Figure 3), it is seen that fitting to the values of the original Brunt-Penman equation
remained high (R2 0.99) and the error was relatively
low (RMSE 0.62 MJ m-2 d-1), with estimated values
of -10.40 to -0.55 MJ m-2 d-1. Imposition of a
lower limit ofRK,R = 0.30 andRK,K = 0.22, proved to be very effective in fitting the data and in the quality of the estimates obtained with the independent data. In a test of adjusted equations where these limits were not considered, 3.60% of the estimated values were seen
to be above 0 MJ m-2 d-1, with a maximum of 0.63 MJ
m-2 d-1. If they occur, daily positive values ofL* for
Santa Maria should be close to zero, with values such
as 0.63 MJ m-2 d-1 being inconsistent. Furthermore,
not imposing these limits led to higher RMSE values
0.72 MJ m-2 d-1, data not shown), although there is
a tendency to overestimate RK on days whenn/N 0
(respective averages forRK,R andRK,K of 0.17 and 0.13
when imposingRK,R = 0.30 andRK,K = 0.22).
The Brutsaert equation and weightings for cloudiness corrected for Santa Maria
From comparison of the results of Equation 11 with those of equation 1, given 1.00 c 0.00, the
Figure 2 - Relation between the weighting term for cloudiness in equation 1 (0.1 + 0.9n/N) and (a) the rate of radiation as determined by equation 3 (RK,R) and (b) by equation 4 (RK,K). pa and pb in parentheses indicate the level of significance of their respective coefficients
to be significantly lower (coefficients of the adjustment
equation: a = -1.8607 and b = 1.1096 (p<0.01), R2 =
0.86, RMSE = 0.99 MJ m-2 d-1), a fact also noted by
Duarte, Dias and Maggiotto (2006). Using equation 9
to estimate however, data adjustment was high (R2
= 0.93) and the error was relatively small (RMSE =
Figure 3 - Comparison of the values for net longwave radiation estimated by equation 1, and by equation 1 modified with (a) the rate of radiation obtained by equation 3 and (b) by equation 4, with the calculated coefficients for Santa Maria (Figure 2). The linear coefficients of the regression equations were not significant at 5% probability. pb shows the level of significance of the slope of the adjustment equation
0.68 MJ m-2 d-1), indicating the potential for its use with
coefficients corrected for Santa Maria RS, although there was significant deviation from a 1:1 straight line (a = -1.3727, b = 1.2119, p<0.01) and a significant
frequency of positive values forL*. Correction of the
with values forL* determined by Equation 1, isolating in equation 11 and replacing it by equation 9 with the coefficients unknown, according to Equation 12:
L* + T4 = L
C (1 -c
b’) + a’cb’ T4 + c’ (12)
where a’, b’ and c’ are the adjustment coefficients.
In relation to equation 9, the linear coefficient c’ was
added. Modifications were therefore made only on
the component of L* (referring to the emission of
radiation by the atmosphere), which is more dependent on atmospheric conditions and the predominant type of cloud in the area; with the term referring to the emission of radiation by the surface and by a cloudless atmosphere, both of which are derived physically, remaining the same. In addition, the coefficients adjusted for Ponta Grossa (DUARTE; DIAS; MAGGIOTTO, 2006) refer to daytime and to hourly data, and although developed for
1.00 c 0.00, the boundary conditions suggested by
Allen et al. (1998) and ASCE-EWRI (2005) were also
tested. Thus, by using numerical methods, adjustment of the coefficients was achieved considering the whole
range of variation ofc (1 to 0: equation 13) and imposing
0.30 RK,R 1.00 as suggested by Allenet al. (1998) and
ASCE-EWRI (2005), i.e. 0.70 c 0 (Equation 14):
= Lc (1 -c0.7157) + 1.0410c0.7157 T4 - 2.7044 (13)
= Lc (1 -c0.9482) + 1.0647c0.9482 T4 - 2.1132 (14)
Adjustment of the data was high when generating
the new coefficients (R2 = 0.96 and RMSE = 0.70 MJ
m-2 d-1 with equation 13, and R2 = 0.97 and RMSE =
0.64 MJ m-2 d-1 with equation 14), for all significant
coefficients (p<0.01). Compared to equation 9, there
was a significant increase in the exponent forc (0.671
to 0.7161 with equation 13, and to 0.9482 with Equation 14) and in the multiplying coefficient for the second right-hand side term (0.9900 to 1.0410 in equation 13, to 1.0647 in equation 14). The most significant change
was in coefficient b’ that defines the shape of the
response curve for cloudiness.
Testing equations 13 and 14 with the independent
data resulted in a high adjustment to equation 1 (R2 0.98
and RMSE equal to 0.71 and to 0.64 MJ m-2 d-1 respectively),
with a non-significant linear coefficient (p>0.05) and slope 1 (Figure 4). It was noted that the statistical indices for the estimates of equation 14 (Figure 4b) were quite similar to those of the modified equation 1, while equation 13 had lower statistical indices (Figure 4a). Moreover, not imposing an upper limit for cloudiness resulted in 2.30% of days withL* > 0.0 MJ m-2 d-1, to
a maximum of 0.48 MJ m-2 d-1, again pointing to the
efficiency of the limits suggested by Allenet al. (1998)
and Asce Ewri (2005) forRK,R.
Comparison between methods and discussion of the results
In an overall assessment, the coefficients adjusted for the rate of radiation (Figure 2) in the modified equation 1, and in equations 13 and 14 for the
calculation of , showed similar statistical adjustments
when compared to the data from equation 1 with the original coefficients. However, with no limits imposed (0.30 R
K,R 1.00, 0.22 RK,K, 0.70 c 0.00), there was an
estimate ofL* > 0 MJ m-2 d-1 for both methodologies,
which is unexpected for the daily climatic conditions of
Santa Maria, RS. For the entire data set,L* calculated
with equation 1, resulted in a maximum value of -0.56 MJ m-2 d-1 against -0.57 MJ m-2 d-1 with the modified
equation 1 with the imposed boundary conditions, 0.48 MJ m-2 d-1 by equation 13 and 0.04 MJ m-2 d-1 by
equation 14. These results, arising from the different types of cloud when the sky is completely overcast, result in a registered sunshine duration of almost zero (n = 0 h), but with different variations in and (GUEYMARD; JINDRA; ESTRADA-CAJIGAL, 1995; MONTEITH; UNSWORTH, 1990).
On 63% of the days withRK,R <0.3, rainfall greater than 2.00 mm was seen, indicating the predominance
of cloudiness and different classes of cloud whenn/N 0.
The different types of cloud on overcast days result
in a large variation in (GUEYMARD; JINDRA;
ESTRADA-CAJIGAL, 1995; LHOMME; VACHER; ROCHETEAU, 2007), and in deviations from linearity
in the ratio of RK to n/N. The greater importance of
the differences in measured on overcast days is
due to the low daily values seen for solar radiation, whereas on predominantly sunny days, values for measured at times of direct sunshine are much greater,
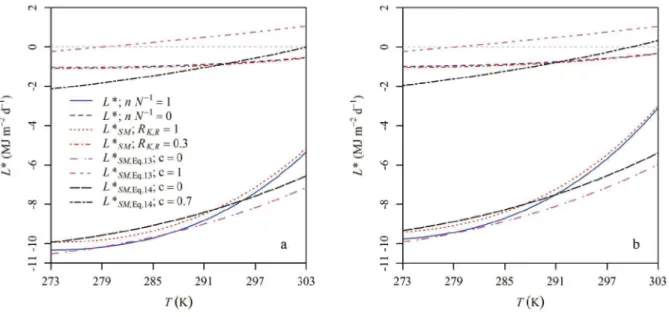
Figure 5 - Simulation of the longwave radiation balance estimated by Equations 11, 13 and 14 (L*SM,Eq.13 eL*SM,Eq.14), by Equation 1 modified byRK,R and the local coefficients (L*SM) and by the Brunt-Penman Equation (equation 1,L*) for temperaturesT, in the range of 273-303 K and relative humidity equal to 70% (a) and 90% (b), for days without cloud cover (c = 0;RK,R =n/N = 1) and completely overcast days (c = 1 orc = 0.7;RK,R = 0.3;n/N = 0)
the overcast periods becoming less important when making up the total daily value. In other situations, though less frequent, the formation of isolated cumulus clouds enables reflection of solar radiation off the cloud-wall towards the surface (MONTEITH; UNSWORTH, 1990), resulting in higher records for compared to days with similar cloud cover of other types. These conditions may explain some of the greatest deviations seen when testing models modified
for use in relations whereR
K,R orRK,K substitute the rate of sunshine duration.
Although solar radiation shows sensitivity to
the type of cloud, is dependent on the effective
temperature of the sky and its emissivity, being more sensitive to the part of the sky covered by clouds and to the height of the cloud base than to cloud thickness (MONTEITH; UNSWORTH, 1990). According to Monteith and Unsworth (1990), the emission of radiation by an overcast sky is a function of the temperature of the cloud base and the atmosphere below it, making it
possible to use a linear relation between L* and n/N.
This however needs correcting to be maintained forRK,
and is achieved with the boundary condition suggested
by Allen et al. (1998) and by ASCE-EWRI (2005).
This linearity is also seen by increasing the exponent
of c to a value close to 1.00 in equation 14, meaning
Compared to the original coefficients of Duarte, Dias and Maggiotto (2006), there is a slight trend towards an increase in linearity when the entire range
of c (1 to 0) is used, corresponding to a less intense
effect from the clouds (or the degree of cloudiness)
in Santa Maria RS when the value of c is low, which
may be linked to the different types of cloud or to the different time scales used. Another important factor is the occurrence and characteristics of night and morning mists in Santa Maria, which are then weighted by the new coefficients. Overnight mists usually dissipate
early in the day, and are not weighted either byR
K or
n. In the early hours of the morning however, although
there is no record forn when there is mist, relatively
high intensities of radiation are recorded compared to periods of overcast sky.
In a sensitivity analysis, taking as reference
equation 1 and an RH equal to 70% and 90%, it was
found that deviations for the modified equation 1 adjusted for Santa Maria are greater when the days are sunny, and lower on overcast days (Figure 5a and 5b).
On the other hand, equation 13 estimatesL* with a high
fit to equation 1 on sunny days for a temperature range
of 273 K to about 290 K for an RH of 70%, and to
about 285 K for anRH of 90%, with increasing errors
at higher temperatures.
Despite better statistical results when testing the
equations (Figure 5), equation 13 overestimatesL*, with
deviations greater than those of equation 14, up to 292 K
when theRH is equal to 70% and up to 287 K when theRH
equals 90%, on days without cloud cover. For high values
ofT, equation 14 also underestimatesL*, although with
less intensity than does equation 13. For overcast skies, equations 13 and 14 give very different results, with the
first overestimating values forL* over the whole studied
range ofT, whereL* > 0 MJ m-2 d-1 forT 279 K, while
equation 14 underestimates L* up to 293 K and 291 K
(Figures 5a and 5b respectively).
This analysis shows that in the middle of the
higher frequency range for the average dailyRH in Santa
Maria (60% <RH 80% on 74% of the days evaluated)
and the more frequent of the average daily temperatures
(288 <T 298 K on 62.5% of the days evaluated), the
values estimated by equation 1, modified considering
the boundary conditions (ALLEN et al., 1998;
ASCE-EWRI, 2005), display the smallest deviations in relation to equation 1. The use of equation 13 would have some advantage only at the lower limit of this temperature range, while equation 14 results in greater deviations
across practically the whole range of variation of T.
When theRH is high, Equations 13 and 14 result in even
greater deviations compared to Equation 1. Therefore, the modified equation 1 (Figure 2) is the equation that
estimates values for L* as a function of R
K which are
closer to those of the original Brunt-Penman equation that adjusts for the rate of sunshine duration. In that
equation, the use ofR
K,R should be preferred, as it allows for greater control of the physical quality of the observed data for solar radiation.
CONCLUSION
The modified Brunt-Penman equation is the one that best approximates the values for the balance of longwave radiation for Santa Maria, RS as a function of the rate of radiation, compared to the original Brunt-Penman equation:
L* = - T (0.56-0.0779 e)(1.2250RK,R- 0.2614) (15)
where = 4.903 10-9 MJ m-2 K-4 d-1 is the Stefan-Boltzmann
constant,T is the average daily air temperature in K, e is the partial vapour pressure of the air in hPa andRK,R =K /Kso
(0.3 RK,R 1.0), whereK is the global solar radiation
incident on a horizontal flat surface and Kso = 0.75 Ko is the radiation incident on the surface in the absence of clouds.
REFERENCES
ALLEN, R. G.et al.Crop evapotranspiration: guidelines for computing crop water requirements. Roma: FAO, 1998. 300 p. ASCE-EWRI. The ASCE standardized reference evapotranspiration equation. Reston: American Society Civil Engeneers, 2005. 59 p.
BILBAO, J.; DE MIGUEL, A. H. Estimation of daylight downward longwave atmospheric irradiance under clear-sky and all-sky conditions.Journal of Applied Meteorology and Climatology, v. 46, n. 6, p. 878-889, 2007.
BLONQUIST, J. M.; TANNER, B. D.; BUGBEE, B. Evaluation of measurement accuracy and comparison of two new and three traditional net radiometers. Agricultural and Forest Meteorology, v. 149, n. 10, p. 1709-1721, 2009.
BRUNT, D. Notes on radiation in the atmosphere.Quarterly Journal of the Royal Meteorological Society, v. 58, n. 247, p. 389-418, 1932.
BRUNT, D.Physical and Dynamical Meteorology. Cambridge University Press, 1939. 430 p.
BRUTSAERT, W. On a derivable formula for long-wave radiation from clear skies.Water Resources Researches, v. 11, n. 5, p. 742-744, 1975.
CROWFORD, T. M.; DUCHON, C. E. An improved parameterization for estimating effective atmospheric emissivity of use in calculating daytime downwelling longwave radiation. Journal of Applied Meteorology, v. 38, n. 4, p. 474-480, 1999. DOOREMBOS, J.; PRUITT, W. O.Guidelines for predicting crop water requirements., Roma: FAO, 1975. 179 p.
DUARTE, H. F.; DIAS, N. L.; MAGGIOTTO, S. R. Assessing daytime downward longwave radiation estimates for clear and cloudy skies in Southern Brazil. Agricultural and Forest Meteorology, v. 139, n. 3/4, p. 171-181, 2006.
FIETZ, C. R.; FISCH, G.F. Avaliação de modelos de estimativa do saldo de radiação e do método de Priestley-Taylor para a região de Dourados, MS.Revista Brasileira de Engenharia Agrícola e Ambiental, v. 13, n. 4, p. 449-453, 2009.
GATES, D. M. Biophysical ecology, Mineola: Dover Publications, Inc., 2003. 611 p.
GUEYMARD, C.; JINDRA, P.; ESTRADA-CAJIGAL, V. A critical look at recent interpretation of the Ångström approach and its future in global solar radiation prediction.Solar Energy, v. 54, n. 5, p. 357-363, 1995.
HELDWEIN, A. B. et al. Estimativa do saldo de radiação em girassol como função da radiação solar global.Revista Brasileira de Engenharia Agrícola e Ambiental, v. 16, n. 2, p. 194-199, 2012. KJAERSGAARD, J. H.; PLAUBORG, F. L.; HANSEN, S. Comparison of models for calculating daytime long-wave irradiance using long term data set. Agricultural and Forest Meteorology, v. 143, n. 1/2, p. 49-63, 2007.
KRUK, N. S.et al. Downward longwave radiation for clear clear and all-sky conditions in the Sertãozinho region of São Paulo, Brazil.Theoretical and Applied Climatology, v. 99, n. 1/2, p. 115-123, 2010.
LHOMME, J. P.; VACHER, J. J.; ROCHETEAU, A. Estimating downward long-wave radiation on the Andean Altiplano. Agricultural and Forest Meteorology, v. 145, n. 3/4, p. 139-148, 2007.
MONTEITH, J. L.; UNSWORTH, M. H. Principles of Environmental Physics. Nova York: Edward Arnold, 1990. 291 p. PENMAN, H. L. Natural evaporation from open water, bare soil and grass.Proceedings of the Royal Society A. v. 193, n. 1032, p. 120-146, 1948.
PÉREZ-GARCIA, M. Simplified modeling of the nocturnal clear sky atmospheric radiation for environmental applications. Ecological modeling, v. 180, n. 2/3, p. 395-406, 2004.
PIVETTA, C. R.et al. Evapotranspiração máxima do tomateiro sob estufa plástica em função de variáveis fenométricas e meteorológicas.Bragantia, v. 70, n. 3, p. 707-714, 2011. R DEVELOPMENT CORE TEAM. R: A language and environment for statistical computing, Viena: R Fundation for Statistical Computing, 2012. Disponível em: < http://www.R-project.org/>. Acesso em: 10 out. 2013.
SAMANI, Z.et al. Estimating daily net radiation over vegetation canopy through remote sensing and climatic data. Journal of Irrigation and Drainage Engineering, v. 133, n. 4, p. 291-297, 2007.
SANTOS, C. A. C. dos et al. Downward longwave radiation estimates for clear-sky conditions over northeast Brazil.Revista Brasileira de Meteorologia, v. 26, n. 3, p. 443-450, 2011. SAVAGE, M. J.; HEILMAN, J. L. Infrared calibration of net radiometers and infrared thermometers. Agricultural and Forest Meteorology, v. 149, n. 8, p. 1279-1293, 2009.
SEDLAR, J.; HOCK, R. On the use of incoming longwave radiation parameterizations in a glacier environment. The Cryosphere Discussion, v. 2, n. 4, p. 487-511, 2008.
SILVA, J. C.et al. Necessidade de irrigação para o feijoeiro na região central do Rio Grande do Sul.Revista Brasileira de Engenharia Agrícola e Ambiental, v. 15, n. 10, p. 1030-1036, 2011.
SILVA, J. C. et al. Funções de distribuição de probabilidade decendial e mensal para a deficiência hídrica no solo.Ciência Rural, v. 38, n. 7, p. 1893-1899, 2008.
SOBRINHO, F. J. C.Modelos para estimativa da radiação de onda longa atmosférica no serrado mato-grossense, Cuiabá. 2011, 151 f. Tese (Doutorado em Física Ambiental) -Universidade Federal de Mato Grosso, Cuiabá, 2011.
SRIDHAR, V.; ELLIOTT, R. L. On the development of a simple downwelling longwave radiation scheme. Agricultural and Forest Meteorology, v. 112, n. 3/4, p. 237-243, 2002.