SOUTHERN BRAZIL
Ildegardis Bertol(1)*, Fabrício Tondello Barbosa(1), Camilo Bertol(2) and Rodrigo Vieira Luciano(3)
(1) Universidade do Estado de Santa Catarina, Departamento de Solos e Recursos Naturais, Lages, Santa Catarina, Brasil. (2) Empresa C&B Projetos, Santa Catarina, Brasil.
(3) Universidade do Estado de Santa Catarina, Departamento de Solos e Recursos Naturais, Programa de Pós-graduação em Ciência
do Solo, Lages, Santa Catarina, Brasil. * Corresponding author.
E-mail: [email protected]
ABSTRACT
Infiltration is the passage of water through the soil surface, influenced by the soil type and cultivation and by the soil roughness, surface cover and water content. Infiltration absorbs most of the rainwater and is therefore crucial for planning mechanical conservation practices to manage runoff. This study determined water infiltration in two soil types under different types of management and cultivation, with simulated rainfall of varying intensity and duration applied at different times, and to adjust the empirical model of Horton to the infiltration data. The study was conducted in southern Brazil, on Dystric Nitisol (Nitossolo Bruno aluminoférrico húmico) and Humic Cambisol (Cambissolo Húmico alumínico léptico) soils to assess the following situations: simulated rains on the Nitisol from 2001 to 2012 in 31 treatments, differing in crop type, sowing direction, type of soil opener on the seeder, amount and type of crop residue and amount of liquid swine manure applied; on the Cambisol, rains were simlated from 2006 to 2012 and 18 treatments were evaluated, differing in crop, seeding direction and crop residue type. The constant of the water infiltration rate into the soil varies significantly with the soil type (30.2 mm h-1 in the Nitisol and 6.6 mm h-1 in the Cambisol), regardless of the management system, application time and rain intensity and duration. At the end of rainfalls, soil-water infiltration varies significantly with the management system, with the timing of application and rain intensity and duration, with values ranging from 13 to 59 mm h-1, in the two studied soils. The characteristics of the sowing operation in terms of relief, crop type and amount and type of crop residue influenced soil water infiltration: in the Nitisol, the values of contour and downhill seeding vary between
INTRODUCTION
Data of water infiltration into soil under no-tillage, under continuous management or truncated by some operation of mechanical tillage, in long-term
field experimentation, are unprecedented in Brazil. On the other hand, the duration of experiments of this nature is critical for the scientific importance
to the data, regardless of statistical analysis. Water
infiltration into the soil is characterized by the water passage through the surface and can be expressed
as rate and capacity (Philip, 1957; Silveira et al.,
1993; Libardi, 1995). The infiltration rate is the
amount of water passing through the unit area of
soil surface per unit of time, while the infiltration capacity refers to the constant final value of the
water input rate into the soil (Libardi, 1995). This hydrological process is of paramount importance in planning hydraulic structures for runoff management to control water erosion. Based on data of a constant
water infiltration rate into the soil it is possible to estimate the (maximum) constant rate of runoff
and plan hydraulic and drainage structures, while with data of leakage volume we can estimate the
runoff volume and dimension the size of structures for surface water storage, for example. The main
hydraulic structure for management of surface water in agricultural areas is the agricultural terrace.
Water infiltration is influenced by the soil type
(Horton, 1940; Philip, 1957; Schwab et al., 1981), tillage and management (Leite et al., 2004; Bertol et al., 2006, 2008; Panachuki et al., 2011), crop type (Leite et al., 2004; Luciano et al., 2009; Bertol et al., 2013), surface roughness and cover by crop residues (Burwell and Larson, 1969; Panachuki et al., 2006; Zoldan Junior et al., 2008; Ramos et al., 2014), and soil water content prior to rain (Luciano et al., 2009; Marioti et al., 2013).
In deep soil, it takes longer to stabilize water infiltration than in shallow soil, as is the case when a 27 and 43 mm h-1, respectively, with crop residues of corn, wheat and soybean while in the Cambisol, the variation is between 2 and 36 mm h-1, respectively, in soybean and corn crops. The Horton model fits the values of water infiltration rate into the soil, resulting in the equation i = 30.2 + (68.2 - 30.2) e-0.0371t (R2 = 0.94**) for the Nitisol and i = 6.6 + (64.5 - 6.6) e-0.0537t (R2 = 0.99**) for the Cambisol.
Keywords: constant infiltration, basic infiltration, infiltration modeling, simulated rainfall.
RESUMO: INFILTRAÇÃO DE ÁGUA EM DOIS SOLOS CULTIVADOS NO SUL DO BRASIL A infiltração é a passagem da água por meio da superfície do solo, influenciada pelo tipo de solo e cultivo, pela rugosidade e cobertura superficial e pelo teor de água no solo; ela consome a maior parte da água da chuva e, por isso, é fundamental para o planejamento de práticas conservacionistas de caráter mecânico com o fim de manejar o escoamento superficial. Os objetivos deste trabalho foram determinar a infiltração de água em dois tipos de solo cultivados por meio de diversos tipos de manejo e cultivo, mediante chuvas simuladas com intensidade e duração variadas aplicadas em diferentes épocas, e ajustar o modelo empírico de Horton aos dados de infiltração. Realizou-se este estudo no sul do Brasil, sobre os solos Nitossolo Bruno aluminoférrico húmico e Cambissolo Húmico alumínico léptico, para avaliar as seguintes situações: no Nitossolo, foram realizadas chuvas simuladas entre 2001 e 2012 e avaliados 31 tratamentos, diferentes em termos de tipo de cultura, direção da semeadura, tipo de haste na máquina semeadora, quantidade e tipo de resíduo cultural e quantidade de dejeto líquido de suínos aplicado; no Cambissolo, foram efetuadas chuvas simuladas entre 2006 e 2012 e avaliados 18 tratamentos, diferentes em termos de tipo de cultura, direção da semeadura e tipo resíduo cultural. O valor constante da taxa de infiltração de água no solo variou expressivamente com o tipo de solo, sendo 30,2 mm h-1 no Nitossolo e 6,6 mm h-1 no Cambissolo, independentemente do sistema de manejo, da época de aplicação e da intensidade e duração da chuva. A infiltração de água no solo ao final da chuva modificou expressivamente com o sistema de manejo, com a época de aplicação e com a intensidade e duração da chuva, cujos valores variaram entre 13 e 59 mm h-1, incluindo os dois solos estudados. A orientação da operação de semeadura em relação ao relevo, o tipo de cultura e a quantidade e o tipo de resíduo cultural influenciou a infiltração de água no solo, pois, no Nitossolo, os valores variaram entre 27 e 43 mm h-1 na semeadura em contorno e na direção do declive, respectivamente, com resíduos culturais de milho, trigo e soja, enquanto, no Cambissolo, a variação foi respectivamente entre 2 e 36 mm h-1 nos cultivos de soja e milho. O modelo de Horton ajustou-se aos valores de taxa de infiltração de água no solo, resultando na equação i = 30,2 + (68,2 - 30,2) e-0,0371t (R2 = 0,94**),
para o Nitossolo; e i = 6,6 + (64,5 - 6,6) e-0,0537t (R2 = 0,99**), para o Cambissolo.
well-drained is compared with a poorly drained soil,
while infiltration is faster and stabilizes sooner in sandy
than in clayey soils (Horton, 1940; Philip, 1957). Soil
tillage with a chisel plow increases water infiltration
and the rate may take longer to become constant than in soil without tillage for a long time (Prando et al., 2010; Panachuki et al., 2011; Ramos et al., 2014). On the other hand, the absence of vegetation cover after
tillage exposes the soil to particle disintegration by rain
energy. There may be surface sealing and reduction
of water infiltration, which stabilizes sooner than in
covered and untilled soil (Panachuki et al., 2011). The occurrence of more frequent rains maintains the
water content of the soil higher, and thus, infiltration decreases and stabilizes sooner than where rainfalls
occur less often (Zonta et al., 2012).
Analyzing a Cambisol, Luciano (2008) determined the soil water infiltration rate ranging from 10 to
49 mm h-1 after rainfalls with intensity ranging from
58 to 87 mm h-1, under several cultivation systems in
two modes of no-tillage, evaluated at various times during the crop cycles. In the same soil, Mariotti
(2012) observed values between 2 and 36 mm h-1 for
this variable after rains between 63 and 75 mm h-1,
also under different no-tillage cultivation systems, evaluated at different times during the crop cycles. In
a Nitisol, Barbosa (2011) observed water infiltration
rates between 27 and 43 mm h-1 after rainfalls with
an intensity between 67 and 71 mm h-1, applied on
residues of diverse crops in two forms of no-tillage. In these studies, the rains were applied with a rainfall simulator with rotating arms (Swanson, 1965). Panachuki et al. (2011), studying a Latosol in no-tillage, conventional tillage and reduced tillage, obtained
infiltration rates between 24 and 52 mm h-1 after rains
with intensity between 59 and 62 mm h-1, applied with
a micro simulator on three doses of soybean residues.
These differences in infiltration rates demonstrate the influence of the intrinsic characteristics of each soil type.
The water infiltration rate into the soil can also
vary with cropping systems and management, which
influence the characteristics of soil surface and
subsurface (Portela et al., 2011; Amaral et al., 2013).
Variations in water infiltration rate after rains were
stated at different times during the cycle of corn and beans cultivated in sequence, with values between
49 and 63 mm h-1 (Leite, 2003), and soybean between
36 and 54 mm h-1 (Engel, 2005). These studies were
carried out on a Nitisol in southern Brazil.
This study aimed to estimate the water infiltration
rate into the soil after rains, in two soil types and cultivation methods in a no-tillage system, applying simulated rainfalls with different intensity and duration at different times. Additionally, the goal was to adjust the empirical model of Horton to the
data of water infiltration in the two soil types.
MATERIAL AND METHODS
Location of the experiments and soil characterization
One of the experiments was carried out
on a clayey Dystric Nitisol (Nitossolo Bruno aluminoférrico húmico), between November 2001
Table 1. Physical properties of the Nitisol and the Cambisol in horizons/layers of the soil profiles described respectively in 2000 and 2006, at the sites of the experiments
Horizon Layer Bd Ma Mi Pt MWD TOC Clay Silt Sand
cm kg dm-3 cm3 cm-3 mm g kg-1 %
Nitisol
A1 0-12 1.05 0.13 0.44 0.57 5.63 34 64 24 12
A2 12-26 1.07 0.26 0.33 0.59 5.00 30 69 21 10
AB 26-46 1.09 0.24 0.32 0.56 4.25 28 72 18 10
Bt1 46-74 1.03 0.13 0.46 0.59 2.17 18 78 14 8
Bt2 74-126 1.11 0.12 0.46 0.57 1.96 12 63 29 8
BC/Cr 123-137+ 0.97 0.16 0.45 0.61 1.43 9 51 38 11
Cambisol
A1 0-12 1.30 0.09 0.38 0.47 6.04 27 24 47 29
A2 12-28 1.35 0.06 0.42 0.48 6.01 23 26 46 28
AB 28-50 1.33 0.06 0.40 0.46 4.86 12 26 43 31
Bi 50-66 1.28 0.04 0.42 0.46 2.08 18 29 42 29
C1 66-80/85 1.27 0.03 0.48 0.51 1.45 13 33 43 24
Cr 80 -85+ 1.19 0.01 0.49 0.50 1.19 1 29 67 4
and August 2012 (27° 43’ S; 50° 31’ W; 846 m asl).
The other experiment was conducted on a silty
clay loam Humic Cambisol (Cambissolo Húmico alumínico léptico), between August 2006 and April 2011 (27º 46 ‘S; 50º 18’ W; 900 m asl). The soil
properties are listed in table 1, classified according
to IUSS/WRB (2006).
History of the experimental area on Nitisol, from 2000 to 2013
In March 2000, the soil was limed (11 t ha-1
limestone) and fertilized (300 kg ha-1 of 5-30-15 of
N-P2O5-K2O). The inputs were incorporated into the
soil by plowing twice and harrowing thrice. From then on the soil was cultivated under no-tillage, with
the exception of 2006, when the soil was chiseled in
January. In April, Mello (2002) sowed black oats (Avena strigosa), which were cut in September and in
November, soybean (Glycine max) was sown. Three
simulated rain tests were applied during the cycle and the crop was harvested in April, 2001.
Before soybean harvest, Leite (2003) sowed
common vetch (Vicia sativa), which was cut in
October 2001, and on the residue, corn (Zea mays)
was sown in November of the same year. During the corn cycle, three simulated rainfall tests were applied, and in June 2002, oats were sown before corn harvest. In November of that year, oats were cut
and immediately black beans (Phaseolus vulgaris)
were sown. During the bean cycle, three simulated rainfall tests were applied, and in April 2003 the crop was harvested.
Engel (2005) sowed forage radish (Raphanus
raphanistrum) immediately before the black bean
harvest in April 2003. Forage radish was cut in October of the same year, and in November soybean
was sown. During the soybean cycle, five simulated
rainfall tests were applied, and in March 2004 the crop was harvested.
Before soybean harvest, vetch was sown in March 2004, which was cut in October, and in November of that year corn was sown. Before harvest, oats were sown in May 2005 and then corn was harvested. The oats were cut in November and, in January 2006, the crop residues were removed from the soil surface. Immediately after that, the soil was chiseled and
then five tests of simulated rainfall were applied
between January and February. In March, tillage was performed with one plowing and two diskings
and 5 t ha-1 of lime was applied and, in April, black
oats were sown, which were cut in October. Then, corn was sown and harvested in May 2007.
In June 2007, Amaral (2010) sowed wheat that was cut in December when, again, corn was sown which was harvested in May 2008. Immediately before harvesting corn, black oats were sown and cut in November and, on the residue, in December, a test of simulated rain was applied. Later that
month, corn was sown, which was harvested in April 2009, and a test of simulated rain was applied on the residue.
In May 2009, Barbosa (2011) sowed black oats intercropped with common vetch, in October of the same year he sowed corn and applied a test of simulated rainfall on the residues, in June 2010. In July of the same year wheat was sown. In November, the crop was harvested and on the residue, the author applied a simulated rain test in December 2010. Later that month the author sowed soybean, which was harvested in April 2011 and in May, a rainfall test was simulated.
In May 2011, Mecabô Junior (2013) sowed forage radish, which was cut in November of the same year, and then planted red beans, which were harvested in February 2012. Then corn was cultivated and during the cycle four simulated rain tests were applied. In April 2013, black oats were sown and then corn was harvested.
History of the experimental area on Cambisol, from 2006 and 2012
In March 2006, the area was limed (15 t ha-1
limestone), incorporated by plowing twice and harrowing twice. Thereafter, the soil was cultivated
in no-tillage, with exception of 2008 when, in April,
the soil was plowed once and harrowed twice. In July 2006, Barbosa (2008) and Luciano (2008) sowed black oats and common vetch, which were cut in November 2006 by hand. During these crop cycles,
five tests of simulated rainfall were applied.
In December 2006, black beans were sown, harvested in April 2007 and then vetch was sown and cut in November of the same year. Subsequently, black beans were planted again and harvested in April 2008 and after that, the soil was prepared by plowing once and harrowing twice. Then vetch was sown, which was managed in November of the same year and, subsequently, black beans were sown and harvested
in April 2009. In that month, a mixture of vetch and
black oats was sown, which was cut in October 2009. In December 2009, Bertol et al. (2013) sowed corn, soybean and black beans and a corn - bean intercropping system and during the cycle they applied four simulated rain tests. After harvest, between March and May 2010, wheat was sown in June and harvested it in November.
In November 2010, Marioti (2012) sowed corn and soybean and applied four tests of simulated rainfall during the cycle and, between April and May 2011, the crops were harvested.
In May 2011, Ramos (2012) sowed annual
ryegrass (Lolium multiflorum) and common
Treatments on the Nitisol
The treatments, in two replications, were subjected to simulated rainfalls with variable intensity and intervals in between, and constant intensity throughout the rainfalls: T1: corn (CC); T2:
black beans (CB); T3: soybean (CS); T4: 8 t ha-1 corn
residue, furrows opened with a disc seeder (CR-8D);
T5: corn residue (4 t ha-1) in furrows opened with a
disc seeder (CR-4D); T6: corn residue (2 t ha-1), in
furrows opened with a disc seeder (CR-2D); T7: corn
residue (8 t ha-1), in furrows opened with a disc-drill
seeder (CR-8D/H); T8: corn residue (4 t ha-1), in
furrows opened with a disc-drill seeder (CR-4D/H);
T9: corn residue (2 t ha-1), in furrows opened with a
disc-drill seeder (CR-2D/H); T10: black oat residue
(5.3 t ha-1), in furrows opened with a disc seeder
(RO-5.3D); T11: black oat residue (2.6 t ha-1), in
furrows opened with a disc seeder (RO-2.6D); T12:
black oat residue (1.3 t ha-1), in furrows opened
with a disc seeder (RO-1.3D); T13: black oat residue
(5.3 t ha-1), in furrows opened with a disc-drill seeder
(RO-5.3D/H); T14: black oat residue (2.6 t ha-1), in
furrows opened with a disc-drill seeder (RO-2.6D/H);
T15: black oat residue (1.3 t ha-1), in furrows opened
with a disc-drill seeder (RO-1.3D/H); T16: corn residue
(9.6 t ha-1), in furrows along the contour line with a by
disc seeder (CR9.6D/C); T17: corn residue (4.8 t ha-1),
in furrows along the contour lines with a disc seeder
(CR4.8D/C); T18: corn residue, 9.6 t ha-1, downslope
furrows opened with a disc seeder (CR9.6D/P); T19:
corn residue, 4.8 t ha-1, downslope furrows opened
with a disc seeder (CR4.8D/P); T20: wheat residue,
3.6 t ha-1, furrows along the contour lines with a
disc-drill seeder (WR3.6DH/C); T21: wheat residue,
1.8 t ha-1, furrows along the contour lines with a
disc-drill seeder (WR1.8DH/C); T22: wheat residue,
3.6 t ha-1, downslope furrows opened with a disc-drill
seeder (WR3.6DH/P); T23: wheat residue, 1.8 t ha-1,
downslope furrows opened with a disc-drill seeder
(WR1.8DH/P); T24: soybean residue, 3.6 t ha-1,
furrows along the contour lines with a disc seeder
(SR3.6D/C); T25: soybean residue, 1.8 t ha-1, furrows
along the contour lines with a disc seeder (SR1.8D/C);
T26: soybean residue, 3.6 t ha-1, downslope furrows
opened with a disc seeder (SR3.6D/P); T27: soybean
residue, 1.8 t ha-1, downslope furrows opened with
a disc seeder (SR1.8D/P); oat cultivation in no-tillage system with a single application of liquid
swine manure: T28: 0 m3 ha-1; T29: 50 m3 h-1;
T30: 100 m3 h-1; T31: 200 m3 ha-1.
Operational scheme of treatments on the Nitisol
In the treatments T1, T2 and T3, the crops were sown with a “saraquá” or “matraca” (rattle seeder), according to the recommended plant density for each one, without prior tillage. Throughout the crop cycles, three simulated rainfall tests were applied
in T1 and T2 and five tests in T3. In the treatments
T4 to T27, the residues were chopped and evenly
distributed on the soil surface. The surface was furrowed with a no-tillage machine, without seeds
and fertilizers, operating downhill in T4 to T15,
while in treatments T16 to T27, the operation was
performed as specified for the treatments. Sowing
was always performed immediately before rain application. In these treatments a single simulated rainfall test was applied. In treatments T28 to T31, oat seed was broadcast immediately before corn harvest, without soil tillage, so the corn residues remained on the soil during the oat cycle. Throughout the crop cycle, four simulated rainfall tests were applied.
Treatments on the Cambisol
The treatments, with two replications, were subjected to simulated rainfall, with varied intensity and intervals and with constant intensity during rainfall. T1: oat sown along the contour lines (OC); T2: oat cultivation downhill (OD); T3: oat sown by broadcasting (OT); T4: vetch cultivation along the contour lines (VC); T5: vetch cultivation downhill (VD); T6: vetch sown by broadcasting (VT); T7: corn cultivation along the contour lines (CC7); T8: soybean cultivation along the contour lines (SC8); T9: bean cultivation along the contour lines (BC); T10: cultivation of corn and beans intercropped along the contour lines (C/BIC); T11: soybean cultivation downhill (SD); T12: soybean cultivation along the contour lines (SC12); T13: corn cultivation downhill (CD): T14: corn cultivation along the contour lines (CC14); T15 ryegrass residue (RR); T16: vetch residue (VR); T17: chiseled soil with ryegrass roots (SRR); T18: chiseled soil with vetch roots (SRV).
Operational scheme of the treatments on the Cambisol
In treatments T1 to T6, the oat and vetch sown downhill and along the contour lines, were sown with
a no-tillage machine, with seeds and fertilizers, while by broadcasting, sowing and fertilization were done
manually with lightweight incorporation through
harrow. Throughout the crop cycle, five simulated
Experimental plots and rainfall simulators
The 3.5 × 11 m plots were delimited on the sides
and upper end by galvanized sheets and at the lower
end by a runoff gutter, which was connected to a PVC
pipeline, channeling the flow to a trench located 6 m
below the bottom end of the plot. To simulate rain, a simulator with rotating arms was used, which was installed between two plots, 3.5 m apart from each
other, covering both. In the experiments on the Nitisol
we used the Swanson type simulator (Swanson,
1965), while on the Cambisol, a pressurized rainfall
simulator (Bertol et al., 2012).
Measurements before, during and after rainfall application
Before simulating rainfall, soil samples were collected with a Dutch auger from the 0-10 and 10-20 cm layers to determine the water content, and the results were obtained on a gravimetric basis, according to Forsythe (1975). After initiation of runoff and throughout its duration, runoff samples were taken every 5 min over a certain period of time, measured by a stopwatch, using a measuring cylinder or a measuring bucket, as needed. With these data, the instantaneous runoff rate was
calculated and extrapolated to the time of 1 min. At
the end of the rain, the water volume collected in 20 rain gauges placed on the soil in the area covered
by the rain around the experimental plots was used to calculate the rain rate. The water infiltration rate
into the soil at the end of the rain was calculated as the difference between the precipitation rate and
runoff rate at the end of the rain. Coefficient values of water infiltration into the soil at the end of the rain were calculated by dividing the infiltration rate
at the end of the rain by the rain rate.
Data treatment
The study was conducted with one field replication (two experimental units per treatment). Despite the field replication, the authors decided not to conduct
conventional statistical analysis for comparison of means. Statistical analysis for some basic parameters was carried out, to support the discussion of the results.
The data used had been obtained since 2001 on the Nitisol and since 2006 on the Cambisol, published in dissertations and theses (Leite, 2003; Engel, 2005; Barbosa, 2008; Luciano, 2008; Amaral, 2010; Barbosa, 2011; Marioti, 2012; Ramos, 2012; Mecabô Junior, 2013) and by Bertol et al. (2013). The
data of water infiltration into the soil (unpublished)
were calculated as the difference between the data of the applied rainfall rate and the constant runoff rate (published), and are included in the database of the Department of Management and Conservation of the Soil - CAV/UDESC, under the leadership of Professor Ildegardis Bertol.
The data of water infiltration rate into the soil,
obtained in 12 simulated rainfall events on Nitisol
and in 16 rainfall events on Cambisol, were fit to
the model of Horton (Horton, 1940):
i = if + (ii - if) e-C t Eq. 1
where i = estimated infiltration rate, mm h-1;
ii = infiltration rate observed at the beginning of the
rain, mm h-1; i
f = infiltration rate observed at the
end of the rain, mm h-1; t = rain duration, min; and
C = adjustment parameter.
The rains were selected for the following criteria: equal duration (90 min); little variation in intensity; little variation in soil water content prior to rainfall;
and reaching a value of water infiltration into the
soil at the end of the rain that can be considered as
basic infiltration rate for each of the studied soils.
The Horton model (Horton, 1940) was chosen from
among the other empirical models as the best-fitting to the point data of water infiltration into the soil
and for producing the best estimate of values of this
variable, according to Paixão et al. (2009).
RESULTS AND DISCUSSION
Data obtained on the Nitisol
The data in table 2 indicate that the water content in the soil prior to rainfall simulation (WSB)
varied little (0.24-0.31 kg kg-1 in the 0-10 cm layer
and 0.22-0 30 kg kg-1 in the 10-20 cm layer), i.e., a
variation of 41 % in the average of both layers. This
possibly had little influence on water infiltration
into the soil at the end of the rain (WIE). The WIE
varied between 36 and 69 mm h-1, equivalent to
92 %, indicating that other variables such as crop
type and growth stage had more influence on WIE than on WSB. In the experiment on soybean, the infiltration coefficient was 0.67, while the average of experiments with corn and beans was 0.86, in
the mean of the rainfalls throughout the crop cycle.
The lowest coefficient of infiltration in soybean can be explained: the crop was the third to be assessed in the experiments, when the soil had become more
compacted than in the previous years, as stated by Leite (2003) and Engel (2005). The variation in intensity and duration between one rain test and another also influenced WIE. Furthermore, the
interception of water by plant shoots influenced the
time the rainwater reached at the soil surface and the
plant roots influenced the time until water infiltration
decreased, as argued by Leite (2003) and Engel (2005)
in the same experiment.
The WIE was 21 and 23 % lower in soybean than in beans and corn, respectively, while the rain intensity was almost equal in all three crops, in the mean of
in soybean, a moistening simulated rain had been applied 24 h before the rainfall test, which was not
sufficient to increase the water content in the soil
before the rains in this crop in relation to the others.
As a result, the average WIE values in the first four
tests of rain in soybean (41 mm h-1) approached the
basic water infiltration rate in the Nitisol, which
would certainly not have been achieved in the rainfall tests applied to corn and beans.
The data in table 3 indicate that some WSB
values varied little in the experiments carried
out on Nitisol (0.31-0.43 kg kg-1 in the 0-10 cm
layer and 0.32-0.47 kg kg-1 in the 10-20 cm layer),
equivalent to 52 % for both layers. The WIE, on
the other hand, varied between 24 and 62 mm h-1,
i.e., equivalent to an increase of 2.6 times for the
different conditions studied. The coefficient of water infiltration into the soil was 0.37 in the treatment
using a disc seeder on oat residue and 0.59 with a disc-drill seeder on the same residue, while, on corn
residue, the coefficient was 0.45 without drilling
and 0.77 with the disc-drill seeder. It was found that the duration of the simulated rains, the time
of the experiments, and especially the amount and
type of crop residues and soil plowing mechanism
of the seeder influenced WIE more than WSB.
Moreover, two important properties of the soil surface, i.e., surface roughness and soil cover by
crop residues, influenced this variable, as argued by Amaral (2010) in the same experiment.
The sowing performed with disc-drill soil-openers increased WIE, in oat as much as in corn residues (Table 3). Under oat, the increase reached 59 % and under corn 73 %, in the mean of the residues, although the rainfall intensity on each sowing form and residue type was equal. The WIE
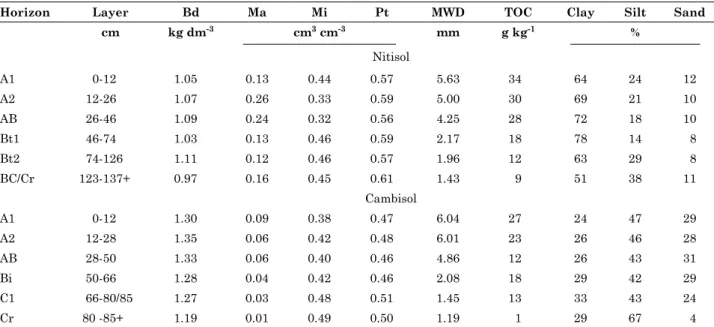
Infiltration rate, intensity and duration of the rain
Rain Inf. C(3) Rain Inf. B(4) Rain Inf. S(5) Rain(6)
N° mm h-1 min mm h-1 min mm h-1
1 52 57 90 50 67 60 45 66
2 49 59 70 54 67 90 36 68
3 69 71 135 63 72 90 38 63
4 - - - 46 65
5 - - - 54 67
Mean 57 62 98 56 69 80 44 66
SD(7) 9 6 27 5 2 14 6 2
(1) Data from Leite (2003); (2) Data from Engel (2005); (3) Inf C: water infiltration into soil in corn; (4) Inf B: water infiltration into soil
in beans; (5) Inf S: water infiltration into soil in soybean; (6) Rain applied 24 h after a moistening rain to standardize the soil water
content; (7) SD: Standard Deviation. (-): Not evaluated.
Table 2. Water content in two soil layers before simulated rainfall, water infiltration rate at the end of the rain and rainfall intensity of varying duration during the corn and bean cycles and of 60 min in soybean, in a Nitisol (average of two replications)
Rainfall Soil water content
0-10 cm 10-20 cm Average
Date kg kg-1
Corn cultivation(1)
1 (11/27/2001) 0.30 0.30 0.30
2 (01/11/2002) 0.30 0.29 0.30
3 (03/09/2002) 0.30 0.22 0.21
Bean cultivation(1)
1 (11/20/2002) 0.31 0.30 0.31
2 (12/19/2002) 0.26 0.26 0.26
3 (01/22/2003) 0.22 0.23 0.23
Soybean cultivation(2)
1 (11/12/2003) 0.26 0.26 0.26
2 (12/13/2003) 0.26 0.26 0.26
3 (01/12/2004) 0.24 0.26 0.25
4 (02/13/2004) 0.24 0.26 0.25
resulting from the average of oat and corn residue
in the treatments with a disc seeder (30 mm h-1)
can reach the basic water infiltration rate in the
Nitisol, while the values obtained with rainfall applied to the treatments with a disc-drill seeder
both in oats (43 mm h-1) and in corn (57 mm h-1)
did not reach the basic infiltration rate.
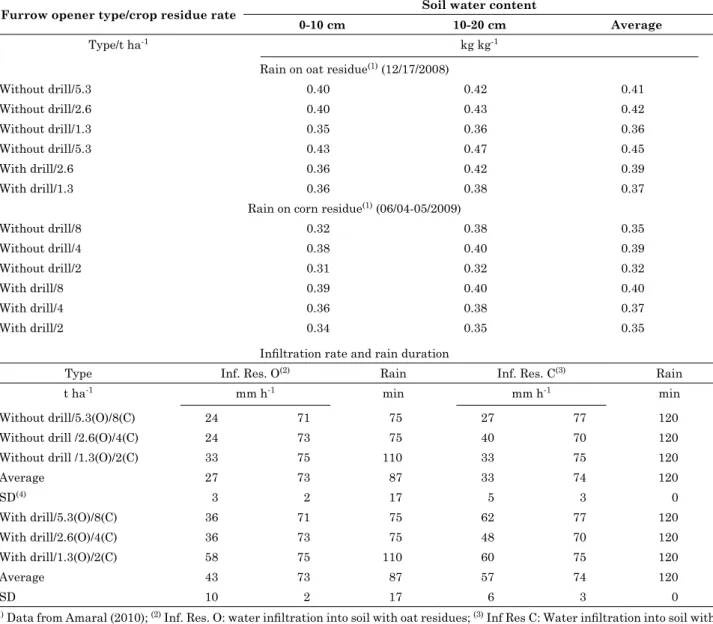
Table 4 shows less variation in WSB and greater
variation in WIE data (0.26-0.31 kg kg-1 in the
0-10 cm layer and 0.28-0.30 kg kg-1 in the 10-20 cm
layer), equivalent to 19 % for both layers in WSB,
while WIE ranged between 27 and 49 mm h-1,
equivalent to 81 %. The water infiltration rate into
the soil varied little (from 0.47 in corn residue with contour sowing to 0.44 on the same residue sown downhill). This value was 0.57 for wheat residue
with contour sowing and 0.51 for the same residue sown downhill, but 0.49 for soybean residue with contour sowing and 0.49 for the same residue sown downhill. In this study, the type and amount of waste, sowing direction, and timing of rainfall application influenced this variable. The soil
physical properties had no influence, while the soil cover by crop residues had little influence, as argued by Barbosa (2011) in the same experiment.
Contour sowing increased IAF by 7, 15 and 3 %, compared to downhill sowing, on corn, wheat and soybean residues, respectively, in the mean of the residue rates, where the rain intensity was practically the same (Table 4). In all cases, WIE was
low, except in the contour sowing treatment with
application of 9.6 t ha-1 wheat residue (43 mm h-1),
Table 3. Water content in two soil layers before simulated rainfall, water infiltration rate at the end of the rain and rainfall intensity of varying duration, on oat and corn residue, in a Nitisol (average of two replications)
Furrow opener type/crop residue rate Soil water content
0-10 cm 10-20 cm Average
Type/t ha-1 kg kg-1
Rain on oat residue(1) (12/17/2008)
Without drill/5.3 0.40 0.42 0.41
Without drill/2.6 0.40 0.43 0.42
Without drill/1.3 0.35 0.36 0.36
Without drill/5.3 0.43 0.47 0.45
With drill/2.6 0.36 0.42 0.39
With drill/1.3 0.36 0.38 0.37
Rain on corn residue(1) (06/04-05/2009)
Without drill/8 0.32 0.38 0.35
Without drill/4 0.38 0.40 0.39
Without drill/2 0.31 0.32 0.32
With drill/8 0.39 0.40 0.40
With drill/4 0.36 0.38 0.37
With drill/2 0.34 0.35 0.35
Infiltration rate and rain duration
Type Inf. Res. O(2) Rain Inf. Res. C(3) Rain
t ha-1 mm h-1 min mm h-1 min
Without drill/5.3(O)/8(C) 24 71 75 27 77 120
Without drill /2.6(O)/4(C) 24 73 75 40 70 120
Without drill /1.3(O)/2(C) 33 75 110 33 75 120
Average 27 73 87 33 74 120
SD(4) 3 2 17 5 3 0
With drill/5.3(O)/8(C) 36 71 75 62 77 120
With drill/2.6(O)/4(C) 36 73 75 48 70 120
With drill/1.3(O)/2(C) 58 75 110 60 75 120
Average 43 73 87 57 74 120
SD 10 2 17 6 3 0
(1) Data from Amaral (2010); (2) Inf. Res. O: water infiltration into soil with oat residues; (3) Inf Res C: Water infiltration into soil with
resulting in an average of 34 mm h-1, which can be
considered equivalent to the basic water infiltration
rate for the Nitisol.
The data in table 5 show that WSB and WIE
varied widely (0.18-0.31 kg kg-1 in the 0-10 cm
layer, and 0.19-0.29 kg kg-1 in the 10-20 cm layer),
equivalent to 72 % for both layers for WSB and
between 13 and 53 mm h-1, equivalent to 4.1 times
for WIE. The water infiltration rate into the soil also
varied widely between treatments and between the evaluation times during the crop cycle. The value ranged from 0.44 to 0.67 in the rain test applied on May 5, 2012, from 0.31 to 0.69 in the test applied on May 26, from 0.18 to 0.34 in the test applied on June 20 and from 0.46 to 0.84 in the rainfall test of August 25 of that same year. Thus, the time of
application of the rains influenced this variable as
well as the rainfall intensity and pig slurry rate, as argued by Mecabô Junior (2013), in a study carried
out in the same experimental area.
The WIE value in rainfall test 1 (27 mm h-1), test
2 (19 mm h-1) and test 4 (29 mm h-1) was lowest at
a pig slurry rate of 100 m3 h-1, while in test 3, the
value was lowest (31 mm h-1) when no pig slurry
was applied (Table 5). According to the IAF data calculated from the studies of Leite (2003), Engel (2005), Amaral (2010), and Barbosa (2011) for this same soil, these values as well as some others in the rain tests 2 and 3, calculated based on Mecabô Junior (2013), can be equivalent to the basic water
infiltration rate for the Nitisol.
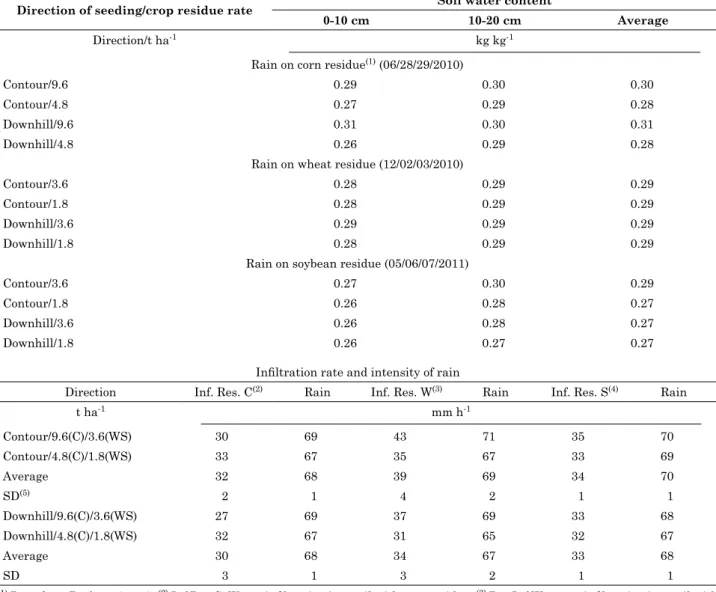
Table 4. Water content in two soil layers before simulated rainfall, water infiltration into soil at the end of the rain and rainfall intensity lasting 90 min, over residue of corn, wheat and soybean, in a Nitisol (average of two replications)
Direction of seeding/crop residue rate Soil water content
0-10 cm 10-20 cm Average
Direction/t ha-1 kg kg-1
Rain on corn residue(1) (06/28/29/2010)
Contour/9.6 0.29 0.30 0.30
Contour/4.8 0.27 0.29 0.28
Downhill/9.6 0.31 0.30 0.31
Downhill/4.8 0.26 0.29 0.28
Rain on wheat residue (12/02/03/2010)
Contour/3.6 0.28 0.29 0.29
Contour/1.8 0.28 0.29 0.29
Downhill/3.6 0.29 0.29 0.29
Downhill/1.8 0.28 0.29 0.29
Rain on soybean residue (05/06/07/2011)
Contour/3.6 0.27 0.30 0.29
Contour/1.8 0.26 0.28 0.27
Downhill/3.6 0.26 0.28 0.27
Downhill/1.8 0.26 0.27 0.27
Infiltration rate and intensity of rain
Direction Inf. Res. C(2) Rain Inf. Res. W(3) Rain Inf. Res. S(4) Rain
t ha-1 mm h-1
Contour/9.6(C)/3.6(WS) 30 69 43 71 35 70
Contour/4.8(C)/1.8(WS) 33 67 35 67 33 69
Average 32 68 39 69 34 70
SD(5) 2 1 4 2 1 1
Downhill/9.6(C)/3.6(WS) 27 69 37 69 33 68
Downhill/4.8(C)/1.8(WS) 32 67 31 65 32 67
Average 30 68 34 67 33 68
SD 3 1 3 2 1 1
(1) Data from Barbosa (2011); (2) Inf Res C: Water infiltration into soil with corn residue; (3) Res Inf W: water infiltration into soil with
wheat residue; (4) Res Inf S: water infiltration into soil with soybean residue; (5) SD: Standard Deviation. C: Corn residue; W: Wheat
Data obtained on the Cambisol
The data of table 6 show that the water content of the soil prior to the applied rains (WSB) varied
little (0.27-0.36 kg kg-1 in the 0-10 cm layer and
0.29-0.39 kg kg-1 in the 10-20 cm layer), 44 % for
both layers. This exerted little influence on water
infiltration into the soil at the end of the rain
(WIE). The WIE ranged between 10 and 49 mm h-1,
increasing 4.9-fold, indicating that other variables such as crop type and growth stage and the form
of sowing influenced WIE more than WSB. In oat sown downhill, the coefficient of infiltration was
0.31, 0.40 along the contour and 0.54 by manual
broadcasting; for vetch sown downhill, the coefficient
was 0.35, along the contour 0.54 and by manual broadcasting 0.49, in the mean of applied rains. The
lower coefficient of infiltration in downhill sowing compared to contour sowing can be explained as
follows: the marks of the seeder, along the contour, stored more water and for a longer time, decreasing
the flow, as shown by Barbosa (2008) and Luciano (2008). The lower coefficient of infiltration observed
in vetch was due to a lower production of biomass,
which influenced mainly the interception of water
by the shoots.
Contour sowing increased WIE by 35 and 65 %, compared to downhill sowing for oat and vetch, respectively, in the mean of the simulated rainfall
Table 5. Water content in two soil layers before simulated rainfall, water infiltration into the soil at the end of the rain and rainfall intensity lasting 75 min in oat cultivation under four rates of pig slurry, in a Nitisol (average of two replications)
Rate of slurry Soil water content(1)
0-10 cm 10-20 cm Average
m3 ha-1 kg kg-1
Rainfall test 1 (05/05/2012)
200 0.27 0.26 0.27
100 0.27 0.28 0.28
50 0.27 0.27 0.27
0 0.25 0.26 0.26
Rainfall test 2 (05/26/2012)
200 0.27 0.27 0.27
100 0.28 0.28 0.28
50 0.31 0.25 0.28
0 0.26 0.26 0.26
Rainfall test 3 (06/20/2012)
200 0.27 0.28 0.28
100 0.29 0.29 0.29
50 0.28 0.27 0.28
0 0.29 0.27 0.28
Rainfall test 4 (08/25/2012)
200 0.18 0.19 0.19
100 0.20 0.21 0.21
50 0.20 0.21 0.21
0 0.21 0.20 0.21
Infiltration rate and intensity of rain
Rate Inf. T1(2) Rain Inf. T2 Rain Inf. T3 Rain Inf. T4 Rain
m3 ha-1 mm h-1
200 43 64 42 61 21 72 52 63
100 27 61 19 62 16 71 29 63
50 41 61 28 62 24 71 53 63
0 35 64 23 61 13 72 48 63
Average 37 63 28 62 19 72 46 63
SD(3) 6 2 9 1 4 1 10 0
tests, while the variation of rainfall intensity
between tests was virtually zero (Table 6). In the
case of broadcast seeding by hand, WIE was 37 % higher in oat and 12 % lower in vetch, compared to the contour, with no variation in rain intensity
either. In most cases, WIE was high, except for some
values in oat downhill and in the contour that can
be considered close to the basic water infiltration
rate for the studied Cambisol.
The values in table 7 showed that WSB varied
(0.27-0.38 kg kg-1 in the 0-10 cm layer and
0.22-0.37 kg kg-1 in the 10-20 cm layer) 41 % in the
surface layer and 68 % in the lower layer, which can be considered a small variation. Thus, this
variation probably influenced WIE little. The WIE
ranged between 2 and 43 mm h-1, equivalent to
21.5 times, showing that other variables such as crop
type and growth stage influenced WIE more than WSB. In corn, the coefficient of infiltration was 0.38,
in soybean 0.34, in common bean 0.27 and in the
corn/bean intercrop, the coefficient was 0.29, in the mean of the rains applied. The lower infiltration rate in common bean can be explained: the morphological
characteristics of the roots of this crop, especially,
Table 6. Water content in two soil layers before simulated rainfall, water infiltration into soil at the end of the rain and rainfall intensity lasting 60 min for the oat and vetch cycles, in a Cambisol (average of two replications)
Rain Soil water content
(1)
0-10 cm 10-20 cm Average 0-10 cm 10-20 cm Average 0-10 cm 10-20 cm Average
Date kg kg-1
Oat downhill Oat contour Oat broadcast by hand
1 (08/04/2006) 0.31 0.32 0.32 0.30 0.31 0.31 0.27 0.30 0.29
2 (09/13/2006) 0.31 0.35 0.33 0.32 0.31 0.32 0.28 0.29 0.29
3 (10/17/2006) 0.33 0.32 0.33 0.32 0.31 0.32 0.34 0.29 0.32
4 (10/21/2006) 0.32 0.31 0.32 0.36 0.39 0.38 0.32 0.30 0.31
5 (11/24/2006) 0.34 0.35 0.35 0.33 0.36 0.35 0.31 0.30 0.31
Vetch downhill Vetch contou Vetch broadcast by hand
1 (08/04/2006) 0.35 0.35 0.35 0.33 0.36 0.35 0.31 0.30 0.31
2 (09/13/2006) 0.34 0.36 0.35 0.32 0.35 0.34 0.32 0.36 0.34
3 (10/17/2006) 0.32 0.37 0.35 0.29 0.30 0.30 0.32 0.32 0.32
4 (10/21/2006) 0.35 0.38 0.37 0.35 0.37 0.36 0.36 0.34 0.35
5 (11/24/2006) 0.32 0.34 0.33 0.33 0.36 0.35 0.31 0.33 0.32
Infiltration rate and intensity of rain
Rain Inf.(2) Rain Inf. Rain Inf. Rain
No mm h-1
Oat downhill Oat contour Oat broadcast by hand
1 19 63 29 58 46 69
2 15 67 30 77 32 68
3 35 63 40 70 49 70
4 19 63 23 66 32 66
5 10 68 12 67 25 72
Average 20 65 27 68 37 69
SD(3) 8 2 9 6 9 2
Vetch downhill Vetch contour Vetch broadcast by hand
1 29 67 46 76 33 68
2 30 76 46 84 40 87
3 27 76 46 79 41 80
4 21 72 38 76 38 75
5 22 78 41 81 36 81
Average 26 74 43 79 38 78
SD 4 4 3 3 3 6
contributed little to form soil galleries, making
infiltration more difficult than in the other crops,
as shown by data presented by Bertol et al. (2013). The smaller shoot mass production of common bean,
which mainly influenced rainwater interception,
contributed to this.
Corn increased WIE by 9 and 41 %, compared to soybean and common bean, respectively, in the mean of the rainfall tests, while the variation in rainfall intensity between tests was practically
zero (Table 7). In the corn/bean intercrop, the
increase in WIE in corn was 26 %, with no variation in rain intensity either. In most cases,
IAF was high, except for one value recorded
for beans (2 mm h-1), which was lower than the
water infiltration rate considered as basic for the studied Cambisol.
The data in table 8 showed that WSB varied
little (0.23-0.40 kg kg-1 in the 0-10 cm layer and
0.26-0.39 kg kg-1 in the 10-20 cm layer), representing
a variation of 74 % in the surface layer and 50 % in the lower layer, in other words, WSB had little influence on WIE. The IAF ranged between
2 and 36 mm h-1, equivalent to an 18-fold increase,
demonstrating that other variables such as type and growth stage of the crop and sowing direction
influenced WIE more than WSB. In soybean sown downhill, the infiltration coefficient was 0.06, while
in the contour, it was 0.15; in corn sown downhill,
the coefficient was 0.06, while in the contour it was
0.30, in the mean of the applied rains. The highest
coefficient of infiltration observed in corn sown in the contour can be explained: the furrows of the seeder,
along the contour lines, stored a larger volume of water and for a longer time compared to the other studied conditions, as observed by Luciano (2008), Marioti (2012) and Marioti et al. (2013), in studies
carried out in the same experimental area. The
lower biomass production in common bean shoots,
which mainly influenced rainwater interception,
contributed to this.
The corn planted in the contour increased WIE 5 times while soybean in the contour increased it by 2.5 times, compared to soybean downhill, in the mean of the simulated rainfall tests, while the variation in rainfall intensity between tests was
zero (Table 8). The furrows of the seeder, along the
contour lines, stored a larger volume of water and
for a long time, facilitating infiltration in comparison
to the downslope furrows which increased surface runoff, as observed by Luciano (2008) and Marioti (2012). The greater effect of corn than soybean was due to the morphological characteristics of the plants. Corn, with greater shoot mass, intercepted more rainwater and, with more root mass, enhanced
the infiltration, compared to soybean.
Table 9 showed that WSB varied (0.18-0.34 kg kg-1
in the 0-10 cm layer and 0.22-0.35 kg kg-1 in the
Table 7. Water content in two soil layers before simulated rainfall, water infiltration into soil at the end of the rain and rainfall intensity lasting 90 min for the cycles of corn, soybean, beans and corn/beans, in a Cambisol (average of two replications)
Rain Soil water content
(1)
0-10 10-20 Average 0-10 10-20 Average 0-10 10-20 Average 0-10 10-20 Average
cm cm cm cm
Corn Soybean Black beans Corn/black beans
Date kg kg-1
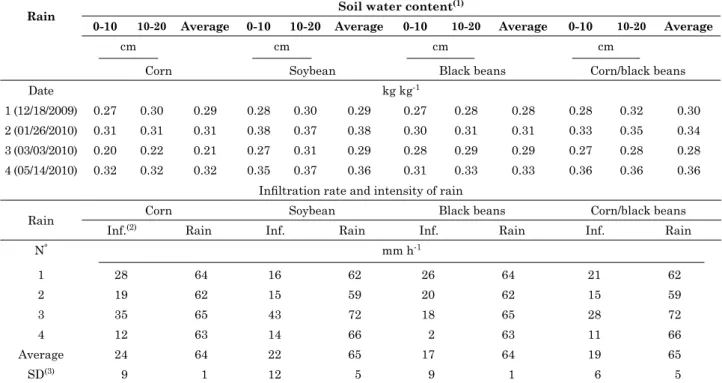
1 (12/18/2009) 0.27 0.30 0.29 0.28 0.30 0.29 0.27 0.28 0.28 0.28 0.32 0.30 2 (01/26/2010) 0.31 0.31 0.31 0.38 0.37 0.38 0.30 0.31 0.31 0.33 0.35 0.34 3 (03/03/2010) 0.20 0.22 0.21 0.27 0.31 0.29 0.28 0.29 0.29 0.27 0.28 0.28 4 (05/14/2010) 0.32 0.32 0.32 0.35 0.37 0.36 0.31 0.33 0.33 0.36 0.36 0.36
Infiltration rate and intensity of rain
Rain Corn Soybean Black beans Corn/black beans
Inf.(2) Rain Inf. Rain Inf. Rain Inf. Rain
N° mm h-1
1 28 64 16 62 26 64 21 62
2 19 62 15 59 20 62 15 59
3 35 65 43 72 18 65 28 72
4 12 63 14 66 2 63 11 66
Average 24 64 22 65 17 64 19 65
SD(3) 9 1 12 5 9 1 6 5
10-20 cm layer) equivalent to 94 %, for both layers.
This had a great influence on WIE. The WIE varied
between 8 and 21 mm h-1, equivalent to a 2.6-fold
increase, showing that other variables such as the type of crop residues, soil surface roughness and waste decomposition stage influenced WIE more than WSB. For ryegrass residue on the soil
surface, the coefficient of infiltration was 0.25, while
for vetch residue it was 0.19; in the soil chiseled with maintenance of only the roots of ryegrass the
coefficient was 0.17, whereas in the scarification
with vetch roots only it was 0.15, in the mean of the
applied rains. The higher coefficient of infiltration for ryegrass residue can be explained by the water
storage capacity of this residue and its ability
to slow down the flow, over the course of most of the experiment, because of its high resistance to
decomposition compared to vetch. To this effect, the roots of this crop contributed with the formation of
soil galleries, which increased water infiltration, due
to the fact that the soil had not been turned over, as shown by the soil property data obtained in the
same experiment and presented by Ramos (2012).
The WIE for ryegrass residue on the soil surface increased by 45 %, compared to the chiseled soil maintaining only the roots of the crop, while the rain rate was virtually the same in both treatments (Table 8). In the case of vetch residue, WSB was 20 % higher when left on the surface compared to
scarification maintaining only the roots, while the
rain rate was equal. Thus, regarding the ability to decrease runoff, the ryegrass residue left on the soil surface performed better than vetch under the same management, as well as when compared
to scarification carried out in the presence of the
roots of both crops, as shown by Ramos (2012) and
Ramos et al. (2014), working in the same experiment. Adjustment of the Horton model to the data obtained in both soils
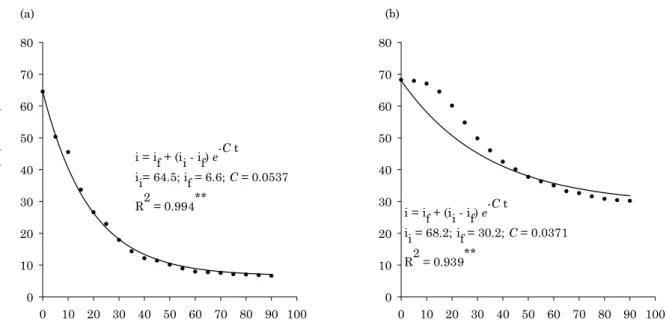
The Horton model (1940) significantly adjusted
to the data of water infiltration for both soils (Figure 1). For the Nitisol, the model predicted 94 %
of infiltration based on the mean of the data of 12
simulated rainfall events, while for the Cambisol, the prediction was 99 %, based on 16 events.
The infiltration rate observed in the field at the beginning of the rain (time zero) was 68.2 mm h-1
in the Nitisol and 64.5 mm h-1 in the Cambisol,
while at the end of 90 min of rain, the value was
30.2 mm h-1 in the Nitisol and 6.6 mm h-1 in the
Cambisol. On the other hand, the infiltration rate
at the end of the rain estimated by the model was
32.5 mm h-1 in the Nitisol and 7.1 mm h-1 in the
Cambisol, overestimating the value observed by 8 % in both soils. In the case of the Nitisol, the lack of agreement between the values estimated by the
model and the ones observed in the field, in the Table 8. Water content in two soil layers before simulated rainfall, water infiltration into soil at the end of the rain and rainfall intensity lasting 90 min, during the cycles of soybean and corn, using two seeding directions, in a Cambisol (average of two replications)
Rain Soil water content
(1)
0-10 10-20 Average 0-10 10-20 Average 0-10 10-20 Average 0-10 10-20 Average
cm cm cm cm
Soybean downhill Soybean contour Corn downhill Corn contour
Date kg kg-1
1 (01/20/2011) 0.33 0.34 0.34 0.28 0.30 0.29 0.29 0.32 0.31 0.30 0.30 0.30 2 (02/26/2011) 0.40 0.39 0.40 0.37 0.35 0.36 0.34 0.32 0.33 0.33 0.32 0.33 3 (03/19/2011) 0.25 0.30 0.28 0.23 0.26 0.25 0.25 0.28 0.27 0.27 0.29 0.28 4 (04/16/2011) 0.31 0.36 0.34 0.32 0.34 0.33 0.30 0.30 0.30 0.31 0.32 0.32
Infiltration rate and intensity of rain
Rain Soybean downhill Soybean contour Corn downhill Corn contour
Inf.(2) Rain Inf. Rain Inf. Rain Inf. Rain
N° mm h-1
1 4 74 12 70 5 75 14 69
2 3 64 4 66 3 64 8 66
3 6 64 15 67 3 64 21 67
4 2 65 8 63 3 63 36 66
Average 4 67 10 67 4 67 20 67
SD(3) 2 4 4 3 1 5 10 1
Table 9. Water content in two soil layers before simulated rainfall, water infiltration into soil at the end of the rain and rainfall intensity lasting 90 min, in different treatments, in a Cambisol (average of two replications)
Rain Soil water content
(1)
0-10 10-20 Average 0-10 10-20 Average 0-10 10-20 Average 0-10 10-20 Average
cm cm cm cm
Ryegrass residue Vetch residue Ryegrass roots - C Vetch roots - C
Date kg kg-1
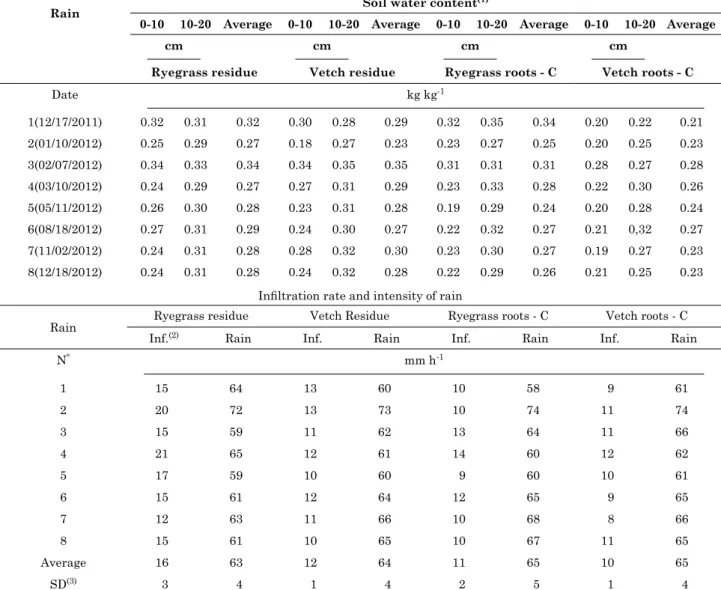
1(12/17/2011) 0.32 0.31 0.32 0.30 0.28 0.29 0.32 0.35 0.34 0.20 0.22 0.21 2(01/10/2012) 0.25 0.29 0.27 0.18 0.27 0.23 0.23 0.27 0.25 0.20 0.25 0.23 3(02/07/2012) 0.34 0.33 0.34 0.34 0.35 0.35 0.31 0.31 0.31 0.28 0.27 0.28 4(03/10/2012) 0.24 0.29 0.27 0.27 0.31 0.29 0.23 0.33 0.28 0.22 0.30 0.26 5(05/11/2012) 0.26 0.30 0.28 0.23 0.31 0.28 0.19 0.29 0.24 0.20 0.28 0.24 6(08/18/2012) 0.27 0.31 0.29 0.24 0.30 0.27 0.22 0.32 0.27 0.21 0,32 0.27 7(11/02/2012) 0.24 0.31 0.28 0.28 0.32 0.30 0.23 0.30 0.27 0.19 0.27 0.23 8(12/18/2012) 0.24 0.31 0.28 0.24 0.32 0.28 0.22 0.29 0.26 0.21 0.25 0.23
Infiltration rate and intensity of rain
Rain
Ryegrass residue Vetch Residue Ryegrass roots - C Vetch roots - C
Inf.(2) Rain Inf. Rain Inf. Rain Inf. Rain
N° mm h-1
1 15 64 13 60 10 58 9 61
2 20 72 13 73 10 74 11 74
3 15 59 11 62 13 64 11 66
4 21 65 12 61 14 60 12 62
5 17 59 10 60 9 60 10 61
6 15 61 12 64 12 65 9 65
7 12 63 11 66 10 68 8 66
8 15 61 10 65 10 67 11 65
Average 16 63 12 64 11 65 10 65
SD(3) 3 4 1 4 2 5 1 4
(1) Data from Ramos (2012); (2) Inf.: water infiltration into soil; (3) SD: Standard Deviation. C: chiseled soil.
beginning of the rain, is explained by the fact that the water infiltration capacity of the soil in those
moments was far superior to the rate of rain applied, while in the Cambisol, the higher agreement between the estimated and the observed data
was because the infiltration capacity was similar to the rainfall rate. This behavior is explained
mainly by the difference in macropore volume, due to the difference, especially in clay content, between both soils (Table 1). The over- estimated
infiltration rate at the end of the rain in both soils
was due to the hydraulic variables, not controlled
experimentally, especially those depending on soil
physical properties. Thus, it is possible to conclude
that the constant rate for water infiltration for
the Nitisol was 30.2 mm h-1 and 6.6 mm h-1 in the
Cambisol, under the experimental conditions.
CONCLUSIONS
Water infiltration into soil varies significantly
with the soil type, with a constant value of
30.2 mm h-1 in the Nitisol and 6.6 mm h-1 in the
Cambisol, regardless of the management system, time of application and rain intensity and duration.
Water infiltration into soil varies significantly with
the management system, with the time of application and rain intensity and duration, with a constant value
between 13 and 59 mm h-1, for the two soils.
The direction of seeding in relation to the relief, crop type and amount and type of crop residue on
the soil influences water infiltration into the soil: in
Nitisol, the values vary between 27 and 43 mm h-1
Figure 1. Model of Horton (1940) adjusted to the data of water infiltration into the soil, for 12 simulated rainfall events in a Nitisol (a) and 16 events in a Cambisol (b) (average of replications and events).
0 10 20 30 40 50 60 70 80 90 100 0
10 20 30 40 50 60 70 80
(a) (b)
i = if + (ii - if) e-C t
ii= 64.5; if = 6.6; C = 0.0537
R2 = 0.994**
0 10 20 30 40 50 60 70 80 90 100 0
10 20 30 40 50 60 70 80
i = if + (ii - if) e-C t
ii = 68.2; if = 30.2; C = 0.0371
R2 = 0.939**
Infiltration, i (mm h
-1)
Time, t (min)
residues of corn, wheat and soybean, while in Cambisol, the variation is respectively between
2 and 36 mm h-1, in soybean and corn.
The Horton model adjusts to the water infiltration
rates in the Nitisol and Cambisol, resulting in the
respective equations i = 30.2 + (68.2 - 30.2) e-0.0371t
(R2 = 0.94**) and I = 6.6 + (64.5 - 6.6) e-0.0537t (R2 = 0.99**).
ACKNOWLEDGEMENTS
We would like to thank the Brazilian Council for Scientific and Technological Development (CNPq), Brazilian Innovation Agency FINEP and the Santa
Catarina Research Foundation (FAPESC), for the
financial resources for the experiments. The M.S. students: Dirceu Leite, Fernando Luiz Engel, José
Mecabô Junior, Roger Robert Ramos and Juliana Marioti, and the PhD students: André Julio do Amaral and Julio Cesar Ramos, for conducting the
experiments during their courses.
REFERENCES
Amaral AJ. Erosão hídrica e limites críticos de comprimento de declive em diferentes tipos e quantidades de resíduo cultural e dois modos de semeadura direta [tese]. Porto Alegre: Universidade Federal do Rio Grande do Sul; 2010.
Amaral AJ, Cogo NP, Bertol I, Santos PG, Werner RS. Erosão hídrica e escoamento superficial em função de tipos e doses
de resíduo cultural em dois métodos de seta. R Ci Agrovet. 2013;12:163-74.
Barbosa FT. Erosão hídrica em três formas de semeadura de aveia e ervilhaca em um Cambissolo Húmico: Perdas de nutrientes e carbono orgânico [dissertação]. Lages: Universidade do Estado de Santa Catarina; 2008.
Barbosa FT. Comprimento crítico de declive relacionado à erosão hídrica, em diferentes tipos e doses de resíduo em duas direções de semeadura direta [tese]. Lages: Universidade do Estado de Santa Catarina; 2011.
Bertol I, Bertol C, Barbosa FT. Simulador de chuva tipo empuxo com braços rotativos movidos hidraulicamente: Fabricação e calibração. R Bras Ci Solo. 2012;36:1905-10.
Bertol I, Mello EL, Cogo NP, Vidal Vázquez E, Paz González A. Parâmetros relacionados com a erosão hídrica sob taxa constante de enxurrada, em diferentes métodos de preparo do solo. R Bras Ci Solo. 2006;30:715-22.
Bertol I, Ramos RR, Barbosa FT, Paz González A, Ramos JC, Bandeira DH. Water erosion in no-tillage monocultire and intercropped systems along contours lines. R Bras Ci Solo. 2013;37:521-8.
Bertol I, Zoldan Junior WA, Fabian EL, Zavaschi E, Pegoraro R, Paz González A. Efeito de escarificação e da erosividade de chuvas sobre algumas variáveis de valores de erosão hídrica em sistemas de manejo de um Nitossolo Háplico. R Bras Ci Solo. 2008;32:747-57. Burwell RE, Larson WE. Infiltration as influenced by tillage-induced random roughness and pore space. Soil Sci Soc Am Proc. 1969;33:449-52.
Engel FL. Erosão hídrica provocada por chuvas simuladas durante o cultivo da soja [dissertação]. Lages: Universidade do Estado de Santa Catarina; 2005.
Horton RE. An approach toward a physical interpretation of infiltration-capacity. Soil Sci Soc Am Proc. 1940;5:399-417.
International Union of Soil Sciences/Working Group Word Reference Base – IUSS/WRB. World reference base for soil resources 2006. Rome: Food and Agriculture Organization of the United Nations; 2006. (World Soil Resources Reports, 103). Leite, D. Erosão hídrica sob chuva simulada em um Nitossolo Háplico submetido a diferentes manejos [dissertação]. Lages: Universidade do Estado de Santa Catarina; 2003.
Leite D, Bertol I, Guadagnin JC, Santos EJ, Ritter SR. Erosão hídrica em um Nitossolo Háplico submetido a diferentes sistemas de manejo sob chuva simulada: I. Perdas de solo e água. R Bras Ci Solo. 2004;28:1033-44.
Libardi PL. Infiltração de água no solo. In: Libardi PL, editor. Dinâmica da água no solo. Piracicaba: 1995. p.313-55.
Luciano, R.V. Erosão hídrica em três formas de semeadura de aveia e ervilhaca em um Cambissolo Húmico [dissertation]. Lages: Universidade do Estado de Santa Catarina; 2008.
Luciano RV, Bertol I, Barbosa FT, Vidal Vázquez E, Fabian EL. Perdas de água e solo por erosão hídrica em duas direções de semeadura de aveia e ervilhaca. R Bras Ci Solo. 2009;33:669-76. Marioti J. Erosão hídrica em Cambissolo Húmico cultivado com milho e soja sem preparo do solo, nas direções da pendente e em contorno ao declive, comparada ao solo sem cultivo [dissertação]. Lages: Universidade do Estado de Santa Catarina; 2012. Marioti J, Bertol I, Ramos JC, Werner RS, Padilha J, Flores MC, Bandeira DH. Erosão hídrica em semeadura direta de milho e soja nas direções da pendente e em contorno ao declive, comparada ao solo sem cultivo e descoberto. R Bras Ci Solo. 2013;37:1361-71. Mecabô Júnior, J. Influência de uma aplicação de dejeto líquido de suínos sobre atributos do solo e erosão hídrica em um Nitossolo Bruno [dissertação]. Lages: Universidade do Estado de Santa Catarina; 2013.
Mello EL. Erosão hídrica em diferentes sistemas de manejo do solo sob chuva simulada [dissertação]. Lages: Universidade do Estado de Santa Catarina, 2002.
Paixão FJR, Andrade ARS, Azevedo CAV, Costa TL, Guerra OC. Ajuste de la curva de infiltración por médio del uso de modelos empíricos diferentes. Pesq Aplic Agrotec. 2009;2:107-12. Panachuki E, Alves Sobrinho T, Vitorino ACT, Carvalho DF, Urchei MA. Avaliação da infiltração de água no solo, em sistema
de integração agricultura-pecuária, com uso de infiltrômetro de aspersão portátil. Acta Sci Agron. 2006;28:129-37.
Panachuki E, Bertol I, Alves Sobrinho T, Oliveira PTS, Bica DB. Perdas de solo e água e infiltração de água em Latossolo Vermelho sob sistemas de manejo. R Bras Ci Solo. 2011;35:1777-85. Philip JR. The theory of infiltration: 3. moisture profiles and relation to experiment. Soil Sci. 1957;84:163-78.
Portela JC, Cogo NP, Amaral AJ, Gilles L, Bagatini T, Chagas JP, Portz G. Hidrogramas e sedimentogramas associados à erosão hídrica em solo cultivado com diferentes sequências culturais, com diferentes condições físicas na superfície. R Bras Ci Solo. 2011;35:225-40.
Prando MB, Olibone D, Olibone APE, Rosolem CA. Infiltração de água no solo sob escarificação e rotação de culturas. R Bras Ci Solo. 2010;34:693-700.
Ramos JC. Erosão hídrica influenciada pelo cultivo, cobertura do solo por resíduos culturais e rugosidade superficial, em um Cambissolo Húmico [dissertação]. Lages: Universidade do Estado de Santa Catarina; 2012.
Ramos JC, Bertol I, Barbosa FT, Marioti J, Werner RS, Borges JP. Influência das condições de superfície e do cultivo do solo na erosão hídrica em um Cambissolo Húmico. R Bras Ci Solo. 2014;38: 1587-600.
Schwab GO, Frevert RK, Edminster TW, Barnes KK. Infiltration, evaporation, and transpiration. In: Schwab GO, Frevert RK, Edminster TW, Barnes KK, editors. Soil and water conservation engineering. 4a.ed. New York; John Wiley & Sons; 1981. p.49-67. Silveira AL, Louzada JA, Beltrame LF. Infiltração e armazenamento no solo. In: Tucci CEM, editor. Hidrologia: Ciência e aplicação. Porto Alegre: Associação Brasileira de Recursos Hídricos, 1993. p.335-72.
Swanson NP. A rotating-boom rainfall simulator. Trans Am Soc Agron Eng. 1965;26:1738-43.
Zoldan Junior WA, Bertol I, Pegoraro R, Zavaschi E, Vidal Vázquez E. Rugosidade superficial do solo formada por escarificação e influenciada pela erosividade da chuva. R Bras Ci Solo. 2008;32:353-62.