* Corresponding author:
E-mail: [email protected]
Received: October 27, 2015
Approved: June 15, 2016
How to cite: Oliveira Filho LCI, Klauberg Filho O, Baretta D, Tanaka CAS, Sousa JP. Collembola Community Structure as a Tool
to Assess Land Use Effects on
Soil Quality. Rev Bras Cienc Solo. 2016;40:e0150432.
Copyright: This is an open-access article distributed under the terms of the Creative Commons Attribution License, which permits unrestricted use, distribution, and reproduction in any medium, provided that the original author and source are credited.
Collembola Community Structure as
a Tool to Assess Land Use Effects on
Soil Quality
Luís Carlos Iuñes de Oliveira Filho(1)*
, Osmar Klauberg Filho(1)
, Dilmar Baretta(2) , Cynthia Akemi Shinozaki Tanaka(1)
and José Paulo Sousa(3) (1)
Universidade do Estado de Santa Catarina, Centro de Ciências Agroveterinárias, Departamento de Solos e Recursos Naturais, Lages, Santa Catarina, Brasil.
(2)
Universidade do Estado de Santa Catarina, Centro de Educação Superior do Oeste, Departamento de Zootecnia, Chapecó, Santa Catarina, Brasil.
(3)
Centre for Functional Ecology, Department of Life Sciences, Universidade de Coimbra, Coimbra, Portugal.
ABSTRACT: Collembolan species are differently affected by soil tillage (conventional, minimum tillage, and no-tillage) and are known to modify plant growth. This study relies on the relationships between Collembola community structures and land use systems as a proxy for characterizing changes in soil quality. Thus, Collembola community structure (eco-morphological groups – edaphic, hemiedaphic and epigeic, and morphotypes) were examined in a no-tillage system and crop-livestock integration system to evaluate the discriminative power of the Collembola community structure and to determine which soil properties drives structural diversity. Thirty-eight morphotypes of Collembola were recorded in this study, 11 belonging to the edaphic eco-morphological group, 14 hemiedaphic, and 13 epigeic. The hemiedaphic and epigeic groups, in the no-tillage system, were more influenced by changes in soil properties (total organic carbon, particulate organic carbon, total N, Ca, Mg, moisture, bulk density) and mycelium length than the groups in the crop-livestock integration system (mycorrhizal inoculum potential, and soil properties as dehydrogenase, particulate organic carbon, Mg, sand). Collembola eco-morphological groups were better predictors for ecosystem functioning than Collembola density and can be used to distinguish differences between soil uses, reducing laboratory analysis time.
INTRODUCTION
Soil springtails are good representatives of the diversity of soil fauna (Cassagne et al., 2003) that interacts with ecosystem processes in several ways. These soil microarthropods have significant influence on soil microbial ecology, nutrient cycling, and soil fertility by feeding on soil microorganisms and dead organic matter. In turn, microarthropods also respond to a variety of environmental and ecological factors, like changes in soil chemistry, microhabitat configuration, and agricultural practices (Hopkin, 1997). One of the main limitations of Collembola study is the lack of available taxonomists (Zeppelini Filho and Bellini, 2004). An alternative approach has been studied by Parisi (2001), who proposed the concept of eco-morphological (EM) value. The aim of the EM value is to group specimens of each species in accordance with their degree of adaptation to the soil (soil profile and litter layer), ranked according to a specific EM value determination and separated in life-forms (morphotypes).
Collembolan species are differently affected by soil tillage (conventional, minimum tillage, and no-tillage) (van Capelle et al., 2012) and are known to modify plant growth (Eisenhauer et al., 2011). In agricultural systems, springtails are sensitive to different soil use practices (Bandyopadhyaya et al., 2002; Sousa et al., 2006; Chang et al., 2013). A few studies have reported on the Collembola community structure in non-inversion deep tillage and conventional plowing (Petersen, 2002a), agricultural land use as arable land, permanent grasslands, shrublands, and woodlands on a slope (Parisi et al., 2005), landscape diversity (Querner et al., 2013), and different land use types (forests, grasslands, and arable lands) (Martins da Silva et al., 2015). However, there is no published study focusing on the structure of the Collembola community in no-tillage and crop-livestock integration.
In this study, we analyzed the structural diversity of springtails, and explore possible applications of EM groups and morphotypes of Collembola as potential soil bioindicators. Thus, we propose to assess the relationships between EM groups of Collembola biodiversity and land use systems with a history of no-tillage and integrated crop-livestock. We hypothesize there are differences in structural diversity between the two land use systems, and that determination at the level of morphotypes will allow observation of these differences. This study was conducted with two objectives: assess the discriminative power of the Collembola community structure (EM groups - edaphic, hemiedaphic, and epigeic, and morphotypes) in two soil use systems; and verify which soil properties drive the structural diversity of the systems under study.
MATERIALS AND METHODS
Study site
The study area is located in the plateau area of Santa Catarina (southern Brazil). Three municipalities were selected, Campo Belo do Sul, Lages, and Otacílio Costa, each municipality was considered as a replicate. Two different land use systems (LUS) were studied in the municipality: no-tillage crops (NT) and integrated crop-livestock systems (ICL).
Climate in the region is Cfa (humid subtropical) by the Köppen classification system (Peel et al., 2007), with mean temperatures ranging from 14 to 18 °C. The region shows no marked dry season and there is rainfall throughout the year. Soils of the sites are clayey and loamy brown Nitossolo Bruno (Oxisols) or Cambissolo Húmico (Inceptisols) (Embrapa, 2006).
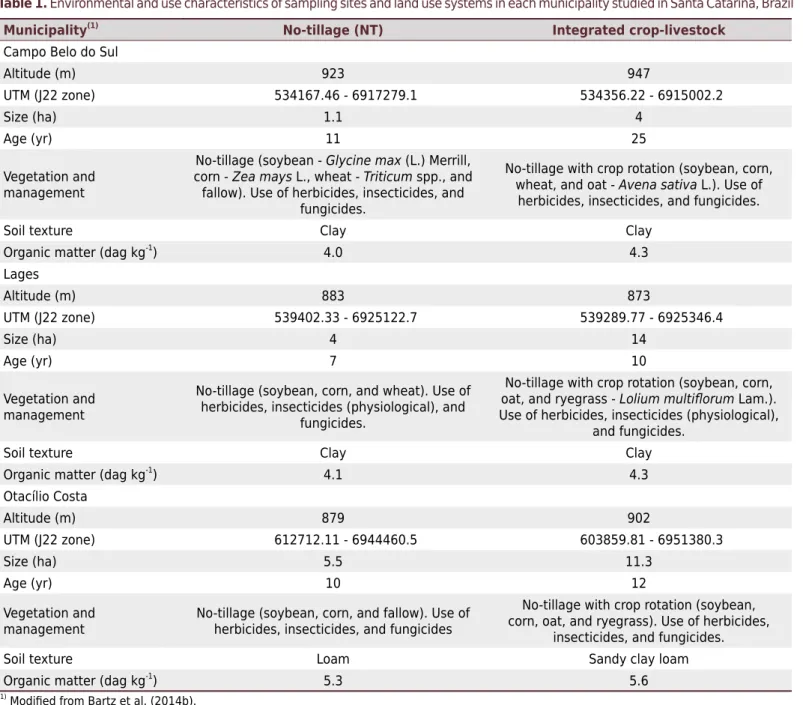
been under an NT system for 7-11 yr (Bartz et al., 2014b). The synergy among pasture, livestock, and crops in an ICL system can provide permanent soil cover and input of crop residue, improving overall soil fertility, and through production of dung and urine, soil biological activity and nutrient recycling can increase (Dubeux et al., 2009; Silva et al., 2014). The ICL fields ranged from 4 to 14 ha in size and had been under an ICL systems for 10-25 yr (Bartz et al., 2014b). The environmental and land use characteristics of each sample site are shown in table 1.
Experimental design and sampling
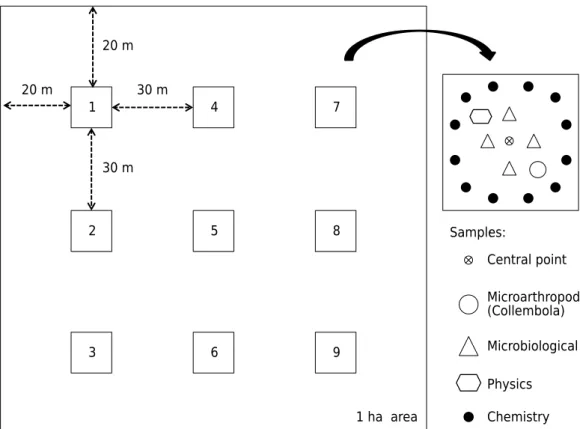
Sampling was carried out in winter (May 2013), when the areas (NT and ICL) had corn plant residues on the soil surface and before seeding of oats for soil cover. In each system, nine centering points were georeferenced in grid sampling (centered in a 1 ha plot), at a distance of 30 m from each other and 20 m from the edge. Around the centering point, nine soil samples were collected (soil plus all plant residues on the soil surface) for microarthropods (Collembola) and microbiological, physical, and chemical analyses of the soil (Figure 1).
Table 1. Environmental and use characteristics of sampling sites and land use systems in each municipality studied in Santa Catarina, Brazil
Municipality(1)
No-tillage (NT) Integrated crop-livestock
Campo Belo do Sul
Altitude (m) 923 947
UTM (J22 zone) 534167.46 - 6917279.1 534356.22 - 6915002.2
Size (ha) 1.1 4
Age (yr) 11 25
Vegetation and management
No-tillage (soybean - Glycine max (L.) Merrill, corn - Zea mays L., wheat - Triticum spp., and
fallow). Use of herbicides, insecticides, and fungicides.
No-tillage with crop rotation (soybean, corn, wheat, and oat - Avena sativa L.). Use of
herbicides, insecticides, and fungicides.
Soil texture Clay Clay
Organic matter (dag kg-1
) 4.0 4.3
Lages
Altitude (m) 883 873
UTM (J22 zone) 539402.33 - 6925122.7 539289.77 - 6925346.4
Size (ha) 4 14
Age (yr) 7 10
Vegetation and management
No-tillage (soybean, corn, and wheat). Use of herbicides, insecticides (physiological), and
fungicides.
No-tillage with crop rotation (soybean, corn, oat, and ryegrass - Lolium multiflorum Lam.). Use of herbicides, insecticides (physiological),
and fungicides.
Soil texture Clay Clay
Organic matter (dag kg-1
) 4.1 4.3
Otacílio Costa
Altitude (m) 879 902
UTM (J22 zone) 612712.11 - 6944460.5 603859.81 - 6951380.3
Size (ha) 5.5 11.3
Age (yr) 10 12
Vegetation and management
No-tillage (soybean, corn, and fallow). Use of herbicides, insecticides, and fungicides
No-tillage with crop rotation (soybean, corn, oat, and ryegrass). Use of herbicides,
insecticides, and fungicides.
Soil texture Loam Sandy clay loam
Organic matter (dag kg-1) 5.3 5.6
For microbiological analysis, samples were collected from a depth of 0.10 m, sieved (<0.002 m), and kept refrigerated (4 °C) for analyses. For chemical analysis, samples were collected from a depth of 0.10 m, air-dried, sieved (<0.004 m), and stored until analysis. For physical analysis, disturbed and undisturbed samples were collected (from a depth of 0.10 m). Disturbed samples were air-dried, sieved (<0.004 m), and stored. Undisturbed samples were kept intact and sealed to prevent loss of moisture.
Collembola sampling and eco-morphological characterization
The evaluation of microarthropods was restricted to Collembola and their community structure through categorization into life-form groups (edaphic, hemiedaphic, and epigeic) and morphotypes within each group.
The separation into EM groups and morphotypes was carried out as follows: microarthropods were collected using a metal cylinder (5 cm diameter × 5 cm depth). Soil samples were taken to the laboratory immediately after collection, where a modified Berlese-Tullgren funnel was used to extract microarthropods from them using heat and light as repellents. The samples remained in the funnels for 14 days. All organisms were removed and fixed in 80 % ethanol. The content of microarthropods was analyzed in each soil sample separately, sorted, and identified using Zeiss stereomicroscopes.
To recognize the different adaptation levels for Collembola, the method requires searching for morphological characteristics (traits) that are connected to adaptation of each collembolan species to the soil environment. The traits used are presence of ocelli, antenna length, development of furca, presence or absence of body hairs/scales, and pigmentation (Table 2), a procedure modified from Vandewalle et al. (2010). For each individual organism, the traits receive a score (partial EM value), and the final EM value will be the sum of all scores from each individual trait. Structural diversity of springtails or EM groups were classified as epigeic, hemiedaphic, or edaphic, which can range from 0 (epigeic forms, indicating a species with higher adaptation to the surface layers)
1 4 7
2 5 8
3 6 9
20 m
20 m 30 m
30 m
Microarthropod
Physics
Chemistry Samples::
Central point
Microbiological
1 ha area
(Collembola)
to 20 (edaphic forms, indicating a species with higher adaptation to deep soil layers); hemiedaphic (i.e., intermediate) forms have an index rating proportional to their degree of specialization. Hence, the higher the EM value, the smaller the dispersion power of the organism and the higher its adaptation to the soil profile. A morphotype was attributed to the different combination of traits (final EM value). As a general rule, edaphic forms get a final EM = 20-14, hemiedaphic forms get a final EM = 12-8, while epigeic forms get a final EM = 6-0 (Table 3).
Table 2. Traits used to calculate eco-morphological (EM) value for Collembola
Trait(1) Codification Partial EM value
Ocelli Present 0
Absent 4
Antenna length Antenna length > body length 0
Antenna length > 0.5 × body length 2 Antenna length < 0.5 × body length 4
Furca Fully developed 0
Reduced/short 2
Absent 4
Hairs/Scales Present 0
Absent 4
Pigmentation Colored and with patterns 0
Colored but not uniformly pigmented 2
Absent (white color or transparent) 4
(1)
Adapted from Vandewalle et al. (2010).
Table 3. Collembola traits, formed categories of morphotypes, and collected categories
Partial Eco-Morphological Value (EMV)
Final
EMV EM group
Morphotype Ocelli Antenna
length Furca
Hairs/
Scales Pigmentation Category Collected 0-4 0-2-4 0-2-4 0-4 0-2-4
4 4 4 4 4 20 Edaphic Edaphic 1 x
4 4 4 4 2 18 Edaphic Edaphic 2 x
4 4 2 4 4 18 Edaphic Edaphic 3 x
4 2 4 4 4 18 Edaphic Edaphic 4 x
4 4 4 4 0 16 Edaphic Edaphic 5 x
4 4 4 0 4 16 Edaphic Edaphic 6 x
4 4 2 4 2 16 Edaphic Edaphic 7
4 4 0 4 4 16 Edaphic Edaphic 8 x
4 2 4 4 2 16 Edaphic Edaphic 9
4 2 2 4 4 16 Edaphic Edaphic 10
4 0 4 4 4 16 Edaphic Edaphic 11
0 4 4 4 4 16 Edaphic Edaphic 12 x
4 4 4 0 2 14 Edaphic Edaphic 13
4 4 2 4 0 14 Edaphic Edaphic 14
4 4 2 0 4 14 Edaphic Edaphic 15 x
4 4 0 4 2 14 Edaphic Edaphic 16 x
4 2 4 4 0 14 Edaphic Edaphic 17
4 2 4 0 4 14 Edaphic Edaphic 18
4 2 2 4 2 14 Edaphic Edaphic 19
4 2 0 4 4 14 Edaphic Edaphic 20
4 0 4 4 2 14 Edaphic Edaphic 21
4 0 2 4 4 14 Edaphic Edaphic 22
0 4 4 4 2 14 Edaphic Edaphic 23 x
0 4 2 4 4 14 Edaphic Edaphic 24
0 2 4 4 4 14 Edaphic Edaphic 25
4 4 4 0 0 12 Hemiedaphic Hemiedaphic 1
4 4 2 0 2 12 Hemiedaphic Hemiedaphic 2
4 4 0 4 0 12 Hemiedaphic Hemiedaphic 3
4 4 0 0 4 12 Hemiedaphic Hemiedaphic 4 x
4 2 4 0 2 12 Hemiedaphic Hemiedaphic 5
4 2 2 4 0 12 Hemiedaphic Hemiedaphic 6
4 2 2 0 4 12 Hemiedaphic Hemiedaphic 7
4 2 0 4 2 12 Hemiedaphic Hemiedaphic 8
4 0 4 4 0 12 Hemiedaphic Hemiedaphic 9
4 0 4 0 4 12 Hemiedaphic Hemiedaphic 10
4 0 2 4 2 12 Hemiedaphic Hemiedaphic 11
4 0 0 4 4 12 Hemiedaphic Hemiedaphic 12
0 4 4 4 0 12 Hemiedaphic Hemiedaphic 13 x
0 4 4 0 4 12 Hemiedaphic Hemiedaphic 14
0 4 2 4 2 12 Hemiedaphic Hemiedaphic 15 x
0 4 0 4 4 12 Hemiedaphic Hemiedaphic 16 x
0 2 4 4 2 12 Hemiedaphic Hemiedaphic 17
0 2 2 4 4 12 Hemiedaphic Hemiedaphic 18
0 0 4 4 4 12 Hemiedaphic Hemiedaphic 19
4 4 2 0 0 10 Hemiedaphic Hemiedaphic 20
4 4 0 0 2 10 Hemiedaphic Hemiedaphic 21
4 2 4 0 0 10 Hemiedaphic Hemiedaphic 22
4 2 2 0 2 10 Hemiedaphic Hemiedaphic 23
4 2 0 4 0 10 Hemiedaphic Hemiedaphic 24
4 2 0 0 4 10 Hemiedaphic Hemiedaphic 25 x
4 0 4 0 2 10 Hemiedaphic Hemiedaphic 26
4 0 2 4 0 10 Hemiedaphic Hemiedaphic 27
4 0 2 0 4 10 Hemiedaphic Hemiedaphic 28
4 0 0 4 2 10 Hemiedaphic Hemiedaphic 29
0 4 4 0 2 10 Hemiedaphic Hemiedaphic 30 x
0 4 2 4 0 10 Hemiedaphic Hemiedaphic 31
0 4 2 0 4 10 Hemiedaphic Hemiedaphic 32 x
0 4 0 4 2 10 Hemiedaphic Hemiedaphic 33 x
0 2 4 4 0 10 Hemiedaphic Hemiedaphic 34
0 2 4 0 4 10 Hemiedaphic Hemiedaphic 35
0 2 2 4 2 10 Hemiedaphic Hemiedaphic 36
0 2 0 4 4 10 Hemiedaphic Hemiedaphic 37 x
0 0 4 4 2 10 Hemiedaphic Hemiedaphic 38
0 0 2 4 4 10 Hemiedaphic Hemiedaphic 39
4 4 0 0 0 8 Hemiedaphic Hemiedaphic 40 x
4 2 2 0 0 8 Hemiedaphic Hemiedaphic 41
4 2 0 0 2 8 Hemiedaphic Hemiedaphic 42
Microbiological properties
The enzymes studied are involved in the biogeochemical cycles of N - potential nitrification, PN (Berg and Rosswall, 1985); P, acid phosphatase, AP (Margesin, 1996); and microbial activity, dehydrogenase activity, DHA (Öhlinger, 1996).
Determination of microbial biomass carbon (MBC) was performed with the fumigation-extraction method (Vance et al., 1987). Basal respiration (BR; CO2-C) was estimated using 50 g of soil
4 0 4 0 0 8 Hemiedaphic Hemiedaphic 43
4 0 2 0 2 8 Hemiedaphic Hemiedaphic 44
4 0 0 4 0 8 Hemiedaphic Hemiedaphic 45
4 0 0 0 4 8 Hemiedaphic Hemiedaphic 46
0 4 4 0 0 8 Hemiedaphic Hemiedaphic 47 x
0 4 2 0 2 8 Hemiedaphic Hemiedaphic 48
0 4 0 4 0 8 Hemiedaphic Hemiedaphic 49 x
0 4 0 0 4 8 Hemiedaphic Hemiedaphic 50 x
0 2 4 0 2 8 Hemiedaphic Hemiedaphic 51
0 2 2 4 0 8 Hemiedaphic Hemiedaphic 52
0 2 2 0 4 8 Hemiedaphic Hemiedaphic 53
0 2 0 4 2 8 Hemiedaphic Hemiedaphic 54 x
0 0 4 4 0 8 Hemiedaphic Hemiedaphic 55
0 0 4 0 4 8 Hemiedaphic Hemiedaphic 56
0 0 2 4 2 8 Hemiedaphic Hemiedaphic 57
0 0 0 4 4 8 Hemiedaphic Hemiedaphic 58
4 2 0 0 0 6 Epigeic Epigeic 1 x
4 0 2 0 0 6 Epigeic Epigeic 2
4 0 0 0 2 6 Epigeic Epigeic 3
0 4 2 0 0 6 Epigeic Epigeic 4
0 4 0 0 2 6 Epigeic Epigeic 5 x
0 2 4 0 0 6 Epigeic Epigeic 6
0 2 2 0 2 6 Epigeic Epigeic 7
0 2 0 4 0 6 Epigeic Epigeic 8 x
0 2 0 0 4 6 Epigeic Epigeic 9 x
0 0 4 0 2 6 Epigeic Epigeic 10
0 0 2 4 0 6 Epigeic Epigeic 11
0 0 2 0 4 6 Epigeic Epigeic 12
0 0 0 4 2 6 Epigeic Epigeic 13 x
4 0 0 0 0 4 Epigeic Epigeic 14 x
0 4 0 0 0 4 Epigeic Epigeic 15 x
0 2 2 0 0 4 Epigeic Epigeic 16
0 2 0 0 2 4 Epigeic Epigeic 17 x
0 0 4 0 0 4 Epigeic Epigeic 18
0 0 2 0 2 4 Epigeic Epigeic 19
0 0 0 4 0 4 Epigeic Epigeic 20 x
0 0 0 0 4 4 Epigeic Epigeic 21 x
0 2 0 0 0 2 Epigeic Epigeic 22 x
0 0 2 0 0 2 Epigeic Epigeic 23
0 0 0 0 2 2 Epigeic Epigeic 24 x
0 0 0 0 0 0 Epigeic Epigeic 25 x
(Alef and Nannipieri, 1995), by quantifying the CO2 released from the microbial respiration process in a period of 10 days of incubation at 28 °C. Eco-physiological parameters, such as metabolic quotient (qCO2) (Anderson and Domsch, 1993) and microbial quotient (qMic) (Sparling, 1992), were calculated by dividing basal respiration by MBC, and by the expression (MBC/Corg)/10, respectively.
Mycelium length of arbuscular mycorrhizal fungi (AMF) was assessed using the method proposed by Melloni and Cardoso (1998). The mycorrhizal infectivity of the soil was measured as percent of infection (mycorrhizal inoculum potential or MIP), as described by Reeves et al. (1979).
Fresh soil samples were used to quantify microbiological properties, and all results were expressed on a dry soil basis.
Physical and chemical properties
Soil samples were analyzed for the following physical properties: particle size (Gee and Bauder, 1986), moisture, bulk density (Bd), total porosity (TP), microporosity (Mi), and macroporosity (Ma) according to Claessen (1997); biopores (BP) according to Ringrose-Voase (1991); and aggregate stability (AS) according to Kemper and Chepil (1965). Soil resistance to penetration (SRP) was performed using the “Falker penetroLOG”
penetrometer to a depth of 0.10 m. Chemical properties analyzed were pH (in H2O),
exchangeable cations (Al3+, Ca2+, Mg2+, and K+), available phosphorus (P), total organic carbon (TOC) content, and total nitrogen (TN) content according to Tedesco et al. (1995); and particulate organic carbon (POC) according to Cambardella and Elliott (1992).
Statistical analysis
Prior to statistical analysis, the number of springtails was used to estimate density (ind m-2), and data (without outliers) were transformed (√x+1), if necessary, to comply with the requirements of analysis of variance (Anova; normal distribution and homoscedasticity of error variances). Main effects in Anova was used to compare the density and richness of springtails and the microbiological, physical, and chemical properties between the different land uses using the software STATISTICA 7.0. Analyses were conducted at the LUS level, using the value of the three municipalities (nine soil samples per municipality) as replicates (n = 27 in each LUS). Means presented in figures were calculated using non-transformed data. Comparisons of means were performed using Tukey’s HSD test (p<0.05).
In order to study the community structures, the morphotypes were ranked (transformed Ln) in decreasing order of their density, and a SIMPER analysis was performed to identify which EM groups and morphotypes were responsible for differences between the systems using the software PRIMER 5.2.6. In addition, we calculated a Pearson correlation matrix between all variables pairwise for each land use system, using the three municipalities as co-variable, with a significance threshold of p<0.05 to analyze the relationship between Collembola, EM groups, and soil properties, using STATISTICA 7.0.
RESULTS
Community structure of Collembola
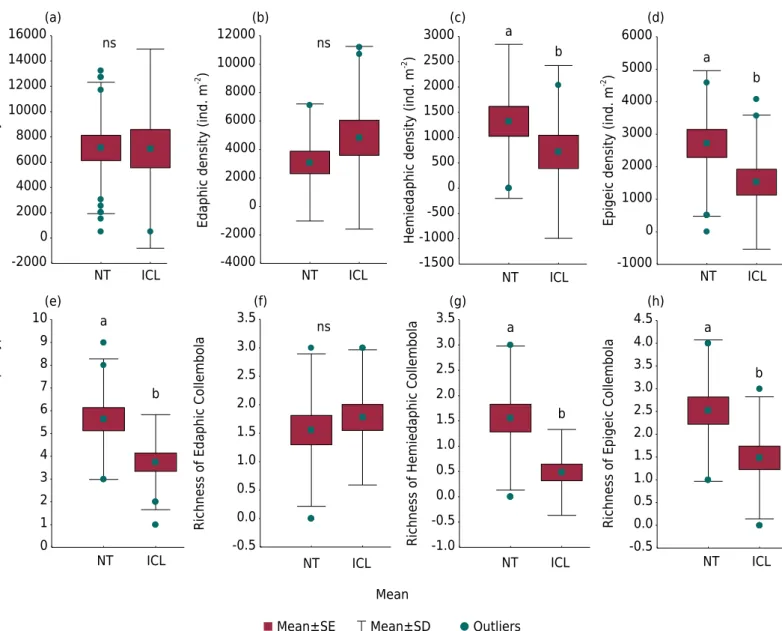
The two LUS (habitat types – NT and ICL) showed different springtail structural diversity. Although the two LUS have the same density of springtails (Figure 2a), the community structure varied based on the EM groups. In NT, there was better distribution among groups, while in the ICL, a predominance of edaphic springtails was observed.
717 ind m-2 in ICL) and epigeic (2,716 ind m-2 in NT and 1,528 ind m-2 in ICL) groups exhibited differences (Figures 2c and 2d), and proved to be more sensitive than the use of adopted indicators, resulting in a better reference in regard to ecosystem functioning. In fact, SIMPER analysis confirms that hemiedaphic and epigeic groups are more sensitive because they are responsible for major dissimilarities between LUS at levels of 89 % (hemiedaphic) and 78 % (edaphic).
Richness morphotypes for Collembola in NT (5.6) was higher than in ICL (3.7) (Figure 2e). The same was observed for richness of hemiedaphic (1.6 in NT and 0.5 in ICL) and epigeic (2.5 in NT and 1.5 in ICL) EM groups (Figures 2g and 2h). This reinforces the discriminating power of EM groups.
Rank abundance of morphotypes
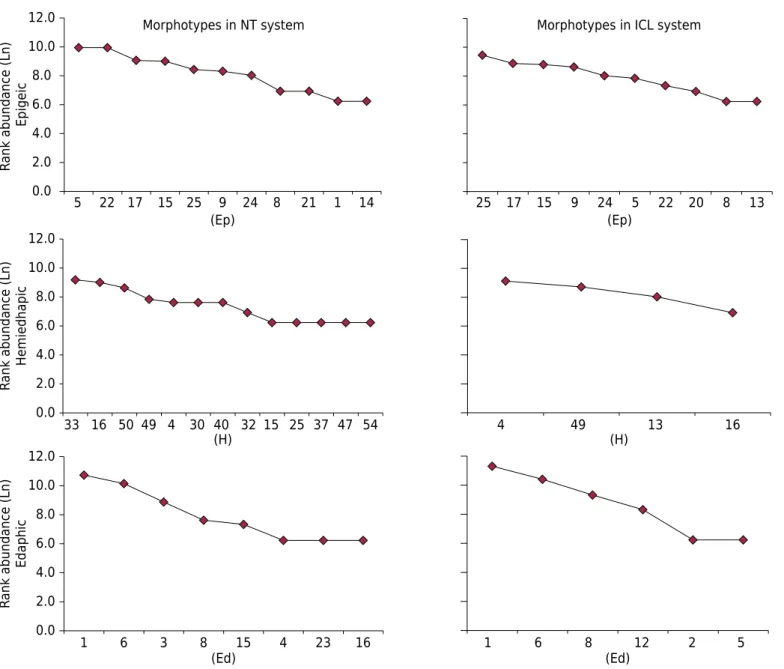
In total, 38 morphotypes of Collembola were recorded in this study, 11 belonging to the edaphic EM group, 14 hemiedaphic, and 13 epigeic (Table 3). Figure 3 shows the number of morphotypes in each group and their contribution to each LUS. Both systems had a different number of morphotypes and composition; NT showed the highest number of morphotypes in the three EM groups.
NT ICL -2000 0 2000 4000 6000 8000 10000 12000 14000 16000 NT ICL 0 1 2 3 4 5 6 7 8 9 10
Collembola density (ind.
m
-2 )
Richness of Collembola Morphotypes
NT ICL -4000 -2000 0 2000 4000 6000 8000 10000 12000 NT ICL -0.5 0.0 0.5 1.0 1.5 2.0 2.5 3.0 3.5
Edaphic density (ind. m
-2 )
Richness of Edaphic Collembol
a NT ICL -1500 -1000 -500 0 500 1000 1500 2000 2500 3000 NT ICL -1.0 -0.5 0.0 0.5 1.0 1.5 2.0 2.5 3.0 3.5
Hemiedaphic density (ind. m
-2 )
Richness of Hemiedaphic Collembol
a NT ICL -1000 0 1000 2000 3000 4000 5000 6000 NT ICL -0.5 0.0 0.5 1.0 1.5 2.0 2.5 3.0 3.5 4.0 4.5 (a) ns ns ns a b a b
(b) (c) (d)
(e) (f) (g) (h)
Epigeic density (ind.
m
-2 )
Richness of Epigeic Collembol
a a b a b a b Mean
Mean±SE Mean±SD Outliers
Figure 2. Density and richness of springtails and eco-morphological groups in land use systems - no-tillage (NT) and integrated
In the edaphic group, the Ed1 and Ed6 morphotypes were dominant in both systems, with similar abundances. This confirms the SIMPER analysis, where Ed1 (33 %) and Ed6 (26 %) had the highest contributions to dissimilarity between areas, followed by the Ed3 morphotype (13 %), Ed8 (13 %), and Ed23 (7 %), while Ed3 and Ed23 were exclusive to the NT system.
For the hemiedaphic group, the NT system showed 3.25 times more morphotypes that the ICL system. Morphotypes H4, H49, and H16 appeared in both systems. According to SIMPER analysis, the major contributions to dissimilarity were from H4 (24 %) and H49 (21 %) morphotypes; followed by H33 with 16 % (exclusive to the NT); H16 with 14 %; and H50 (exclusive to the NT), H4, and H32 (exclusive in the NT), with 10 %, 4 %, and 3 %, respectively.
Epigeic morphotype composition was better distributed between the LUS, but the morphotypes Ep1, Ep14, and Ep21 were exclusive in NT, and Ep13 and Ep20 in ICL. However, SIMPER analysis showed the morphotypes which most contributed to dissimilarity in the systems were Ep17 (18 %), Ep22 (17 %), Ep5 (16 %), Ep9 (15 %), Ep25 (11 %), Ep15 (9 %), and Ep24 (7 %).
Figure 3. Rank abundance of Collembola morphotypes sampled, where Ed = Edaphic, H = Hemiedaphic, and Ep = Epigeic.
0.0 2.0 4.0 6.0 8.0 10.0 12.0
Ra
nk abundance (Ln)
Edaphi
c
Morphotypes in NT system
0.0 2.0 4.0 6.0 8.0 10.0 12.0
Ra
nk abundance (Ln) Hemiedhapi
c
0.0 2.0 4.0 6.0 8.0 10.0 12.0
R
ank abundance (Ln)
Epigei
c
Morphotypes in ICL system
5 22 17 15 25 9 24 8 21 1 14
33
1 6 3 8 15 4 23 16 1 6 8 12 2 5
16 50 49 4 30 40 32 15 25 37 47 54 4 49 13 16
25 17 15 9 24 5 22 20 8 13
(Ep) (Ep)
(H) (H)
Correlations of Collembola and soil properties in land use systems
The mycelium length of arbuscular mycorrhizal fungi, pH, P, Al, macroporosity, and sand were higher in the NT system than in the ICL system (Table 4). Soil properties affected EM groups, determining the composition of the community structure of Collembola (Table 5). Hemiedaphic and epigeic groups showed correlations with some of the biological, chemical, and physical soil properties in both LUS, especially in NT.
In the NT, the hemiedaphic and epigeic groups were more influenced by changes in soil properties, while the edaphic group showed no correlations with the properties studied. However, the groups of the ICL system were less influenced by soil properties.
DISCUSSION
Soil fauna is vulnerable to the mechanical disturbance caused by soil tillage. It is important to adopt tillage methods which promote the highest possible yield while causing minimum damage to microorganisms and fauna in the soil (Petersen, 2002b) and also find properties that indicate changes in soil quality as a result of the uses adopted.
Table 4. Soil properties (mean ± SD) in land management systems, no-tillage and integrated crop-livestock, of the Catarinense Plateau (state of Santa Catarina, Brazil)
Soil property No-tillage Integrated crop-livestock
MBC (µg C g-1
) 280 ± 113 284 ± 66
BR (µg g-1
h-1
CO2-C) 32.04 ± 12.95 36.91 ± 12.70
qCO2 (µg g -1
h-1
CO2-C) 0.16 ± 0.13 0.14 ± 0.07
qMic (%) 0.80 ± 0.33 0.80 ± 0.25
AP (µg pNP-1 g dm-1 h-1) 319 ± 36 309 ± 58
PN (µg NO2-N -1
g dm-1
5 h-1
) 876 ± 496 642 ± 253
DHA (µg pNP-1
g dm-1
h-1
) 13.67 ± 3.63 12.71 ± 5.30
AMF - ML (m g-1
) 0.72 b ± 0.23 0.84 a ± 026
AMF - MIP (%) 44.26 ± 14.11 53.81 ± 8.84
TOC (g kg-1
) 36.02 ± 12.10 36.84 ± 8.32
POC (g kg-1
) 1.71 ± 0.73 2.42 ± 1.75
TN (g kg-1
) 2.61 ± 0.79 2.70 ± 0.48
pH(H2O) 5.57 a ± 0.26 5.32 b ± 0.24
P (mg dm-3
) 5.67 b ± 2.01 8.57 a ± 5.29
K (mg dm-3
) 128 ± 64 135 ± 51
Al3+
(cmolc dm -3
) 0.13 b ± 0.37 0.44 a ± 0.49
Ca2+
(cmolc dm -3
) 7.47 ± 1.56 7.22 ± 1.30
Mg2+ (cmolc dm -3
) 3.81 ± 0.81 3.77 ± 1.45
Moisture (%) 38.74 ± 9.58 39.87 ± 8.55
Bd (Mg m-3
) 1.01 ± 0.10 1.01 ± 0.06
TP (m3
m-3
) 0.650 ± 0.032 0.652 ± 0.023
Ma (m3
m-3
) 0.199 a ± 0.023 0.186 b ± 0.022
Mi (m3 m-3) 0.451 ± 0.037 0.466 ± 0.029
BP (m3
m-3
) 0.015 ± 0.017 0.015 ± 0.015
SRP (MPa) 1.85 ± 0.69 1.94 ± 0.60
Sand (g kg-1) 185.2 b ± 104.0 259.2 a ± 187.0
Clay (g kg-1
) 471.2 ± 227.7 499.5 ± 221.8
Silt (g kg-1
) 338.0 ± 150.0 241.3 ± 66.9
AS % 2.03 ± 0.28 2.14 ± 0.42
Few studies have worked with the possibility of using EM groups of springtails as indicators of the effects of soil use (Parisi, 2001; Parisi et al., 2005; Vandewalle et al., 2010). Changes in the density and community structure of springtails can have long-term consequences in provision of ecosystem services and show differences between soil uses systems, indicating which system is more conservationist. In addition, there are few studies that report on springtails in integrated crop-livestock systems (Portilho et al., 2011; Bartz et al., 2014a). Moreover, there are no reports of studies exclusively comparing the NT and ICL systems.
Collembola community structure differentiates land use systems
This study found 7,130 ind m-2 in NT and 7,074 ind m-2 in ICL (Figure 2a). In fact, the total density value for Collembola was not enough to demonstrate differences between systems. Domínguez et al. (2014) reported a density of <6,000 ind m-2 of Collembola and there were similar abundances in natural grasslands, organic farming, and no-tillage, with significantly less abundance in conventional tillage. Nevertheless, the density is relevant and might indicate changes between the systems studied, as reported by Sousa et al. (2006), where the abundance of Collembola decreased along a gradient of soil-use intensification in a typical Mediterranean landscape dominated by cork-oak.
When EM groups are observed, the community structure is different between the LUS, confirming our hypothesis. The density and richness of EM hemiedaphic and epigeic groups increased significantly when tillage changed (Figures 2c, 2d, 2g, and 2h). This seems to imply that the NT system has a better-structured surface (litter layer) than
Table 5. Correlations between springtail abundance, eco-morphological groups, and soil properties in each land use system, no-tillage (NT) and integrated crop-livestock (ICL), of the Catarinense Plateau (state of Santa Catarina, Brazil)
No-tillage Integrated crop-livestock
Coll Edap Hemied Epig Coll Edap Hemied Epig
MBC ns ns 0.53** 0.51* 0.48* 0.48* 0.50* ns
BR ns ns ns 0.42* ns ns ns ns
qMic ns ns ns ns ns 0.51* 0.51* -0.43*
PN ns ns 0.63** 0.39* ns ns ns ns
DHA ns ns ns ns ns ns ns -0.61**
AMF-ML ns ns 0.60*** 0.70** ns ns ns ns
AMF-MIP ns ns 0.40* 0.52** ns ns ns 0.61***
TOC ns ns 0.76*** 0.66*** ns ns ns 0.47*
POC ns ns 0.67*** 0.71*** ns ns ns 0.50**
TN ns ns 0.72*** 0.65*** ns ns ns 0.46*
pH(H2O) ns ns ns ns ns ns -0.45* ns
P ns ns 0.40* ns ns ns ns ns
K ns ns -0.54** -0.53** ns ns ns -0.43*
Ca ns ns 0.68*** 0.50* -0.48* -0.46* -0.46* ns
Mg ns ns 0.69*** 0.54** ns ns ns 0.55**
Moisture ns ns 0.70*** 0.68*** ns ns ns ns
Bd ns ns -0.73*** -0.69*** ns ns ns ns
Ma ns ns 0.41* 0.52** ns ns ns ns
Sand ns ns 0.61** 0.62** ns ns ns 0.50**
Clay ns ns -0.52** -0.52** ns ns ns -0.49*
the ICL, since these two groups occupy surface niches up to 0.05 m deep and have greater ability for dispersion, and Ma had a positive correlation with NT (Table 5) and was significantly higher in NT (Table 4). In fact, the dispersing ability and preference habitat of morphotypes restrict the ability to reach and occupy different niches of an ecosystem (Auclerc et al., 2009). In contrast, as there were no differences for the edaphic group and this group had the highest densities, this suggests that in both systems the mineral soil is physically well structured (Bd 1.01 Mg m-3; Table 4), since low dispersion capacity requires in habitat quality.
Thus, the use of total density of springtails without differentiating morphotypes did not help in differentiating the LUS. Since Collembola density did not differ between the LUS, it appears to be an indicator with low sensitivity to changes in land use. However, the richness of collembolans regarding morphotypes, a more refined tool, indicates differences between the systems studied. Likewise, the hemiedaphic and epigeic morphotypes also indicate differences between the systems, though this difference was not found in edaphic morphotypes (Figure 2). This may be related to the fact that the NT system is geared to crop production while the ICL system is used for animal and plant production; the entrance of animals can affect the physical structure of the soil surface, resulting in these differences between morphotypes. The presence of certain morphotypes indicated that the SIMPER analysis explains the variation in soil use systems. Thus, these morphotypes may come to be considered as the most important in these LUS (Figure 3). However, from identification on the species level, these morphotypes can provide information for possible use as bioindicators and what ecosystem services that morphotypes are able to change . It is also important to identify which driver influences the presence of morphotypes in these systems.
Although eco-morphological groups were separated based on their traits and occurrence in the soil and litter (adaptation to the soil environment), vertical stratification by sampling at different depths in the field was not performed. These field samples are important in order to confirm that the morphological traits measured in the laboratory reflect stratification in the field. Christiansen (1964) reports that most of these animals are found in the 0.00-0.10 m profile, depending on the habitat type, although some species are uniformly distributed throughout the profile.
Relationships of soil properties with collembolan communities
Important environmental factors which determine soil fauna composition include vegetation type and biological, chemical, and physical soil properties. These factors affect soil processes in the Collembola communities and vary according to the land use system.
Their relatively large population size and potential influence in nutrient mobilization make Collembola an important component in site productivity and forest system processes (Eaton et al., 2004). In agricultural lands, the existence of a positive correlation between nitrogen and Collembola density was verified (Filser et al., 1999). Similarly, in this study, positive correlations were found between total nitrogen and hemiedaphic (r = 0.72, p<0.001, in NT) and epigeic (r = 0.65, p<0.001, in NT; and r = 0.46, p<0.05, in ICL) groups (Table 5). Likewise, positive correlations were found between potential nitrification groups and hemiedaphic (r = 0.63, p<0.01) and epigeic (r = 0.39, p<0.05) groups, both in NT. Nitrogen mobilization by Collembola might be important for many ecosystems, but is insignificant in a fertilized agricultural soil (Schröder, 2008).
groups. However, this did not occur for the ICL system, in which correlations occurred for Collembola (r = 0.48, p<0.05), edaphic (r = 0.48, p<0.05), and hemiedaphic groups (r = 0.50, p<0.05).
Our results showed relationships between Collembola and eco-morphological groups and exchangeable cations (Ca2+, Mg2+, K+) (Table 5), as already reported in the literature (Cutz-Pool et al., 2007). Nevertheless, the direct action of these soil properties on collembolan species is difficult to show because ecological information on this relationship is still lacking, although, according to Cutz-Pool et al. (2007), they have a significant effect on the composition of Collembola populations.
Densities of springtails are correlated negatively with Bd and positively with macroporosity (Table 5). In most cases, high Bd decreases macroporosity, and this strongly determines the living conditions for Collembola, which inhabit mainly macropores and often show little to no ability to burrow through the mineral soil (Beylich et al., 2010). The absence of correlation between edaphic group and soil density may indicate that, in both systems, depths below 0.05 m were physically well structured for collembolan species (Table 5). Correlations were found in several studies between an increase in soil density and a decrease in the abundance and diversity of edaphic collembolan species (Heisler and Kaiser, 1995; Dittmer and Schrader, 2000). These studies show that soil structure and inhabitable pore space are key properties in the density of edaphic springtails (Larsen et al., 2004), promoting the highest density of soil organisms (Figure 2).
The life-strategy of Collembola (e.g., edaphic, hemiedaphic, and epigeic groups) is differently affected by the intensity of soil tillage, depending on particle size distribution that characterizes their habitat, in association with their ability or lack of ability to burrow (van Capelle et al., 2012). This study showed positive correlations with sand and negative with clay for hemiedaphic and epigeic groups in NT and epigeic in ICL (Table 5), manifesting greater adaptability to sandy soils than clay. However, it was expected that there would be correlation with the edaphic group, since they appear to be most influenced by mineral soil.
Microbial biomass C interacts with higher trophic levels of the soil, as well as collembolan populations. In fact, these interactions with springtails occurred significantly with hemiedaphic (r = 0.53, p<0.01) and epigeic (r = 0.51, p<0.05) groups in NT; and collembolan (r = 0.48, p<0.05), edaphic (r = 0.48, p<0.05), and hemiedaphic (r = 0.50, p<0.05) groups in ICL. In addition, qMic correlated positively with the edaphic (r = 0.51, p<0.05) and hemiedaphic (r = 0.51, p<0.05) groups since the MBC also correlated positively with these groups (Table 5). The existence of these correlations may indicate a greater influence over the
groups that act in the soil profile (below the 5 cm depth) in microbial biomass, because qMic
is an indicator of the efficiency of use of organic matter by soil microorganisms. Negative correlation of qMic (r = -0.43, p<0.05) and the absence of correlation between MBC and the epigeic group may indicate the lack of influence of this group.
CONCLUSIONS
Not only the presence of certain Collembola species, but also the diversity of EM groups is important for soil processes, as soil fertility by feeding on soil microorganisms and dead organic matter.
Collembola EM groups are a better predictor for ecosystem functioning than Collembola density, since they are more easily associated with ecosystem services.
The richness of Collembola morphotypes was more effective in demonstrating differences between land use systems than density.
Variations in morphotypes show correlations with soil properties, whereas the mere presence of Collembola does not.
Even without using the taxonomy of collembolan species, this approach can distinguish differences between soil uses, reducing laboratory analysis time, and may help clarify relationships between collembolan and soil ecosystem services.
ACKNOWLEDGMENTS
We would like to thank the Coordenação de Aperfeiçoamento de Pessoal de Nível Superior
(CAPES) for financial support through the Ciência Sem Fronteiras Project No. 079/2012
(Decifrando as relações entre a diversidade funcional da biota do solo e a prestação de serviços de ecossistema em diferentes sistemas de uso do solo). The authors wish to thank the National Council of Scientific and Technological Development – CNPq (Process: 563251/2010-7 and 307162/2015-0/CNPq) for funding.
REFERENCES
Alef K, Nannipieri P. editors. Methods in applied soil microbiology and biochemistry. London: Academic Press; 1995.
Anderson TH, Domsch KH. The metabolic quotient for CO2 (qCO2) as a specific activity
parameter to assess the effects of environmental conditions, such as pH, on the microbial
biomass of forest soils. Soil Biol Biochem. 1993;25:393-5. doi:10.1016/0038-0717(93)90140-7
Auclerc A, Ponge JF, Barot S, Dubs F. Experimental assessment of habitat preference and dispersal
ability of soil springtails. Soil Biol Biochem. 2009;41:1596-604. doi:10.1016/j.soilbio.2009.04.017 Bandyopadhyaya I, Choudhuri DK, Ponge J-F. Effects of some physical factors and agricultural
practices on Collembola in a multiple cropping programme in West Bengal (India). Eur J Soil Biol. 2002;38:111-7. doi:10.1016/S1164-5563(01)01114-1
Bartz MLC, Brown GG, Orso R, Mafra ÁL, Baretta D. The influence of land use systems
on soil and surface litter fauna in the western region of Santa Catarina. Rev Cienc Agron.
2014a;45:880-7. doi:10.1016/j.apsoil
Bartz MLC, Brown GG, Rosa MG, Klauberg Filho O, James SW, Decaëns T, Baretta D. Earthworm richness in land-use systems in Santa Catarina, Brazil. Appl Soil Ecol. 2014b;83:59-70.
doi:10.1016/j.apsoil.2014.03.003
Berg P, Rosswall T. Ammonium oxidizer numbers, potential and actual oxidation rates in two Swedish arable soils. Biol Fertil Soils. 1985;1:131-40. doi:10.1007/BF00301780
Beylich A, Oberholzer H-R, Schrader S, Höper H, Wilke B-M. Evaluation of soil compaction effects on soil biota and soil biological processes in soils. Soil Till Res. 2010;109:133-43. doi:10.1016/j.still.2010.05.010
Cambardella CA, Elliott ET. Particulate soil organic-matter changes across a grassland cultivation sequence. Soil Sci Soc Am J. 1992;56:777-83.
Caravaca F, Ruess L. Arbuscular mycorrhizal fungi and their associated microbial
community modulated by Collembola grazers in host plant free substrate. Soil Biol Biochem.
2014;69:25-33. doi:10.1016/j.soilbio.2013.10.032
Cassagne N, Gers C, Gauquelin T. Relationships between Collembola, soil chemistry and humus types in forest stands (France). Biol Fertil Soils. 2003;37:355-61. doi:10.1007/s00374-003-0610-9
Chamberlain PM, McNamara NP, Chaplow J, Stott AW, Black HIJ. Translocation of
surface litter carbon into soil by Collembola. Soil Biol Biochem. 2006;38:2655-64.
doi:10.1016/j.soilbio.2006.03.021
Chang L, Wu H, Wu D, Sun X. Effect of tillage and farming management on Collembola in marsh soils. Appl Soil Ecol. 2013;64:112-7. doi:10.1016/j.apsoil.2012.11.007
Christiansen K. Bionomics of Collembola. Ann Rev Entomol. 1964;9:147-78. doi:10.1146/annurev.en.09.010164.001051
Claessen MEC, organizador. Manual de métodos de análise de solo. 2a ed. Rio de Janeiro: Centro Nacional de Pesquisa de Solos; 1997.
Cutz-Pool LQ, Palacios-Vargas JG, Castaño-Meneses G, García-Calderón NE. Edaphic Collembola
from two agroecosystems with contrasting irrigation type in Hidalgo State, Mexico. Appl Soil Ecol. 2007;36:46-52. doi:10.1016/j.apsoil.2006.11.009
Dittmer S, Schrader S. Longterm effects of soil compaction and tillage on
Collembola and straw decomposition in arable soil. Pedobiologia. 2000;44:527-38. doi:10.1078/S0031-4056(04)70069-4
Domínguez A, Bedano JC, Becker AR, Arolfo RV. Organic farming fosters agroecosystem functioning in Argentinian temperate soils: Evidence from litter decomposition and soil fauna.
Appl Soil Ecol. 2014;83:170-6. doi:10.1016/j.apsoil.2013.11.008
Dubeux JCB, Sollenberger LE, Gaston LA, Vendramini JMB, Interrante SM, Stewart RL. Animal behavior and soil nutrient redistribution in continuously stocked Pensacola bahiagrass pastures
managed at different intensities. Crop Sci. 2009;49:1503-10. doi:10.2135/cropsci2008.08.0509 Eaton RJ, Barbercheck M, Buford M, Smith W. Effects of organic matter removal, soil
compaction, and vegetation control on Collembolan populations. Pedobiologia. 2004;48:121-8.
doi:10.1016/j.pedobi.2003.10.001
Eisenhauer N, Sabais ACW, Scheu S. Collembola species composition and diversity effects
on ecosystem functioning vary with plant functional group identity. Soil Biol Biochem.
2011;43:1697-704. doi:10.1016/j.soilbio.2011.04.015
Empresa Brasileira de Pesquisa Agropecuária - Embrapa. Sistema brasileiro de classificação de
solos. 2a ed. Rio de Janeiro: Embrapa Solos; 2006.
Filser J, Dette A, Fromm H, Lang A, Mebes KH, Munch JC, Nagel R, Winter K, Beese F. Reactions of soil organisms to site-specific management: The first long-term study at the landscape level.
Ecosystem. 1999;28:139-47.
Gee GW, Bauder JW. Particle size analysis. In: Klute A, editor. Methods of soil analysis. Physical and mineralogical methods. 2nd ed. Madison: American Society of Agronomy, Soil Science Society of America; 1986. Pt. 1. p.383-411.
Heisler C, Kaiser E-A. Influence of agricultural traffic and crop management on collembola and
microbial biomass in arable soil. Biol Fertil Soils. 1995;19:159-65. doi:10.1007/BF00336153
Hopkin SP. Biology of the Springtails (Insecta: Collembola). Oxford: Oxford University Press; 1997. Kassam A, Friedrich T, Shaxson F, Pretty J. The spread of Conservation Agriculture: justification, sustainability and uptake. Int J Agric Sustain. 2009;7:292-320. doi:10.3763/ijas.2009.0477
Kemper WD, Chepil WS. Size distribution of aggregates. In: Black CA, Evans DD, White JL, Ensminger LE, Clark FE, editors. Methods of soil analysis. Physical and mineralogical methods. Madison: American Society of Agronomy, Soil Science Society of America; 1965. Pt.1. p.499-510.
Margesin R. Acid and alkaline phosphomonoesterase activity with the substrate p-nitrophenyl
phosphate. In: Schinner F, Öhlinger R, Kandeler E, Margesin R, editors. Methods of soil biology.
Berlin: Springer-Verlag; 1996. p.213-7.
Martins da Silva P, Carvalho F, Dirilgen T, Stone D, Creamer R, Bolger T, Souza JP. Traits of collembolan life-form indicate land use types and soil properties across an European transect.
Appl Soil Ecol. 2015;97:69-77. doi:10.1016/j.apsoil.2015.07.018
Melloni R, Cardoso EJBN. Quantificação de micélio extrarradicular de fungos micorrízicos
arbusculares. I. Metodologia empregada. Rev Bras Cienc Solo. 1998;23:53-8. doi:10.1590/S0100-06831999000100008
Öhlinger R. Dehydrogenase activity with the substrate TTC. In: Schinner F, Öhlinger R, Kandeler
E, Margesin R, editors. Methods in soil biology. Berlin: Springer-Verlag; 1996. p.241-3.
Parisi V, Menta C, Gardi C, Jacomini C, Mozzanica E. Microarthropod communities as a tool to assess soil quality and biodiversity: a new approach in Italy. Agric Ecosyst Environ.
2005;105:323-33. doi:10.1016/j.agee.2004.02.002
Parisi V. The biological soil quality, a method based on microarthropods. Acta Naturalia de L’Ateneo Parmense. 2001;37:97-106.
Peel MC, Finlayson BL, McMahon TA. Updated world map of the Köppen-Geiger climate
classification. Hydrol Earth Syst Sci. 2007;11:1633-44. doi:10.5194/hess-11-1633-2007 Petersen H. Effects of non-inverting deep tillage vs. conventional ploughing on collembolan populations in an organic wheat field. Eur J Soil Biol. 2002a;38:177-80.
doi:10.1016/S1164-5563(02)01145-7
Petersen H. General aspects of collembolan ecology at the turn of the millennium.
Pedobiologia. 2002b;46:246-60. doi:10.1078/0031-4056-00131
Portilho IIR, Crepaldi RA, Borges CD, Silva RF, Salton JC, Mercante FM. Fauna invertebrada e atributos físicos e quimicos do solo em sistemas de integração lavoura-pecuária. Pesq Agropec
Bras. 2011;46:1310-20. doi:10.1590/S0100-204X2011001000027
Querner P, Bruckner A, Drapela T, Moser D, Zaller JG, Frank T. Landscape and site effects on Collembola diversity and abundance in winter oilseed rape fields in eastern Austria. Agric Ecosyst Environ. 2013;164:145-54. doi:10.1016/j.agee.2012.09.016
Reeves FB, Wagner D, Moorman T, Kiel J. The role of endomycorrhizae in revegetation
practices in the semi-arid West. II. A bioassay to determine the effect of land disturbance on
endomycorrhizal populations. Am J Bot. 1979;66:14-8. doi:10.2307/2442618
Ringrose-Voase AJ. Micromorphology of soil structure: Description, quantification, application.
Aust J Soil Res. 1991;29:777-813. doi:10.1071/SR9910777
Sawahata T. Hymenial area of agaric fruit bodies consumed by Collembola. Mycoscience.
2006;47:91-3. doi:10.1007/s10267-005-0272-6
Scheu S, Folger M. Single and mixed diets in Collembola: effects on reproduction and stable isotope fractionation. Funct Ecol. 2004;18:94-102. doi:10.1046/j.0269-8463.2004.00807.x
Schröder P. Mesofauna. In: Schröder P, Pfadenhauer J, Munch JC, editors. Perspectives for agroecosystem management - balancing environmental and socioeconomic demands. New York: Elsevier; 2008. p.293-306.
Sechi V, D’Annibale A, Ambus P, Sárossy Z, Krogh PH, Eriksen J, Holmstrup M. Collembola feeding habits and niche specialization in agricultural grasslands of different composition. Soil Biol Biochem. 2014;74:31-8. doi:10.1016/j.soilbio.2014.02.019
Silva FD, Amado TJC, Ferreira AO, Assmann JM, Anghinoni I, Carvalho PCDF. Soil carbon indices
as affected by 10 years of integrated crop-livestock production with different pasture grazing intensities in Southern Brazil. Agric Ecosyst Environ. 2014;190:60-9. doi:10.1016/j.agee.2013.12.005
Sousa JP, Bolger T, Da Gama MM, Lukkari T, Ponge J-F, Simón C, Traser G, Vanbergen AJ, Brennan A, Dubs F, Ivitis E, Keating A, Stofer S, Watt AD. Changes in Collembola richness and diversity along a gradient of land-use intensity: A pan European study. Pedobiologia.
Sparling GP. Ratio of microbial biomass carbon to soil organic carbon as a sensitive indicator of changes in soil organic matter. Aust J Soil Res. 1992;30:195-207. doi:10.1071/SR9920195
Tedesco MJ, Gianello C, Bissani CA, Bohnen H, Volkweiss SJ. Análises de solo, plantas e outros
materiais. 2a ed. Porto Alegre: Universidade Federal do Rio Grande do Sul; 1995. (Boletim técnico, 5).
van Capelle C, Schrader S, Brunotte J. Tillage-induced changes in the functional diversity of soil biota – A review with a focus on German data. Eur J Soil Biol. 2012;50:165-81.
doi:10.1016/j.ejsobi.2012.02.005
Vance ED, Brookes PC, Jenkinson DS. An extraction method for measuring soil microbial biomass C. Soil Biol Biochem. 1987;19:703-7. doi:10.1016/0038-0717(87)90052-6
Vandewalle M, Bello F, Berg MP, Bolger T, Dolédec S, Dubs F, Feld CK, Harrington R, Harrison
PA, Lavorel S, Silva PM, Moretti M, Niemela J, Santos P, Sattler T, Sousa JP, Sykes MT, Vanbergen AJ, Woodcock BA. Functional traits as indicators of biodiversity response to land use changes across ecosystems and organisms. Biodivers Conserv. 2010;19:2921-47. doi:10.1007/s10531-010-9798-9